Bitcoin - All ETF investors will get liquidated! (here is why)Bitcoin can drop below 40k later this year! But before that, in the short term, we may see a final drop to 58k, followed by a huge bear market rally to 85k. If you are confused, let's take a look at my prediction:
Short-term: 58k (wave A on the chart)
Mid-term: 85k (wave B on the chart)
Long-term: 40k (wave C on the chart)
From an investment point of view, after we hit 40k, that would be a great buying opportunity because Bitcoin will probably go to 200k in the next years!
Why can Bitcoin go to 58k in the immediate short term? There are 2 very important levels that are waiting to be hit. The first is the 0.618 Fibonacci retracement of the previous bear market on the non-LOG scale, and the second is the 200-week simple moving average (SMA). Bitcoin bounced off 60k, but we didn't hit these levels, so that means we probably are going to go down very soon. When Bitcoin hits 58, that would complete the wave (A) of the bear market.
After that we may see a big rise to 85k (wave B), when everyone will think that the bottom is in, and these people may invest all their money into the crypto market. But do not get caught! We want to wait for wave (C). Your entry point is at 40k or lower!
What about all the ETF investors? Let's take a look at the BlackRock Bitcoin ETF chart. To me it looks like a huge trap for all investors that invested in Bitcoin in 2024 and 2025. The banks and huge institutions will probably take all stop losses and liquidity below the current all-time low. Does it make sense to you?
Why do whales need your stop losses? They have an enormous amount of money, and they need your order to get "filled" into the crypto market. They cannot buy Bitcoin from no one. They need your orders to enter the crypto space. That's why they cannot send Bitcoin to the upside, and instead they need to manipulate the price and crash Bitcoin again and again. In other words, they will make much more money by sending the price of Bitcoin down!
Write a comment with your altcoin + hit the like button, and I will make an analysis for you in response. Trading is not hard if you have a good coach! I am very transparent with my trades. Thank you, and I wish you successful trades!
Community ideas

Bitcoin - Weekly Outlook: Smart Money Defends the WickMarket Context
Bitcoin recently delivered an aggressive move lower, printing a large weekly wick that immediately signaled strong participation from buyers. Instead of allowing price to drift deeper, the market reacted precisely around the midpoint of that wick, an area that often acts as a technical equilibrium between buyers and sellers. When price respects such a level, it typically suggests that higher timeframe participants are stepping in, rather than short-term traders attempting a temporary relief rally.
Higher Timeframe Signal
Filling half of a weekly wick is rarely random. It represents a partial rebalance of inefficiency created during the impulsive move, while still leaving room for continuation in the original direction once the market stabilizes. The bounce that followed reinforces the idea that the sell pressure may have reached a short-term exhaustion point. When a reaction aligns this cleanly with a higher timeframe reference, it often becomes the foundation for the next structured move.
Lower Timeframe Confirmation
Dropping into the 4H chart, the reaction becomes even more convincing. Price not only respected the midpoint but also generated a clear displacement away from the level, leaving behind a gap. Gaps tend to act as magnets because the market naturally seeks efficiency, and unfinished business often gets revisited before continuation occurs. As long as structure remains supportive, the expectation shifts toward a retracement into that imbalance rather than immediate weakness.
The Role of the Gap
The newly formed gap provides a logical pathway for price. Rather than chasing momentum, a controlled pullback into the imbalance would signal healthy market behavior, absorbing liquidity while preparing for a potential expansion. These types of movements are typically constructive, not bearish, because they demonstrate that buyers are willing to defend higher territory instead of allowing price to collapse back into prior ranges.
Daily Objective
With the weekly reaction acting as the anchor and the 4H gap offering a technical roadmap, the next area of interest becomes the daily key level above. Daily levels tend to attract price once momentum shifts, especially when the market transitions from a defensive bounce into a more deliberate recovery phase. If buyers maintain control, a move toward that daily objective would represent a natural progression rather than an overextension.
Conclusion
The combination of a weekly midpoint reaction, strong bounce behavior, and the presence of a fresh imbalance creates a structured narrative: rebalance first, then rotate higher. While short-term fluctuations are always possible, the current framework favors a gap fill followed by continuation toward the daily level, provided buyers continue to defend the higher timeframe support.
___________________________________
Thanks for your support!
If you found this idea helpful or learned something new, drop a like 👍 and leave a comment, I’d love to hear your thoughts! 🚀

Gold next move (weekly forecast) (16th Feb - 20th Feb-2026)Go through the analysis carefully, and do trade accordingly.
Anup 'BIAS for the week (16th Feb - 20th Feb-2026)
Current price- 5005
"if Price stays below BIAS LEVEL 5080-85, then the next target is 4900, 4800 and 4760 and Above it 5200 and 5350"
Reason:
WEEK= previous week candle swept the BSL liquidity and candle formation was inside bar.
Daily= price swept the BSL and could not fill the FVG above.
4H= there was manipulation and BSL swept after accumulation and break the range.
Present Scenario:
on 1D price last candle fill the FVG, which is indicates price may reverse from here but we are waiting for price closes below 4950 on 1H time frame and after the SSL sweep around 4760.
-POSSIBILITY-1
Wait (as geopolitical situation are worsening )
-POSSIBILITY-2
Wait (as geopolitical situation are worsening)
Best of luck
Never risk more than 1% of principal to follow any position.
Support us by liking and sharing the post.

Bitcoin - Small correction before a big move upBitcoin is currently trading around $70,000 after recovering from a recent low. The market structure on the 4-hour timeframe shows a clear reaction from a liquidity event followed by a controlled move higher. However, price is now approaching a decision point as momentum begins to slow. The interaction between the recent liquidity sweep, the 4-hour bullish FVG, and the higher resistance FVG will likely determine the next directional move.
Liquidity Sweep
Before the recent recovery, Bitcoin performed a clear liquidity sweep below the previous short-term lows. Price briefly traded beneath the range, triggering stops and collecting sell-side liquidity, before sharply reversing upward. This type of move often signals that the market has completed a short-term corrective phase and is ready for expansion in the opposite direction. The strong reaction from that sweep confirms that buyers were waiting below the lows, using that liquidity event as fuel for the upside move.
4H Bullish FVG
Following the liquidity sweep, price impulsively moved higher, creating a 4-hour bullish fair value gap. This zone now acts as strong support and represents the area where buyers stepped in aggressively. As long as Bitcoin holds above this 4H bullish FVG, the short-term structure remains constructive. A retracement into this zone would not necessarily be bearish; instead, it could provide a healthy pullback to rebalance inefficiencies before continuation higher. A clean hold of this support would reinforce bullish positioning.
Decreasing Volume and Momentum
As price pushes upward, volume and momentum appear to be decreasing. The recent candles show less expansion compared to the initial impulsive move off the lows. This slowdown suggests that buyers are becoming less aggressive near current levels, potentially due to overhead resistance. When momentum fades into resistance, the market often either consolidates or retraces before attempting the next leg. This increases the probability of a temporary pullback into the 4H bullish FVG before continuation.
Target
The primary upside target sits at the 4-hour bearish FVG above, around the $74,000 – $75,000 region. This zone represents unfilled imbalance and prior selling pressure, making it a logical magnet for price. Markets are naturally drawn toward inefficiencies, and as long as the bullish structure remains intact, this area serves as the next key objective. A decisive break above that bearish FVG would open the door for further upside expansion.
Conclusion
Bitcoin remains structurally bullish after the liquidity sweep and strong recovery from the lows. The 4-hour bullish FVG provides clear support, while the bearish FVG above acts as the main upside target. However, decreasing momentum suggests that a short-term pullback into support is possible before continuation. As long as the bullish FVG holds, the bias favors an eventual move toward the higher imbalance zone.
-------------------------
Thanks for your support. If you enjoyed this analysis, make sure to follow me so you don't miss the next one. And if you found it helpful, feel free to drop a like 👍 and leave a comment 💬, I’d love to hear your thoughts!

NZD/JPY - Trendline Break – Bulls Taking Control? (16.02.2026)📊 Description ✅ Setup OANDA:NZDJPY
NZDJPY has been in a clear downtrend, respecting a descending trendline with multiple rejections (A–C). Now price is reacting from a key demand/support zone and attempting a trendline breakout.
Confluences:
✔ Descending trendline breakout attempt
✔ Demand/support zone reaction
✔ Ichimoku cloud support
✔ Volume profile interest at lows
✔ Structure forming higher lows
This suggests potential shift from bearish to bullish momentum.
🧱 Support & Resistance
🔻 Support Zone: 91.90 – 92.15
🔺 1st Resistance: ~93.18
🔺 2nd Resistance: ~93.58
These are key reaction levels to watch.
⚠️ Disclaimer
This analysis is for educational purposes only.
Not financial advice. Always use proper risk management.
#NZDJPY #ForexTrading #PriceAction #SupportAndResistance #TrendlineBreak #ForexAnalysis #TradingViewIdeas #SmartMoney #FXTrading
🙌 Call to Support If this idea helps you:
👉 Hit Like ❤️
👉 Share your bias in comments 💬
👉 Follow for more FX setups 📈
Happy trading & stay disciplined! 🚀

Gold Holding Support - Path Toward 5,150 OpensHello traders! Here’s my technical outlook on XAUUSD (4H) based on the current chart structure. Gold previously traded within a steady bullish structure, moving inside a clearly defined ascending channel where price respected both the dynamic support and resistance boundaries. This phase showed consistent buyer control, with higher highs and higher lows confirming sustained upward momentum. Eventually, price broke above the channel resistance, accelerating into a strong impulsive rally that pushed the market into the Seller Zone near 5,150, where aggressive selling pressure emerged. Following this spike, gold experienced a sharp bearish reaction and quickly retraced lower, marking a temporary structural shift. However, the decline found strong support near the 4,980 Buyer Zone, which aligns with the horizontal support level and the developing rising trend line from the recent lows. This reaction confirmed that buyers remain active at demand and that the broader bullish structure has not been invalidated. Currently, XAUUSD is consolidating above the Buyer Zone while respecting the rising support line from below. Price action shows compression just under the Seller Zone and resistance level, suggesting the market is stabilizing after the volatility and preparing for the next move. The recent breakout from the consolidation hints at renewed bullish pressure, while the overall structure still favors continuation as long as support holds. My primary scenario favors bullish continuation, as long as XAUUSD remains above the 4,980 Buyer Zone and continues to respect the rising support line. If buyers maintain control, price could gradually push higher toward the 5,150 Seller Zone (TP1), which serves as the main upside target and the key area where sellers may attempt another reaction. A clean breakout and acceptance above this level would confirm trend continuation and open the door for further upside expansion. However, a decisive rejection from resistance or a breakdown below the Buyer Zone and rising support would weaken the bullish scenario and signal a deeper corrective phase. For now, market structure favors buyers, with demand holding firm and price compressing beneath resistance — a classic setup for a potential continuation move. Please share this idea with your friends and click Boost 🚀

XAUUSD: Bullish Structure Holds - Buyers Target 5,110 ResistanceHello everyone, here is my breakdown of the current XAUUSD setup.
Market Analysis
XAUUSD is trading within a broader bullish environment after a strong impulsive advance earlier in the structure. This initial rally was supported by a clearly defined upward channel, confirming strong buyer control and sustained demand. Following this impulsive leg, price reached a major Resistance Zone, where bullish momentum stalled and aggressive selling pressure entered the market. This resulted in a sharp corrective move to the downside, breaking the short-term bullish channel and triggering a deep pullback. Despite the intensity of the drop, sellers failed to fully reverse the broader trend, as price eventually found strong support at a lower demand area, where buying interest re-emerged decisively.
Currently, from this support, gold rebounded strongly, reclaiming key structure levels and forming a series of higher lows. The recovery phase transitioned into consolidation, with price moving sideways inside a clearly defined range just above the Support Zone. This range signals equilibrium between buyers and sellers, suggesting absorption rather than distribution. A breakout from this range to the upside confirmed renewed buyer strength and reinforced the bullish bias. Importantly, price continues to respect a rising triangle support line, indicating that demand is stepping in at progressively higher levels.
My Scenario & Strategy
My primary scenario remains bullish as long as XAUUSD holds above the Support Zone around 5,000 and continues to respect the ascending support line. The current consolidation above support appears corrective rather than distributive, favoring continuation. A sustained move higher could drive price toward the key Resistance Zone near 5,110 (TP1), where sellers may attempt to react again.
However, a decisive breakdown below the support zone and loss of the rising structure would weaken the bullish case and open the door for a deeper corrective phase. Until that happens, market structure, trend behavior, and demand dynamics continue to favor buyers.
That’s the setup I’m tracking. Thank you for your attention, and always manage your risk.

EURUSD Short: Bearish Triangle Building Below SupplyHello traders! Here’s my technical outlook on EURUSD (1H) based on the current chart structure. EURUSD was previously trading within a well-defined descending channel, where price respected both the dynamic resistance and support boundaries while forming consistent lower highs and lower lows. This structure confirmed steady bearish pressure and controlled downside continuation rather than impulsive panic selling. Eventually, price broke below the lower boundary of the channel, confirming continuation of the bearish leg and reinforcing seller dominance. After this breakdown, the market entered a consolidation phase, forming a horizontal range where price moved sideways as buyers attempted to absorb supply while sellers paused after the impulsive drop. Later, EURUSD broke out of this range to the upside, initiating a recovery move that pushed price back toward the major Supply Zone near 1.1890. However, the bullish impulse failed to sustain acceptance above this area. Price formed another consolidation just beneath supply, while a descending supply trend line emerged, showing that sellers remain active at higher levels.
Currently, EURUSD is compressing between the descending supply line from above and a rising demand line from below. This tightening structure signals volatility contraction and suggests that a directional breakout is approaching. Importantly, price continues to trade below the key Supply Zone, indicating that recent bullish attempts may still be corrective in nature rather than the start of a new trend.
My primary scenario favors bearish continuation as long as EURUSD remains below the 1.1890 Supply Zone and continues to respect the descending supply line. The current compression structure appears more consistent with distribution rather than accumulation, suggesting that sellers may regain control once price breaks lower from the pattern. If bearish momentum resumes, the next logical downside target lies near the 1.1830 Demand Zone (TP1), which aligns with previous breakout levels and a key area where buyers previously stepped in. This zone represents the most probable location for price to seek liquidity and potentially stabilize. However, a strong breakout and sustained acceptance above the supply line and resistance zone would invalidate the bearish scenario and suggest a broader recovery or range expansion to the upside. For now, structure favors sellers, with rallies viewed as corrective unless resistance is reclaimed. Manage your risk!

GOLD - The range 4900 - 5100 is narrowing. Positive background..FX:XAUUSD is trading without clear dynamics due to holidays in the US and China, which have reduced market activity. However, the battle for the 5000 zone continues...
The main macro releases will only come out on Friday. Until then, the market will be guided by general sentiment.
Inflation supported rate expectations: The slowdown in CPI in January reinforced expectations of two Fed rate cuts this year.
The decline in Treasury yields and the weakening of the dollar after the release of inflation data provide fundamental support for gold.
Gold is consolidating after Friday's rise, holding key levels of 4990-4950. The fundamental backdrop remains favorable. Further momentum will come after the release of GDP data at the end of the week.
Technically, the market may close within the range of 4990 (4902) - 5090. In this case, trading can be considered relative to the channel boundaries and intermediate levels located inside, until a driver appears.
Resistance levels: 5090 - 5100, 5150
Support levels: 4990, 4945, 4902
A retest of support could trigger a price increase to the trigger, but until a driver appears, the market may remain within the flat range. Thus, we can consider a rebound up from support and a rebound down from resistance.
Best regards, R. Linda!

EURUSD Holding Demand, Preparing for a Move Toward 1.1930Hello traders! Here’s my technical outlook on EURUSD (3H) based on the current chart structure. EURUSD previously transitioned from a bearish environment into a clear bullish recovery after breaking out of a descending channel. This breakout marked a shift in market control, as buyers stepped in aggressively and drove price higher with strong impulsive momentum. Following this move, price established a rising trend line, confirming a new bullish structure with higher highs and higher lows. The impulsive advance eventually led price into a Seller Zone around the 1.1930 area, where bullish momentum slowed and a corrective phase began. This correction was healthy in nature, as it did not immediately break the broader bullish structure but instead signaled temporary profit-taking. After the correction, EURUSD pulled back toward the Buyer Zone near 1.1850, which aligns with a key support level and the rising trend line. Price briefly broke below this area, creating a fake breakout, but quickly reclaimed the level — a strong sign of buyer absorption and demand acceptance. This false breakdown trapped late sellers and reinforced the validity of the support zone. From there, price moved into a consolidation range, indicating balance between buyers and sellers while the market builds energy for the next directional move. Currently, EURUSD is holding above the Buyer Zone and respecting the ascending trend line, which keeps the bullish structure intact. Price action remains constructive, with higher lows forming above support and no decisive acceptance below demand. The market is now pressing higher toward the descending resistance line and the 1.1930 Resistance Level, which represents the next major upside objective and a potential reaction zone. My scenario: as long as EURUSD holds above the 1.1850 Buyer Zone and continues to respect the rising trend line, the bullish bias remains valid. A sustained push higher could lead to a retest of the 1.1930 resistance level (TP1), where sellers may attempt to slow price. A clean breakout and acceptance above this resistance would confirm further bullish continuation. However, a decisive breakdown and acceptance below the Buyer Zone and trend line would invalidate the bullish scenario and signal a deeper corrective phase. For now, market structure and price behavior continue to favor buyers. Please share this idea with your friends and click Boost 🚀

Gold Set for Bounce Toward 5,135Gold is ranging between key support and resistance. Price is holding above 4,945 support while major support sits near 4,877. A bounce from support could push price toward 5,043 and the 5,135 target zone. Buyers remain in control unless price breaks below support.

GOLD Consolidation Phase Both sides defined rangeGold remains in a consolidation phase, with price action moving within a defined range. The broader bias stays bullish as long as the key 5000 support level holds.
Technically, today’s price decline appears to be driven by thin trading volume. With the U.S. and China markets partly inactive due to local public holidays, liquidity has been limited. Additionally, some traders booked profits following the strong 2.5% jump in the previous session.
Gold has also given back part of Friday’s CPI-driven gains amid thinner trading conditions and a lack of fresh bullish catalysts.
Technical Outlook If price continues to hold above the 5000 support level, we could see an upside move toward 5070 – 5122 if the price shows weakness and breaks below 5000, the next support levels are seen near 4945, followed by 4880, before a potential recovery attempt.
You may find more details in the chart,
Trade wisely best of luck buddies,
Ps; Support with like and comments for better analysis Thanks for Supporting.
Selelna | Xauusd Market Analysis Structure Buy MondayPEPPERSTONE:XAUUSD
Market Overview:
Price pulled back into a strong demand zone after rejecting 5,100 resistance.
Holding above 4,920 keeps the short-term bullish continuation bias intact.
TP1: 5,040
TP2: 5,100
Entry: 4,950 – 4,980
Stoploss: 4,900
(For educational purposes only.)

GBPJPY Range Accumulation – Risky Long Setup Toward 210.15GBPJPY Range Accumulation – Risky Long Setup Toward 210.15
GBPJPY is showing signs of accumulation after multiple rejections from the 207.60–207.90 demand zone.
Price is currently consolidating above support while forming higher lows, suggesting bullish pressure is building.
Immediate resistance sits at 209.25, a key intraday supply level that must be cleared for continuation.
A clean break and hold above this zone opens the path toward the next major liquidity pocket around 210.15.
⚠️ This setup is labeled “very risky” because price remains manipulated by the Bank of Japan.
You may find more details in the chart.
Thank you and good luck! 🍀
❤️ If this analysis helps your trading day, please support it with a like or comment ❤️

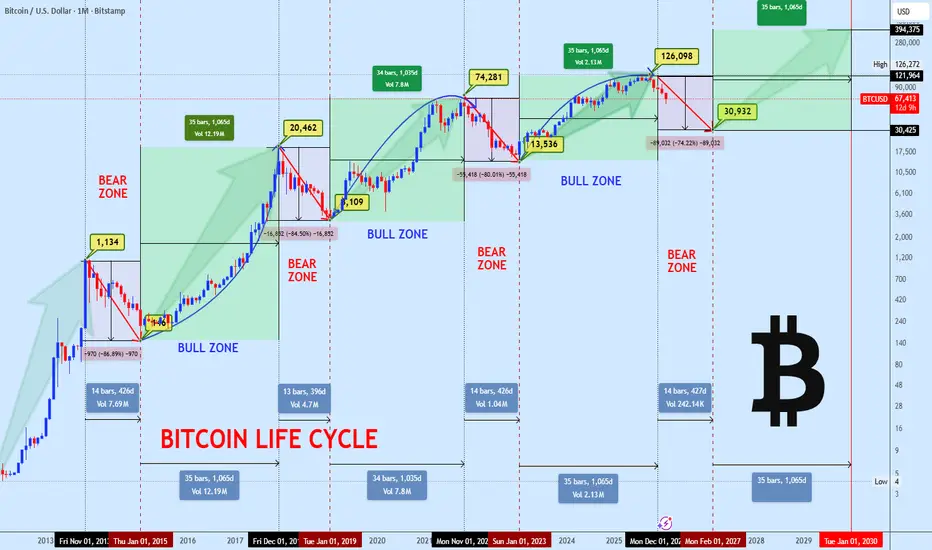
BITCOIN MACRO UPDATE LIFE CYCLE, STRUCTURE & PRICE LEVELSIt is timely to revisit the typical crypto market cycle, as Bitcoin continues to respect it with remarkable precision.
The macro top was confirmed in October, when BTC tested the $126,000 zone, marking the current cycle ATH. Since that rejection, price has transitioned into a prolonged consolidation phase, which structurally aligns with the early stages of a broader bear market cycle.
From a wave structure perspective, price action is developing an extended corrective formation (ABC). The initial decline from $126K to the $59K region completes Wave A. Current market behavior suggests a potential Wave B recovery toward the key supply and resistance band around $84,800–$90,000, where sellers are expected to reassert control.
Failure to reclaim and hold above this supply zone would likely trigger Wave C, with downside continuation toward the $34,000–$30,000 projected target area. This zone aligns with historical demand, prior cycle accumulation, and long-term value based interest making it a critical region for strategic accumulation, not panic.
Cycle analysis indicates that this corrective phase may extend into early 2027, setting the stage for the next major accumulation and recovery phase. While short- to mid-term volatility and downside risk remain valid, the broader macro structure continues to support higher prices long term, with expansion potential toward $200,000+ once the cycle reset completes.
EURUSD Price Update – Clean & Clear ExplanationEUR/USD is currently trading around 1.1864, moving within a short-term consolidation phase after a strong bullish rally earlier in the week. Price initially broke above the ascending channel but failed to sustain momentum, leading to a sharp pullback and a transition into sideways movement.
The EURUSD is now hovering near a minor intraday resistance zone around 1.1865–1.1880. A sustained break above this area could open the path toward the 1.1895–1.1910 supply zone, where sellers may re-enter the market. However, upside momentum appears limited unless buyers regain strong control.
On the downside, immediate support is seen near 1.1830 (1st support), while a deeper correction could extend toward the 1.1800 level (2nd support). A break below 1.1830 would likely increase bearish pressure and shift short-term sentiment in favour of sellers.
Overall, the pair remains neutral-to-bearish in the short term unless it decisively breaks above the upper resistance zone. Traders should watch for a breakout from the current range for the next directional move.
“If you come across this post, please like, comment, and share. Thanks!”

BTCUSDT: Range Compression Signals Incoming Move To $72,300Hello everyone, here is my breakdown of the current BTCUSDT setup.
Market Analysis
BTCUSDT previously traded inside a clearly defined range near the highs, where price moved sideways while forming equal highs and lows. This structure reflected temporary balance between buyers and sellers rather than immediate continuation. Eventually, price broke down from this range and entered a well-structured downward channel, confirming increasing bearish pressure and a shift in short-term control toward sellers. Following this reaction, BTC broke out of the descending channel, signaling a potential momentum shift. After the breakout, price entered a new consolidation range above support, suggesting that the market is transitioning from impulsive selling into accumulation. This range is now developing above the rising triangle support line, showing that buyers are gradually gaining strength while volatility compresses.
Currently, BTCUSDT is trading near the upper boundary of this range and just below the Resistance Zone around 72,300. Price compression between rising support and horizontal resistance often precedes a directional expansion, and the recent higher lows indicate that buyers are slowly taking control.
My Scenario & Strategy
My primary scenario favors a bullish continuation as long as BTCUSDT holds above the 69,300 Support Zone and continues to respect the rising triangle support line. The current consolidation appears to be accumulation rather than distribution, suggesting that buyers may be preparing for another push higher. If BTC manages to break above the range high and gain acceptance above the 72,300 Resistance Zone, this would confirm bullish continuation and open the path toward higher liquidity areas. A successful breakout could trigger a momentum expansion as trapped shorts unwind and breakout buyers step in.
However, if price fails to hold above support and breaks back below the triangle structure, this would weaken the bullish case and shift focus back toward range lows or deeper downside continuation. For now, structure and price behavior suggest that buyers are attempting to regain control, with support holding firm and resistance being gradually tested.
That’s the setup I’m tracking. Thank you for your attention, and always manage your risk.

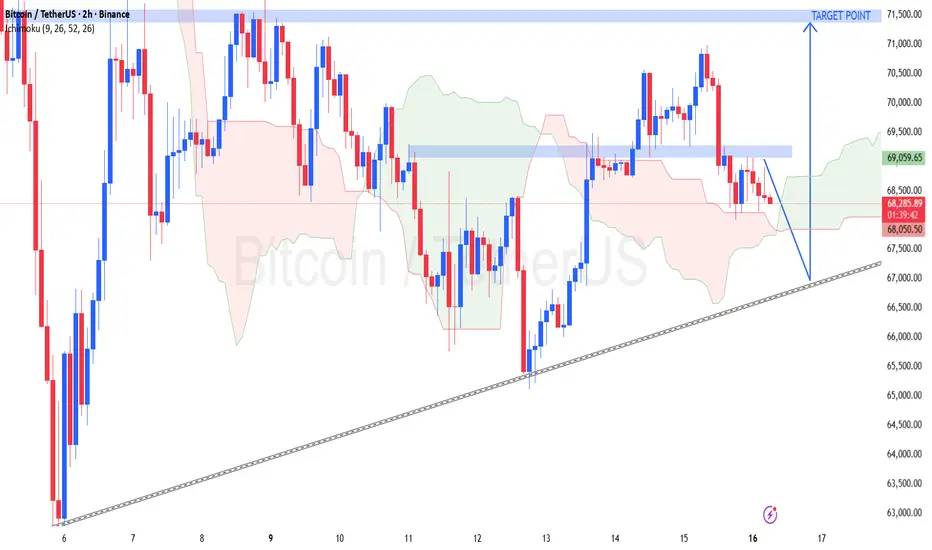
BTCUSDT (2H) —CHART)...BTCUSDT (2H) —CHART).
Based on MY chart, BTC is currently trading inside a healthy ascending structure with price respecting a rising trendline and reacting from a key demand/support zone. The market recently faced rejection from the upper resistance area and is now making a controlled pullback, which is a normal behavior before continuation.
🔍 Technical Breakdown
🧭 Market Structure
Overall structure is bullish (higher highs & higher lows)
Current move is a pullback, not a trend reversal
Price is holding above the ascending trendline, which is acting as dynamic support
☁️ Ichimoku Insight
Price is hovering near the Kumo (cloud) → indicating consolidation
As long as BTC holds above the cloud base, bullish continuation remains valid
A strong bullish candle above the cloud will confirm momentum
🟦 Support & Demand Zone
Strong horizontal support around 67,800 – 68,200
This zone aligns with:
Trendline support
Previous breakout area
Cloud support
This makes it a high-probability reaction zone.
🎯 Bullish Targets (Primary Plan)
If price holds above 67,800 and shows bullish confirmation:
TP1: 69,500
TP2: 70,200
TP3: 71,000
Final Target: 71,500 🚀
📈 This aligns with previous highs and the projected measured move shown on MY chart.
📉 Bearish Scenario (Invalidation Plan)
If BTC breaks and closes below 67,500 (2H close):
TP1: 67,000
TP2: 66,500
TP3: 65,800
⚠️ A break below the trendline would temporarily shift momentum bearish.
🛑 Risk Management
Safe SL for longs: Below 67,300
Trade only after confirmation candle near support
Avoid entries in the middle of consolidation
🧠 Conclusion
Trend = Bullish
Current phase = Pullback / Accumulation
Bias = Buy from support → Sell at resistance
As long as BTC stays above 67,800, 71,500 remains the main upside target.
Order Blocks - What makes them high probablity onesHey whats up traders, today we will go again in the bullet points. Most traders and indicators mark order blocks everywhere. But just some of them works, few understand why some works and some not. I want give some important points that once I understood properly and combined it with the CLS range manipulation everything became more mechanical and less emotional.
What I will try to explain today is key. Because it's mainly about market context. Please take note and pen and try to understand it and dont hesitate to comment with questions.
📌 Order block Definition It can be used as a entry or a key level. It's foundation of the markets movements.
‼️ But why it works sometimes and sometimes not ? Market Context
As you read in the details above it must be placed in the liquidity.
📌 External & Internal Liquidity
This is nothing else then situation when price is swapping old highs and lows in case fore external or when its making a pullback internally in to a swing - mostly in to the FVG and also TR candle which is the candle low / high of candle which transitioned the 50% of the swing. Only in these zones the order block is powerful 📌 3) Anatomy of the Order Block
Order block is confirmed after close above/ below consecutive candles or last up/ down candle. (Which one use when I will tell you later ) 🧪 Order block midpoint - 50% of the order block price should never close below / above this level otherwise it makes it weak 🧪FVG - Every order block should have FVG a price ofter retrace in to it thats best entries, but requires patience. Later I will show you when I wait for the pullback and when not.
📌 LTF Order block nested in HTF
Price is fractal here is example how to make best eateries. HTF order block - followed by pullback to the FVG inside that FVG - you find LTF order block. Again it has to be in the discount liquidity (below 50%) internal liquidity of the whole swing 📌 Should I use Last candle or All consecutive candles?
Price is fractal so if you have last candle OB on daily drop it to the LTF you will see confirmation. As on picture bellow. H4 - all consecutive candles confirming order block, while on D1 it was just one daily candle. If HTF key level - Order block or its midpoint was hit in the external liquidity as the example below, you can use last candle close as ob, but it has to right timeframe. Don't try to catch reversal from monthly key level on M5 order block 📌 Candle close is important
always wait for the candle close, I was caught many times in early entry because not waiting for the close. Once it closes on the external liquidity you can predict target in the internal as I did it on BTC example below. Price closed and confirmed order block since that moment I knew we will see prices around 67K as we are just now. Add these knowledge to what you already know and I hope your trading success will improve even better than you already are.
For more examples of order block application just go to my profile every trade I post is based on the Order blocks levels.
I promised myself I’d become the person I once needed the most as a beginner. Below are links to a powerful lessons I shared on Tradingview. Hope it can help you avoid years of trial and error I went thru.
📊 Sharpen your trading Strategy
⚙️ 100% Mechanical System - Complete Strategy
🔁 Daily Bias – Continuation
🔄 Daily Bias – Reversal
🧱 Key Level – Order Block
📉 How to Buy Lows and Sell Highs
🎯 Dealing Range – Enter on pullbacks
💧 Liquidity – Basics to understand
🕒 Timeframe Alignments
🚫 Market Narratives – Avoid traps
🐢 Turtle Soup Master – High reward method
🧘 How to stop overcomplicating trading
🕰️ Day Trading Cheat Code – Sessions
🇬🇧 London Session Trading
🔍 SMT Divergence – Secret Smart Money signal
📐 Standard Deviations – Predict future targets
🎣 Stop Hunt Trading
💧 Liquidity Sweep Mastery
🔪 Asia Session Setups
📀 Gold Strategy
🧠 Level Up & Mindset
🛕 Monk Mode – Transition from 9–5 to full-time trading
⚠️ Trading Enemies – Habits that destroy success
🔄 Trader’s Routine – Build discipline daily
💪 Get Funded - $20 000 Monthly Plan
🧪 Winning Trading Plan
⭕ Backtesting vs Reality
🛡️ Risk Management
🏦 Risk Management for Prop Trading
📏 Risk in % or Fixed Position Size
🔐 Risk Per Trade – Keep consistency
🧪 Risk Reward vs Win Ratio
💎 Catch High Risk Reward Setups
☯️ Smart Money - Who control Markets
Adapt useful, Reject useless and add what is specifically yours.
David Perk

XAUUSD Bullish Break: Higher Low Confirms Gold UpsideGold (XAUUSD) is currently trading around the 5,040 – 5,050 zone, holding above a key internal support area after printing a clear Change of Character (ChoCH) followed by a Higher Low (HL).
The structure shows:
Previous Lower High (LH) formation
Break in structure → ChoCH
Formation of Higher High (HH)
Recent pullback into demand → New Higher Low (HL)
This sequence confirms a bullish market structure shift on the short-term timeframe.
🔎 Key Technical Observations
1️⃣ Change of Character (ChoCH)
Price broke the prior lower high, signaling the first shift from bearish to bullish order flow. This was the early indication that sellers were losing control.
2️⃣ Higher High (HH)
After the ChoCH, price expanded and printed a new higher high, confirming bullish intent and continuation potential.
3️⃣ Higher Low (HL) Retest
The current pullback respected the internal demand zone (green area) and formed another higher low — maintaining bullish structure integrity.
As long as price holds above the 4,900–4,950 support zone, upside pressure remains valid.
📈 Bullish Scenario
If buyers maintain control:
Short-term pullbacks remain buy opportunities
Liquidity above 5,100–5,200 becomes the next target
Expansion toward 5,300+ is possible if momentum increases
The projected path suggests consolidation followed by impulsive continuation toward previous supply liquidity.
📉 Bearish Invalidation
Bullish bias fails if:
Price closes strongly below 4,900
Structure shifts back into lower highs and lower lows
Demand zone gets decisively broken
Until then, the market structure favors buyers.
🧠 Trading Insight
This setup reflects classic Smart Money Concepts (SMC):
Liquidity sweep
Structure break (ChoCH)
Internal demand mitigation
Higher low continuation
Patience during pullbacks is key. Chasing breakouts without structure confirmation increases risk.
🔑 Key Levels to Watch
Support: 4,900 – 4,950
Intraday Resistance: 5,100
Liquidity Target: 5,200 – 5,300
Invalidation: Below 4,900
📌 Conclusion
Gold has transitioned from corrective behavior into a structured bullish phase. The formation of higher highs and higher lows suggests accumulation rather than distribution.
If demand continues to hold, XAUUSD could expand toward new short-term highs in the coming sessions.

Bitcoin: 80% 80K Price Objective. While the Broader structure is pointing bearish, recent consolidation after testing the 60K area support suggests a potential bullish retrace with an 80K price objective. There are 3 key support areas or "order blocks" to be aware of. The 59K to 60K (weekly) and the 66K to 68K area where price is fluctuating now. How you define risk will depend on the time frame you use to confirm an entry. In this time frame (12H) risk can be defined by the 66K level. This is where stop loss orders should be considered if a reversal confirmation appears.
The scenario on this chart illustrates the potential retrace scenario. Keep in mind this is not a broader trend change. There are two forms of confirmation: the failed low followed by a bullish reversal pattern (pin bar) or a resistance break (71K).
The broader wave count is what I consider a Wave 2. This is a corrective wave which can test MUCH lower prices (50K). This type of structure is NOT necessarily bearish, although the sentiment can lean extreme at times. In my opinion, I like to compare it to the multi year Gold consolidation before breaking out to where it is now. Bitcoin is no stranger to multi year consolidations either. The key is not to lose site of this possibility, ESPECIALLY IF range lows are tested around 50K or lower.
Remember what the "experts" were saying a few months earlier? 200k? No one was expecting a test of 59K. PERCEPTION CHANGES. Back in December Powell and the FED were hinting at lower rates, QE, and cheap money everywhere. That story and PERCEPTION has changed. Now we have "less" rate of inflation as per the recent CPI report, and a stronger job market than expected thanks to the recent NFP report (I think F stands for 'fake'). ANYWAY. the point is. markets move on the PERCEIVED future, NOT the actual future.
Bitcoin and the alt coins NEED a catalyst or series of catalysts to jump start the bullish market again. More rate cuts, continued global M2 expansion, lower bond yields across all the maturities, etc. "Bear Market" rallies are more probable from here which is why I anticipate a 80% probability that price tests the 80K objective over the coming two weeks. A probability is NOT a concrete forecast and price can go the other way as well, it all depends on what captures the perception of the market. Keep an OPEN mind and RISK under control.
Thank you for considering my analysis and perspective.

GOLD 1H CHART ROUTE MAP UPDATE & TRADING PLAN FOR THE WEEKHey Everyone,
Please see our 1h chart levels and targets for the coming week.
We are seeing price play between two weighted levels with a gap above at 5085 and a gap below at 4954, as support. We will need to see ema5 cross and lock on either weighted level to determine the next range.
We will see levels tested side by side until one of the weighted levels break and lock to confirm direction for the next range.
We will keep the above in mind when taking buys from dips. Our updated levels and weighted levels will allow us to track the movement down and then catch bounces up.
We will continue to buy dips using our support levels taking 20 to 40 pips. As stated before each of our level structures give 20 to 40 pip bounces, which is enough for a nice entry and exit. If you back test the levels we shared every week for the past 24 months, you can see how effectively they were used to trade with or against short/mid term swings and trends.
The swing range give bigger bounces then our weighted levels that's the difference between weighted levels and swing ranges.
BULLISH TARGET
5085
EMA5 CROSS AND LOCK ABOVE 5085 WILL OPEN THE FOLLOWING BULLISH TARGETS
5208
EMA5 CROSS AND LOCK ABOVE 5208 WILL OPEN THE FOLLOWING BULLISH TARGETS
5334
EMA5 CROSS AND LOCK ABOVE 5334 WILL OPEN THE FOLLOWING BULLISH TARGETS
5446
EMA5 CROSS AND LOCK ABOVE 5446 WILL OPEN THE FOLLOWING BULLISH TARGETS
5550
BEARISH TARGETS
4954
EMA5 CROSS AND LOCK BELOW 4954 WILL OPEN THE SWING RANGE
4842
4715
EMA5 CROSS AND LOCK BELOW 4715 WILL OPEN THE SECONDARY SWING RANGE
4600
4493
As always, we will keep you all updated with regular updates throughout the week and how we manage the active ideas and setups. Thank you all for your likes, comments and follows, we really appreciate it!
Mr Gold
GoldViewFX

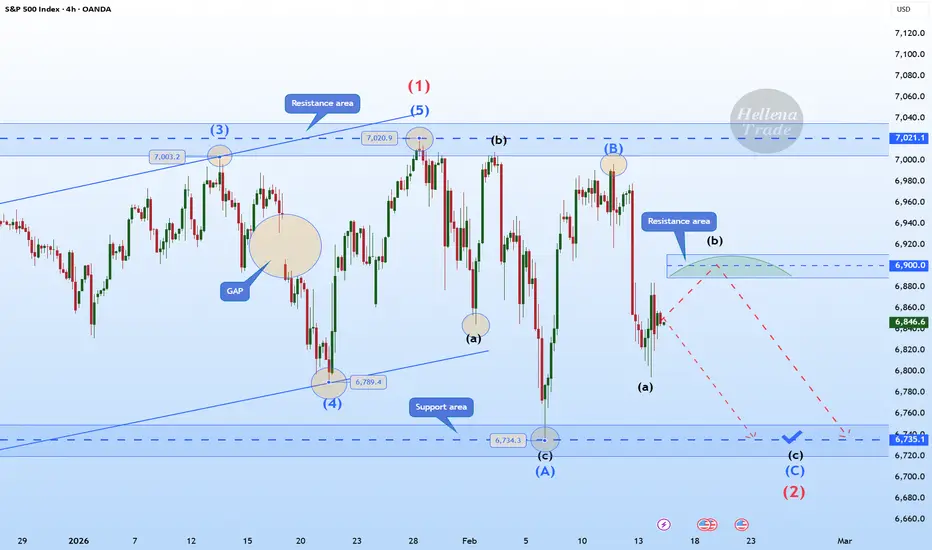
Hellena | SPX500 (4H): SHORT to support area of 6735.Colleagues, it seems that we are facing a combined correction, which means that wave “2” is not yet complete and we should expect a price decline to the support area of 6735, where I think we should take profits.
As part of a small “abc” correction, it is possible to reach the 6900 area before the decline begins, but I still give priority to the downward movement.
Manage your capital correctly and competently! Only enter trades based on reliable patterns!