#OP/USDT Ready to launch upwards#OP
The price is moving within a descending channel on the hourly timeframe. It has reached the lower boundary and is heading towards a breakout, with a retest of the upper boundary expected.
The Relative Strength Index (RSI) is showing a downward trend, approaching the lower boundary, and an upward bounce is anticipated.
There is a key support zone in green at 0.1700, and the price has bounced from this level several times and is expected to bounce again.
The indicator is showing a trend towards consolidation above the 100-period moving average, which we are approaching, supporting the upward move.
Entry Price: 0.1822
First Target: 0.1893
Second Target: 0.1975
Third Target: 0.2055
Stop Loss: Below the green support zone.
Remember this simple thing: Money management.
For any questions, please leave a comment.
Thank you.
Opbtclong

#OP/USDT Ready to launch upwards#OP
The price is moving within a descending channel on the hourly timeframe. It has reached the lower boundary and is heading towards a breakout, with a retest of the upper boundary expected.
The Relative Strength Index (RSI) is showing a downward trend, approaching the lower boundary, and an upward bounce is anticipated.
There is a key support zone in green at 0.2232, and the price has bounced from this level several times. Another bounce is expected.
The RSI is showing a trend towards consolidation above the 100-period moving average, which we are approaching, supporting the upward move.
Entry Price: 0.2270
Target 1: 0.2309
Target 2: 0.2374
Target 3: 0.2449
Stop Loss: Below the green support zone.
Remember this simple thing: Money management.
For any questions, please leave a comment.
Thank you.

#OP/USDT Ready to launch upwards#OP
The price is moving in a descending channel on the 1-hour timeframe. It has reached the lower boundary and is heading towards breaking above it, with a retest of the upper boundary expected.
We have a downtrend on the RSI indicator, which has reached near the lower boundary, and an upward rebound is expected.
There is a key support zone in green at 0.3230. The price has bounced from this level multiple times and is expected to bounce again.
We have a trend towards consolidation above the 100-period moving average, as we are moving close to it, which supports the upward movement.
Entry price: 0.3300
First target: 0.3352
Second target: 0.3456
Third target: 0.3576
Don't forget a simple principle: money management.
Place your stop-loss order below the support zone in green.
For any questions, please leave a comment.
Thank you.

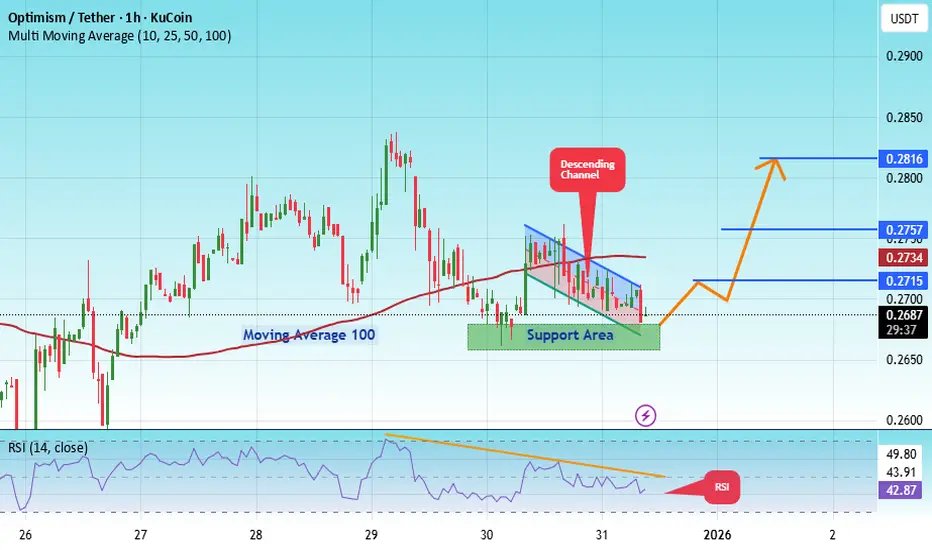
#OP/USDT – Triangle Pattern Breakout Loading?#OP
The price is moving in a descending channel on the 1-hour timeframe. It has reached the lower boundary and is heading towards breaking above it, with a retest of the upper boundary expected.
We have a downtrend on the RSI indicator, which has reached near the lower boundary, and an upward rebound is expected.
There is a key support zone in green at 0.2660. The price has bounced from this zone multiple times and is expected to bounce again.
We have a trend towards consolidation above the 100-period moving average, as we are moving close to it, which supports the upward movement.
Entry price: 0.2693
First target: 0.2715
Second target: 0.2757
Third target: 0.2816
Stop loss: Below the support zone in green.
Don't forget a simple thing: capital management.
For inquiries, please leave a comment.
Thank you.
#OP/USDT – Triangle Pattern Breakout Loading?#OP
The price is moving in a descending channel on the 1-hour timeframe. It has reached the lower boundary and is heading towards breaking above it, with a retest of the upper boundary expected.
We have a downtrend on the RSI indicator, which has reached near the lower boundary, and an upward rebound is expected.
There is a key support zone in green at 0.2559. The price has bounced from this zone multiple times and is expected to bounce again.
We have a trend towards consolidation above the 100-period moving average, as we are moving close to it, which supports the upward movement.
Entry price: 0.2624
First target: 0.2668
Second target: 0.2772
Third target: 0.2888
Don't forget a simple principle: money management.
Place your stop-loss order below the support zone in green.
For any questions, please leave a comment.
Thank you.

#OP/USDT#OP
The price is moving within a descending channel on the 1-hour frame and is expected to break and continue upward.
We have a trend to stabilize above the 100 moving average once again.
We have a downtrend on the RSI indicator that supports the upward move with a breakout.
We have a support area at the lower limit of the channel at 0.600, acting as strong support from which the price can rebound.
Entry price: 0.616
First target: 0.630
Second target: 0.641
Third target: 0.658

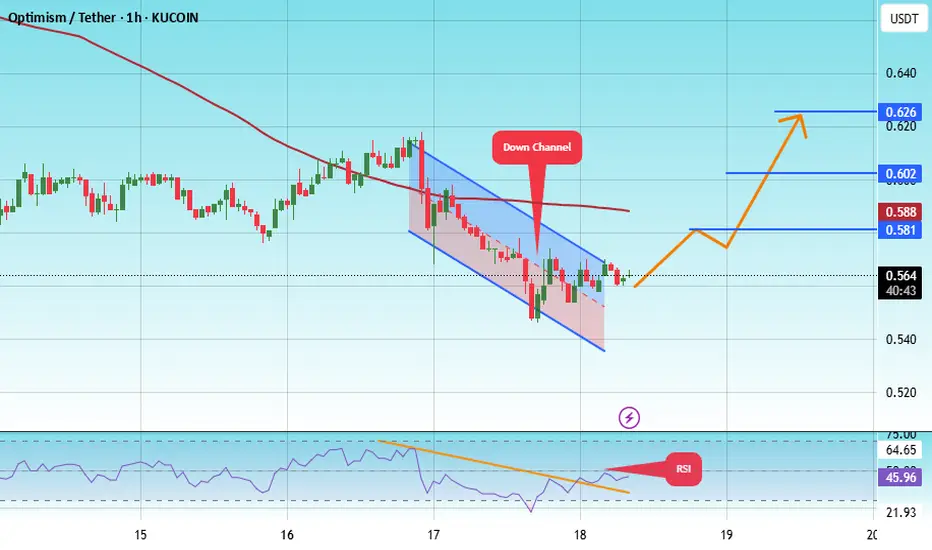
#OP/USDT#OP
The price is moving within a descending channel on the 1-hour frame, adhering well to it, and is heading toward a strong breakout and retest.
We are experiencing a rebound from the lower boundary of the descending channel. This support is at 0.544.
We have a downtrend on the RSI indicator that is about to be broken and retested, supporting the upward trend.
We are heading toward stability above the 100 moving average.
Entry price: 0.564
First target: 0.581
Second target: 0.602
Third target: 0.626
OPUSDT Forming Descending ChannelOPUSDT is showing an impressive technical setup that has caught the attention of many crypto traders recently. The chart reflects a well-formed descending channel, which is a classic bullish reversal pattern when broken to the upside. Currently, the price action is testing the upper boundary of this channel with increasing buying pressure, signaling that a potential breakout could be on the horizon. A successful breakout here, supported by good volume, could trigger a strong rally in the coming sessions.
The volume profile for OPUSDT is encouraging, as it suggests that more investors are accumulating positions in anticipation of this move. This aligns with the optimistic sentiment in the broader crypto market, where traders are actively seeking altcoins with high potential upside. With an expected gain of around 80% to 90%+, OPUSDT offers an attractive risk-to-reward ratio, especially for those who prefer swing trades and short-term position trades in trending altcoins.
One key factor to watch is whether OPUSDT can sustain momentum above the descending channel’s resistance line. If volume remains strong and the breakout confirms on higher timeframes like the daily or weekly chart, this could attract further interest from both retail and institutional traders. Such a move often sparks a chain reaction of buying, as traders look to ride the trend to its projected target zone.
Overall, the combination of a textbook pattern, healthy volume, and increasing investor interest makes OPUSDT one to watch closely. Keep it on your radar for a possible breakout play with significant upside potential. As always, manage your risk properly and wait for a confirmed breakout before entering any position.
✅ Show your support by hitting the like button and
✅ Leaving a comment below! (What is You opinion about this Coin)
Your feedback and engagement keep me inspired to share more insightful market analysis with you!

#OP/USDT#OP
The price is moving within a descending channel on the 1-hour frame and is expected to continue upward.
We have a trend to stabilize above the 100 moving average once again.
We have a downtrend on the RSI indicator, which supports the upward move by breaking it upward.
We have a support area at the lower limit of the channel at 0.817.
Entry price: 0.860
First target: 0.891
Second target: 0.916
Third target: 0.950

#OP/USDT#OP
The price is moving in a descending channel on the 1-hour frame and is adhering to it well and is heading to break it strongly upwards and retest it
We have a bounce from the lower limit of the descending channel, this support is at a price of 0.834
We have a downtrend on the RSI indicator that is about to be broken and retested, which supports the rise
We have a trend to stabilize above the moving average 100
Entry price 0.909
First target 0.939
Second target 0.992
Third target 1.054

#OP/USDT#OP
The price is moving in a descending channel on the 1-hour frame and sticking to it well
We have a bounce from the lower limit of the descending channel and we are now touching this support at a price of 1.53
We have a downtrend on the RSI indicator that is about to be broken, which supports the rise
We have a trend to stabilize above the moving average 100
Entry price 1.57
First target 1.63
Second target 1.70
Third target 1.77

#OP/USDT#OP
The price has broken the descending channel on the 4-hour frame upwards and is expected to continue
We have a trend to stabilize above the moving average 100 again
We have an upward trend on the RSI indicator that supports the rise by breaking it upwards
We have a support area at the lower limit of the channel at a price of 1.45
Entry price 1.60
First target 1.70
Second target 1.84
Third target 1.90

OP/BTC - Optimism: Failure Swing◳◱ On the $OP/ CRYPTOCAP:BTC chart, the Failure Swing pattern suggests indications that the trend may be gaining or losing strength. Traders might observe resistance around 0.00004557 | 0.00005564 | 0.00007365 and support near 0.00002756 | 0.00001962 | 0.00000161. Entering trades at 0.00003833 could be strategic, aiming for the next resistance level.
◰◲ General info :
▣ Name: Optimism
▣ Rank: 48
▣ Exchanges: Binance, Hitbtc
▣ Category/Sector: Infrastructure - Scaling
▣ Overview: None
◰◲ Technical Metrics :
▣ Mrkt Price: 0.00003833 ₿
▣ 24HVol: 23.988 ₿
▣ 24H Chng: 7.578%
▣ 7-Days Chng: 6.60%
▣ 1-Month Chng: -27.34%
▣ 3-Months Chng: -16.44%
◲◰ Pivot Points - Levels :
◥ Resistance: 0.00004557 | 0.00005564 | 0.00007365
◢ Support: 0.00002756 | 0.00001962 | 0.00000161
◱◳ Indicators recommendation :
▣ Oscillators: SELL
▣ Moving Averages: BUY
◰◲ Technical Indicators Summary : NEUTRAL
◲◰ Sharpe Ratios :
▣ Last 30D: -2.95
▣ Last 90D: -0.57
▣ Last 1-Y: 0.45
▣ Last 3-Y: 0.65
◲◰ Volatility :
▣ Last 30D: 1.19
▣ Last 90D: 1.00
▣ Last 1-Y: 1.01
▣ Last 3-Y: 1.36
◳◰ Market Sentiment Index :
▣ News sentiment score is N/A
▣ Twitter sentiment score is N/A
▣ Reddit sentiment score is 0.67 - Bullish
▣ In-depth OPBTC technical analysis on Tradingview TA page
▣ What do you think of this analysis? Share your insights and let's discuss in the comments below. Your like, follow and support would be greatly appreciated!
◲ Disclaimer
Please note that the information and publications provided are for informational purposes only and should not be construed as financial, investment, trading, or any other type of advice or recommendation. We encourage you to conduct your own research and consult with a qualified professional before making any financial decisions. The use of the information provided is solely at your own risk.
▣ Welcome to the home of charting big: TradingView
Benefit from a ton of financial analysis features, instruments and data. Have a look around, and if you do choose to go with an upgraded plan, you'll get up to $30.
Discover it here - affiliate link -
