OPEN: Time to Accumulate? Layer Entry Method Explained🎯 OPEN: The Heist is ON! 🏠💰 Strategic Swing Trade Setup
📊 Asset Overview
Ticker: OPEN (Opendoor Technologies Inc.)
Exchange: NASDAQ
Trade Type: Swing Trade
Bias: 🐂 BULLISH
🎭 The Master Plan: "Operation Real Estate Robbery"
Listen up, fellow wealth redistributors! 👋 Opendoor's chart is screaming opportunity louder than a house alarm at 3 AM. We're setting up a classic layered accumulation strategy (aka "The Thief's Multi-Pocket Approach") to maximize our position while managing risk like professionals.
🚪 Entry Strategy: The Layered Infiltration Method
Primary Approach: Multiple Limit Orders (Ladder Strategy)
Instead of going all-in at one price (rookie move 😅), we're spreading our capital across strategic levels:
Recommended Entry Layers:
🎯 Layer 1: $6.50
🎯 Layer 2: $7.00
🎯 Layer 3: $7.50
🎯 Layer 4: $8.00
Flexibility Note: You can adjust the number of layers and position sizing based on your capital and risk appetite. Some traders prefer tighter layers ($0.25 increments), others go wider. Make it yours! 💪
Alternative: If you prefer simplicity, current market price entry works too, but layering gives you better average cost basis on dips.
🛡️ Risk Management: The Escape Hatch
Stop Loss: $6.00
⚠️ Important Disclaimer: This SL level is based on technical structure, but YOU are the captain of your own ship. Adjust based on:
Your risk tolerance
Account size
Market volatility
Personal trading rules
Risk Management Tip: Never risk more than 1-2% of your total capital on a single trade. Set your position size accordingly!
🎯 Target: The Grand Exit
Primary Target: $10.00
At this level, we're expecting:
🚨 Strong resistance zone
📈 Potential overbought conditions
Possible bull trap area
💰 Excellent risk-reward ratio
Scaling Out Strategy (Advanced Move):
Consider taking 30-50% profits at $9.00-$9.50
Trail stop-loss on remaining position
Lock in gains progressively
Remember: Nobody went broke taking profits! 💵 If the market gives you money, take it. Don't get greedy waiting for the "perfect" exit.
🔗 Related Assets to Watch
Keep these correlated symbols on your radar for confluence:
📍 $Z (Zillow Group) - Direct competitor in real estate tech, strong correlation with OPEN's price action
📍 BLACKBULL:RDFN (Redfin Corporation) - Another proptech player, moves in sympathy with sector sentiment
📍 NASDAQ:EXPI (eXp World Holdings) - Real estate brokerage, broader sector health indicator
📍 AMEX:IYR (iShares U.S. Real Estate ETF) - Overall real estate sector strength/weakness gauge
📍 AMEX:XHB (SPDR S&P Homebuilders ETF) - Housing market sentiment indicator
Correlation Logic: When real estate tech and housing sectors show strength, OPEN typically benefits. Conversely, sector weakness can drag OPEN down regardless of individual fundamentals. Watch for divergences—they often signal important reversals! 🔄
📈 Technical Synopsis
This setup combines:
✅ Strategic layered entries for optimal positioning
✅ Defined risk with clear stop-loss
✅ Realistic profit target with strong R:R ratio
✅ Sector correlation awareness
✅ Flexible execution for different trading styles
The swing trade timeframe gives this setup room to breathe and develop, perfect for traders who don't want to be glued to charts all day! ⏰
⚡ The Bottom Line
This isn't financial advice—it's a strategic roadmap presented with personality! The "thief style" approach is all about:
🎯 Strategic positioning
🛡️ Risk management
💰 Profit-taking discipline
😎 Having fun while trading
Trade smart. Trade safe. Trade YOUR plan.
✨ If you find value in my analysis, a 👍 and 🚀 boost is much appreciated — it helps me share more setups with the community!
#OPEN #OpendoorTechnologies #SwingTrade #NASDAQ #StockMarket #TechnicalAnalysis #TradingStrategy #RealEstateTech #PropTech #BullishSetup #LayeredEntry #RiskManagement #TradingView #StockTrading #MarketAnalysis #TradingIdeas #SwingTrading #DayTrading
Opendoor

Opendoor ($OPEN) Expands Shareholder Value With Special WarrantsOpendoor Technologies Inc. (NASDAQ: NASDAQ:OPEN ) has taken a bold step to enhance shareholder value by issuing a special dividend of tradable warrants to stockholders as of November 18, 2025. The company distributed one Series K, one Series A, and one Series Z warrant for every 30 shares held, offering investors discounted future purchase opportunities. With the stock trading at $9.20 during the announcement, the move came at a time of increasing market optimism around the company’s recovery and operational momentum.
The warrants provide attractive entry points for long-term investors. Series K is exercisable at $9.00, Series A at $13.00, and Series Z at $17.00. All three expire on November 20, 2026, though early expiration triggers apply if Opendoor’s stock trades above 120% of the exercise price for 20 consecutive trading days. This means Series K could expire early if the stock reaches $10.80—highlighting the potential for accelerated shareholder action should the stock rally.
From a fundamental perspective, the move signals management’s confidence in Opendoor’s growth trajectory, improved liquidity position, and long-term business model stability. The warrant issuance also provides Opendoor with flexibility in raising capital if exercised, further strengthening its balance sheet in a challenging housing market.
Technical Outlook
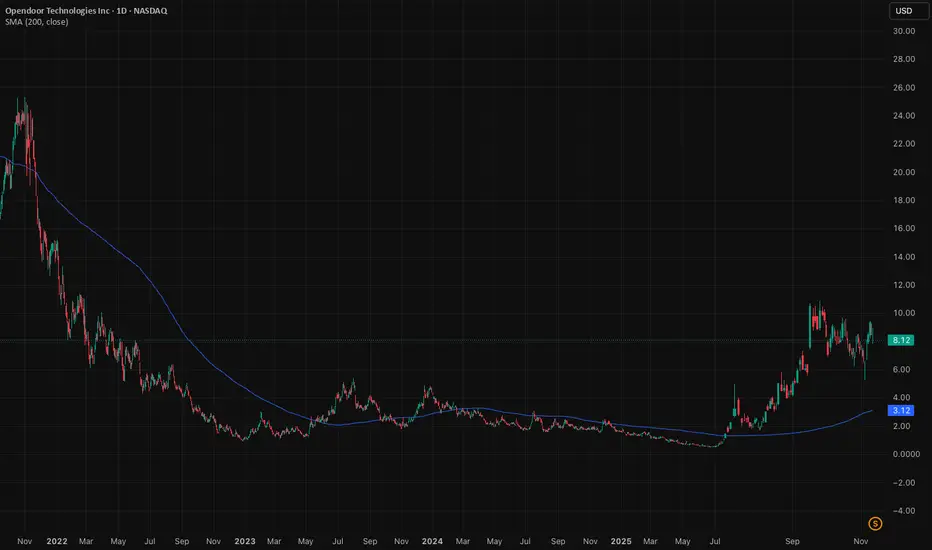
Technically, OPEN remains bullish in the higher time frame despite a recent bearish retracement from the $10 high. The stock is currently trading near $6 and approaching a critical support zone around $5—a level that has historically held since 2022 within a long-term ranging channel.
If the $5 support holds, bullish continuation targets lie at $12, $15, and ultimately $20. A breakout and retest of the upper range structure would confirm a strong upside trend continuation.

Opendoor evolving into version 2.0Opendoor is trying to do something bold in a market that has not changed in a century. It wants to become the market maker for homes. A fast, liquid, always on platform powered by AI.
The new CEO is driving this shift with focus and speed. He comes from a background where product execution mattered more than slogans. He built teams that shipped. He cut waste. He pushed operations to run on data, not instinct. That discipline is now being forced into a business that grew lazy on cheap capital and slow cycles.
The vision is simple. Price homes with precision. Buy fast. Sell fast. Hold nothing longer than needed. Take a small spread. Repeat thousands of times. Market makers in finance thrive on speed and volume.
Housing has never had that model because the data was messy and decisions took time. AI changes that. It can scrape, compare and price in seconds. It can see patterns humans miss. It can adjust to shifts in demand before the market notices.
The opportunity is large. Housing is the biggest asset class on earth. Even a small share of transactions at scale can produce strong returns. If Opendoor can remove friction, it can create a new standard for liquidity.
That would pull in sellers who want certainty and buyers who want speed. It also builds a flywheel. More data creates better pricing. Better pricing attracts more users. More users increase volume. Volume strengthens spreads.
The technical picture helps the story. Heavy short interest sits against a company that now has a clear plan and a leader with resolve. A small piece of good news can force shorts to cover. Strong volume can turn into momentum. The market is watching for proof. If early signs show progress, the stock can squeeze.
The forecasts provided herein are intended for informational purposes only and should not be construed as guarantees of future performance. This is an example only to enhance a consumer's understanding of the strategy being described above and is not to be taken as Blueberry Markets providing personal advice.
OPEN: I still cannot count the correction from the September highs as complete, and as long as the price continues closing below the October highs, I’m expecting one more leg down to retest the November lows.
Chart:
Previously
On potential correction (Oct 8):

OPEN | This Will Rip MUCH Higher | LONGOpendoor Technologies, Inc. engages in the operation of buying, selling, and trading of residential properties online. The company was founded by Eric Wu on December 30, 2013, and is headquartered in Tempe, AZ.

Opendoor Technologies Big Correction coming ? Part 2 In this video I cover what was originally anticipated in the first Opendoor video that i published in October and what we can expect moving forward .
I still have the same targets as specified in the first video with alerts set .

Opendoor Tech Inc.($OPEN) Drops as Q3 Revenue Beat EstimatesOpendoor Technologies Inc. (NASDAQ: NASDAQ:OPEN ) delivered a mixed set of Q3 2025 results as the company transitions from a pure iBuying model toward an AI-driven operating structure under new CEO Kaz Nejatian.
Revenue came in at $915 million, down 33.6% year-over-year but ahead of estimates at $851.7 million. The topline resilience was offset by weaker profitability as adjusted losses widened to $0.08 per share, missing consensus by one cent. The decline reflected lower resale volumes (2,568 homes sold vs. 3,615 last year) and a soft U.S. housing market, pressured by elevated mortgage rates and inventory reductions.
Despite short-term headwinds, Opendoor’s management reiterated its goal of achieving sustained profitability by late 2026, with an expanded focus on AI-led pricing tools, digital onboarding, and operational automation. The company expects its new tech-centric model to enhance efficiency, reduce carrying costs, and restore gross margins over the next 12–18 months.
Shares of Opendoor fell nearly 15% post-earnings, reflecting investor caution amid the company’s ongoing structural transformation.
Technically, NASDAQ:OPEN trades near $6.56, correcting sharply from recent highs around $10. The weekly chart shows strong historical support around $5, the same zone that preceded its last breakout. Holding this area could set up a mid-term reversal pattern, potentially paving the way for a rebound toward the $11–$12 range if volume strengthens and broader housing sentiment stabilizes.
Volume analysis shows accumulation spikes near the $6 level, hinting at early dip-buying interest from value-focused investors. A close below $5, however, could invalidate the bullish setup and reopen risk toward $3.

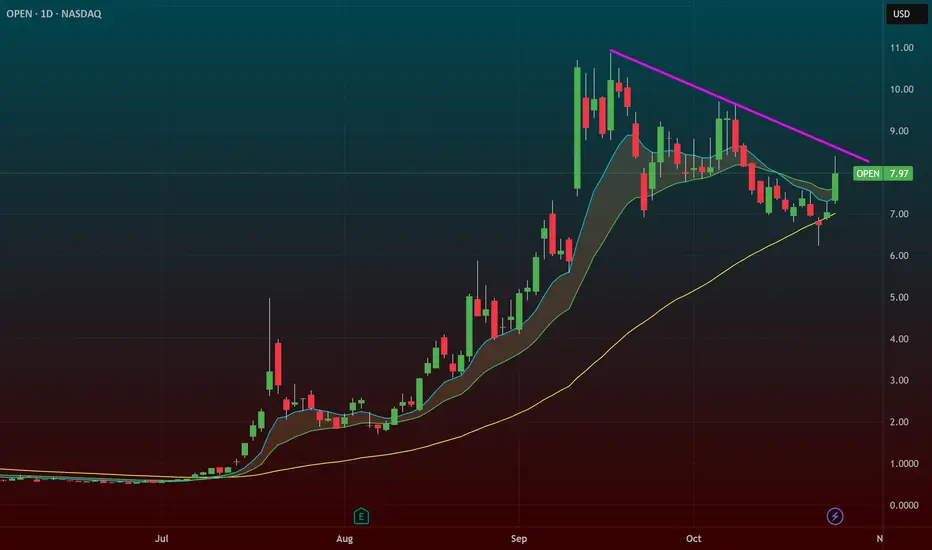
$OPEN – 50 SMA Retest with Trendline Breakout TriggerOpendoor Technologies ( NASDAQ:OPEN ) is setting up for a trendline breakout right as it tests the 50 SMA — a perfect technical spot for dip buyers to step in after a massive run.
🔹 The Setup:
After a strong multi-month rally, NASDAQ:OPEN finally pulled back into the 50 SMA, the first real test of trend support in this cycle.
Price is coiling just under a descending trendline, with an $8.50 trigger marking the breakout zone.
The consolidation is clean, volume is light, and momentum could reload quickly if the market stays hot.
🔹 Market Context:
The broader market is at all-time highs, and NASDAQ:OPEN has been one of the biggest winners in that run.
This pullback looks natural and healthy, not distributional.
Often, the first touch of the 50 SMA after a big run is where institutional buyers step back in.
🔹 My Trade Plan:
1️⃣ Entry: Watching for a breakout through $8.50 with volume confirmation.
2️⃣ Add: On strength above that level or retest of the breakout zone.
3️⃣ Stop: Below the 50 SMA — tight, well-defined risk.
Why I Like This Setup:
Trendline break + 50 SMA retest = classic continuation setup.
Big winner resting while the market is strong = ideal timing for a reload.
Risk is clean, structure is tight, and breakout potential is strong.
OPEN 1D - Flag Ready for Takeoff?On the daily chart, Opendoor Technologies (OPEN) is forming a clean bullish flag - a consolidation phase following a massive +400% rally since spring 2025. Price action remains tightly contained within the pattern, with strong support from the MA50 and the 6.3–7.4 buy zone, aligning with the 0.618 Fibonacci retracement.
Technically , the setup looks mature: MA50 is trending upward, MA200 sits far below, and volume contraction hints at a breakout ahead. The first target sits at $16.50 (1.618 extension), while the second target lies at $25.60 (2.618 extension) - a potential +200% move from current levels.
Fundamentally, Opendoor is finally emerging from its downturn:
– +37% YoY growth in property transactions;
– operating costs reduced by ~25%;
– positive operating cash flow for the first time in three years;
– partnerships with Zillow and Redfin driving stronger customer acquisition.
With the U.S. housing market showing signs of recovery and potential Fed rate cuts on the horizon, OPEN stands out as a high-upside play in the proptech sector.
Tactical plan: watch for accumulation near 6.3–7.4, add on breakout confirmation. Profit targets: 16.5 → 25.6.
After all, in both trading and real estate - it’s all about timing and location.

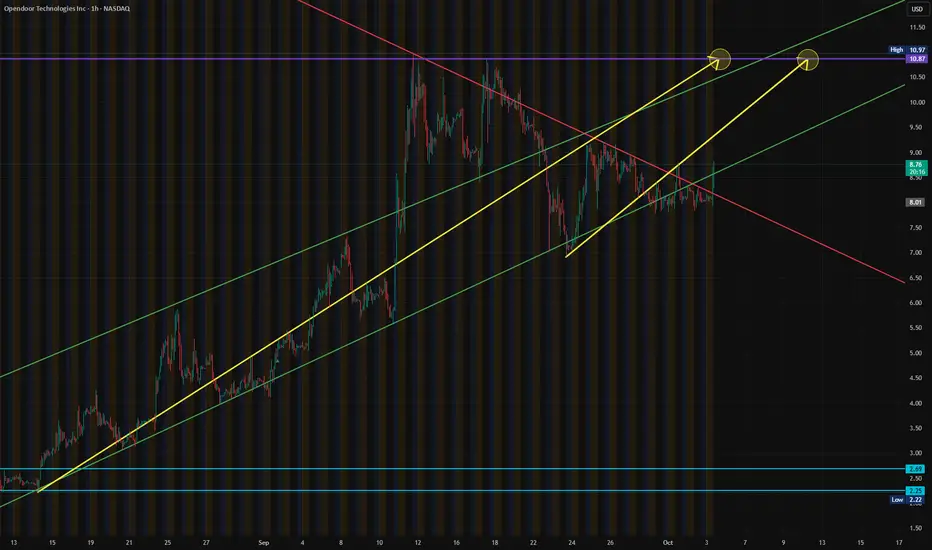
$OPEN - OpenDoor Tech - $9.69 Retest - $10.87 PT🧠 Technical Overview
Ticker: NASDAQ:OPEN (Opendoor Technologies Inc.)
Timeframes: 15-min & 4-hour combo
Current Price: ~$9.30
Trend Summary:
Strong bounce from $8.10 base with two clean BOS (break of structure) signals.
Retested and held $9.19 intraday; momentum candle formed near close.
Channel projection (yellow) shows potential path toward $10.87 → $10.97 short-term.
Volume uptick confirms accumulation — buyers stepping back in.
Key supports: $8.43 / $8.10
Analysis Overview:
NASDAQ:OPEN (Opendoor) is back in motion!
After reclaiming $9.00 support and breaking its short-term structure, the chart shows a clean path toward $10.87–$11.00.
Volume confirms renewed buyer strength after weeks of consolidation near $8.
Watch $9.69 for breakout confirmation — trend remains bullish above $8.43.
#Opendoor #OPEN #NASDAQ #MomentumTrading #RealEstateTech #AIStocks #MyMIWallet

$OPEN - Opendoor Tech - $9.20 RT / $9.80 PT NASDAQ:OPEN broke it's consolidation trend since reaching $10.97 in early Sept. We initially had a $7.95 PT which it exploded past and has since consolidated to retest the $9.20 Level of Resistance, pushing on to retest our $9.80 PT.
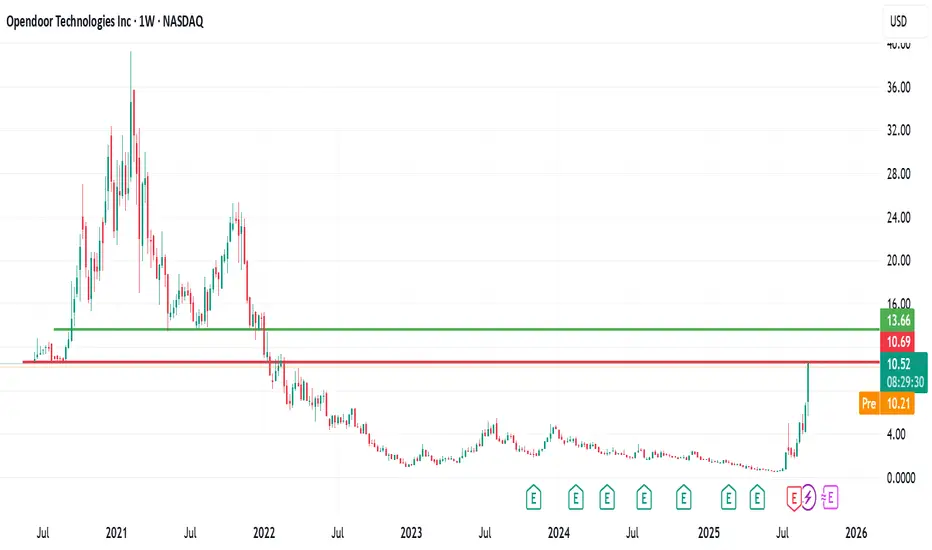
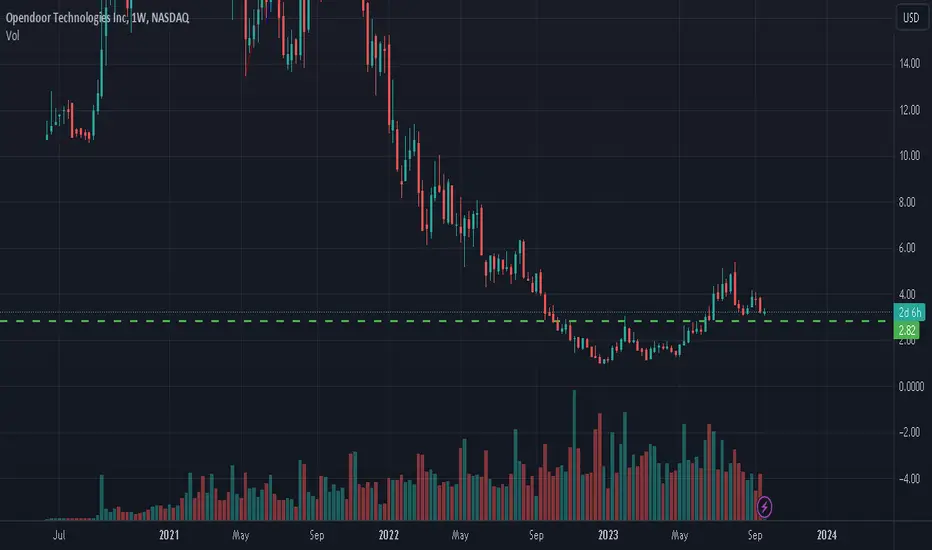
Opendoor is back to its historical (IPO) levelOpendoor is back to its historical (IPO) level
Opendoor Technologies (NASDAQ: OPEN) has made a remarkable journey back to its historical IPO price level.
The company went public in mid-June 2020, with its stock price surging to a peak of around $39 per share by early May 2021—representing a gain of more than 260%. However, the momentum reversed sharply, and despite several recovery attempts, the stock continued to decline, eventually hitting an all-time low (ATL) near $0.50, a loss of over 95% from its peak.
Since reaching that bottom, Opendoor has staged a powerful rebound, pushing back toward its IPO level from 2020.
Key questions for investors now are:
What fundamental catalysts could drive a decisive breakout above this level?
How much further upside potential exists from here?
Should investors also prepare for the possibility of another pullback?
Final thought: A confirmed breakout above the IPO level could open the door to further gains, with the next potential target around $13 per share.
📌 This analysis is for educational purposes only and not financial advice. Please trade and invest responsibly.
If you found this helpful, like, follow me, subscribe, share and comment.
OPEN - Opendoor Tech - PT $7.95OPEN is holding strong the Short Squeeze, showing Price Target Potential for $7.95 going into October (based on current bullish trend and angle/degree of increase.
With every New Friday, the squeeze becomes tougher and tougher to hold while also considering the expirations of options - Shorts exiting.
Interested to see where this lands

3000 Percent Gain on This Stock!OCTO had a massive mump today on the back of BMNR & Tom Lee getting involved.
This company went from zero to basically hero....caution buying this hype.
OPEN saw a negative bearish reversal from the highs. Likely giving a near term top.
Lulu went from red to green - daily bottoming tail.
Our markets continue to show casino tendencies.

$OPEN Bullish Explosion Loading?L —Don’t Miss Out🔥🚀 **OPEN Weekly Call Play: High Conviction Momentum Setup!** 🚀🔥
📊 **Trade Breakdown (2025-08-23)**
* 🎯 **Ticker**: \ NASDAQ:OPEN
* 🔀 **Direction**: CALL (LONG)
* 💵 **Strike**: \$5.50
* 🎯 **Entry Price**: \$0.72
* 🛑 **Stop Loss**: \$0.36 (50% of premium)
* 🎯 **Profit Target**: \$1.44 (+100%)
* 📅 **Expiry**: 2025-08-29
* 📈 **Confidence**: 85%
* ⏰ **Timing**: Enter at market open, exit by **Thursday** to avoid Friday gamma risk
💡 **Why this setup?**
✅ Multi-timeframe momentum (RSI daily 78.6 / weekly 85.9 — both rising 🚀)
✅ Institutional accumulation (volume +1.5x 📊)
✅ Strong call flow dominance (3.5:1 Call/Put ⚡)
✅ Low premium, high reward/risk setup 🎯
⚠️ **Risks**: Macro events + binary catalysts could cause volatility → strict stop & early exit rule!

OPEN WEEKLY TRADE SETUP — 07/23/2025
🏠 OPEN WEEKLY TRADE SETUP — 07/23/2025
📈 Volume Surge + Call Flow = Bullish Bias Confirmed
⸻
🔍 MARKET SNAPSHOT
All major models signal STRONG WEEKLY BULLISH bias, supported by:
• 📊 Weekly RSI = 85.9 (RISING) → 🚀 Momentum confirmed
• 📉 Daily RSI = 83.3 (FALLING) → ⚠️ Overbought zone, short-term pullback possible
• 📈 Volume Ratio = 6.7× Last Week → Big accumulation
• 🔁 Call/Put Ratio = 1.35 → Flow favors upside
• 🌪️ VIX = 16.1 → Normal regime = Clean premium action
⸻
🎯 TRADE IDEA — CALL OPTION PLAY
{
"instrument": "OPEN",
"direction": "CALL",
"strike": 2.50,
"entry_price": 0.26,
"profit_target": 0.39,
"stop_loss": 0.13,
"expiry": "2025-07-25",
"confidence": 80%,
"entry_timing": "Open",
"size": 1 contract
}
⸻
📊 TRADE PLAN
🔹 🔸
🎯 Strike 2.50 CALL
💵 Entry Price 0.26
🎯 Target 0.39 (+50%)
🛑 Stop Loss 0.13 (risk control)
📅 Expiry July 25 (2DTE)
📈 Confidence 80%
⚠️ Risk High gamma + overbought daily RSI
💡 Size Tip Keep risk to 2–4% of account capital
⸻
🧠 MODEL CONSENSUS
• ✅ All models agree: Weekly trend = UP
• ✅ Heavy call flow centered around $2.50
• ⚠️ Caution on timing: falling daily RSI = maybe wait for early dip?
⸻
💬 Drop a 🟩 if you’re riding OPEN
📈 Drop a 🕒 if you’re waiting for the dip
🚀 Looks like momentum wants to go higher — but gamma’s real, manage tight!
#OPEN #Opendoor #OptionsTrading #CallOptions #WeeklySetup #BullishTrade #GammaRisk #VolumePlay #TradingIdeas #AIPoweredAnalysis

Opendoor Technologies | OPEN | Long at $0.60Opendoor Technologies $NASDAQ:OPEN. This is purely a swing trade for a company that has been posting declining earnings and revenue since 2022 and does not anticipate becoming profitable in the next 3 years. Since the stock is now under $1, it's at-risk of being delisted from the Nasdaq. I am entering this play because there is a chance the recent price hit near $0.50 may be a temporary bottom and there is enough short interest (near 18%) for a spike near its book value of $1.00. Quick ratio is 0.75 (i.e. company may have difficulty meeting its short-term obligations without selling inventory or acquiring additional financing). While the company may be forced to do a split (a major risk for this purchase), I can see other eyes viewing this as a potential "quick play" for a reversal near its book value.
At $0.60, NASDAQ:OPEN is in a personal buy zone for a swing trade.
Targets:
$0.87 (+45%)
$1.00 (+66.7%)

OPEN - Falling Wedge on the Daily ChartThe price has been fluctuating within a broad range but shows a general downward trajectory as indicated by FALLING WEDGE. There's a noticeable struggle to break above the supply zone, suggesting that any rally towards this zone might be met with selling pressure.

Open door Technology Inc: unravel the hidden gemOpendoor is one of the most prominent companies, leveraging technology to streamline the home buying and selling process.
Opendoor has several growth opportunities that it could pursue to drive future revenue and earnings growth. One such opportunity is to expand its geographic footprint by entering new markets. The company operates in over 40 markets across the United States and plans to expand into additional markets in the coming years. This could help the company increase its revenue base and market share in new regions.

OPENDOOR ($3.15) loong idea long near 3.15 and add at 2.85
sl needs to be weekly close below 2.55
small qty only ive taken
Opendoor Technologies entry pursuit As requested by a follower:
Opendoor Technlogies NASDAQ:OPEN
- Currently this is a high risk trade as we are reaching
oversold on the weekly and price is close to
overhead resistance
Positives and entry levels:
- Above 200 day moving average & sloping upwards
- A pull back to 200 day would be an ideal entry
- Break above the OBV resistance line could indicate
further push through
I would not be entering this trade unless we revisited the 200 day or broke through the OBV resistance.
Opendoor is a small $2.68bln market cap company aiming to make selling your home as easy as clicking a few buttons. There are a lot of unknowns in the housing sector however a new CFO was appointed in Dec 2022 and she seems to have the company back on the front foot which is positive. #opendoor
Opendoors mission statement:
Opendoor is an e-commerce platform for residential real estate that allows people to buy, sell and move online. Our vision is to build a one-stop shop that allows people to move with the tap of a button.

opendoor ---> is going to touch $10hello guys...
as you can see the door breaks up the last resistance level and it will touch the $10!
if the price retraces to the break-up zone you can get a long position.
______________________________
always do your research.
If you have any questions, you can write them in the comments below, and I will answer them.
And please don't forget to support this idea with your likes and comment

Opendoor - powerful bullish ButterflyLooks like Opendoor's stock is shaping up to form a Butterfly pattern! If you're familiar with this symmetrical chart pattern, you'll know that it can signal a potential reversal in the stock's current trend.
So, for those of you who believe in the power of technical analysis, this could be seen as a bullish signal for Opendoor's future stock price. Of course, as with any trading strategy, it's important to use multiple forms of analysis and not rely solely on chart patterns. But hey, let's enjoy this moment of Butterfly bliss while it lasts!
