FireHoseReel | Optimism Near Key Breakout Level as Volume Builds🔥 Welcome To FireHoseReel !
Let’s dive into Optimism (OP) analysis.
⛳️ OP Fundamental Overview
Optimism (OP) helps people use Ethereum faster and cheaper by reducing fees and speeding up transactions for DeFi, NFTs, and apps. Ranked around top 80 on CoinMarketCap, it’s a strong mid-cap Layer-2.
👀 OP 4H Overview
Optimism (OP) is trading inside a 4H range box and is currently positioned near the end of its bearish trend. A breakout above the descending curve trendline, followed by a break of the overhead resistances, could initiate a bullish 4H trend for OP.
📊 Volume Analysis
As price approached the curve trendline and the dynamic resistance at $0.2825, volume increased noticeably. This suggests that a breakout of this zone could lead to a fast and impulsive price move.
✍️ OP Trading Scenarios
🟢 Long Scenario:
A confirmed breakout above $0.2825 with increasing buy volume could allow price to break the top of the range and move toward the $0.3439 resistance.
🔴 Short Scenario:
A breakdown below $0.2518 could trigger a fast move toward a lower support level. Strong selling volume confirmation would be required.
🧠 Protect your capital first. No setup is worth blowing your account. If risk isn’t controlled, profit means nothing. Trade with rules, not emotions.
Optimism

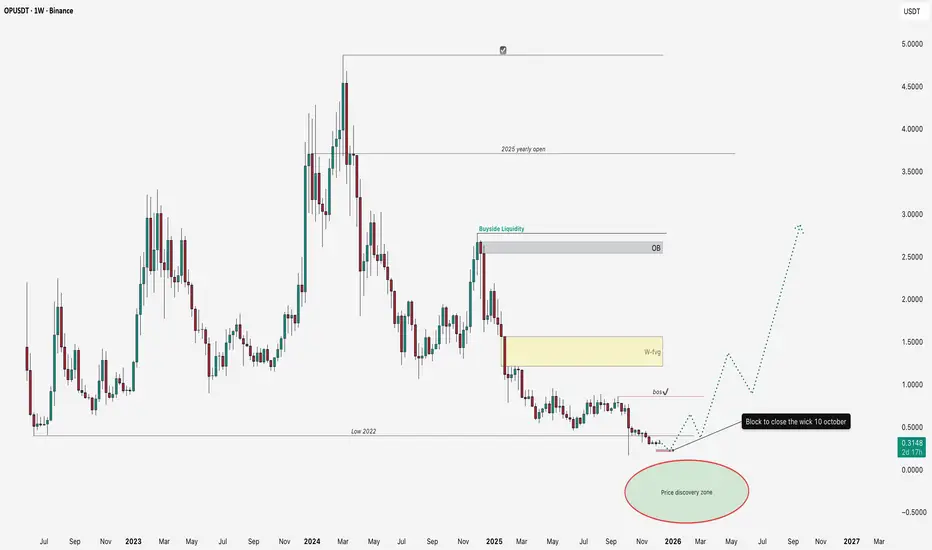
Optimism Next Wave: Mid-Term Targets UncoveredWe are not taking BINANCE:OPUSDT fundamental factors into account because, let’s be honest, they have absolutely no impact on the price movement on the chart!
We’ll focus exclusively on the price action setup. For over a year, we’ve been in a downtrend.
Nothing can fall forever, so considering the seasonality and the ongoing QE, I expect the price to find support in a small demand block (to cover the October 10 wick), followed by an impulsive upward move and a structure break on the weekly timeframe.
After that — a test of the weekly FVG and a continuation toward the Weekly Order Block and buyside liquidity zone.
Once the targets are reached, I will update this idea.
If the price moves below the October 10 wick, we enter a free fall into the price discovery zone.
Might be time to dip back into OPBTC just smashed through $100K, and ETH's hovering right around $3K.
Might be time to dip back into OP—looks like the liq map shows they flushed out every last long trader.
Entry: $0.3547
Take Profit: $0.6800
Stop Loss: $0.3098
Playing it with a 1:8 RR.
If this one gets stopped out, I'll eye the next entry around $0.26 +/- straight into the spot bag. All that prime liquidity's piled up overhead.

There's also an interesting entry point on OptimismThere's also an interesting entry point on NASDAQ:OP #Optimism.
The trade is almost 1 to 5.
Entry: $0.4059
Take Profit: $0.5015
Stop Loss: $0.3849
It looks a lot like a false breakdown downward and growth along with Bitcoin and Ethereum is quite possible.
Short traders' liquidity has already accumulated.
#Crypto #Trading #DayTrading
$OPUSD looks good for a long hereSince 2024, OP has been falling inside of a wedge, and it recently broke out and has now backtested it. We've also formed a capitulation low on Oct 6th, and now we look set to make a move higher.
I think we could see between a 2x-10x move from here potentially all the way up to the top of the range.
Let's see how it plays out over the comings weeks.

Optimism one the good opportunity Hi Everyone;
today we have one of the best risk to reward Investment opportunity
it is more than 80 times the risk and the chart is look very promising.
I expect breaking the previous bear market key point will clear the way to the final target.

OP/USDT – Order Block Accumulation + RSI OversoldOP is currently bound within a consolidation range, showing signs of a potential order block formation—a zone where larger players may be accumulating. These structures often precede impulsive, expansive moves once the range is broken. We're seeing tight price action between $0.400 and $0.410, which could act as a springboard.
🔍 The RSI is deep into oversold territory, signaling that the selling momentum may be fading. This aligns with the idea of a reversal or breakout from the current accumulation zone. Watch for volume spikes or candle structure shifts as potential early signals.
📊 Trade Idea:
Entry Zone: $0.400 – $0.410
Take Profit Targets: $0.462 → $0.499 → $0.570
Stop Loss: Below $0.39

OP/USDT – On the Edge of Reversal or Final Breakdown?Optimism (OP) is standing at a critical crossroads after a long and steady downtrend that has persisted since mid-2024.
Price is now testing the major support zone between 0.405–0.476 (yellow block) — a historical demand area that once marked the beginning of a major rally in the past.
The deep wick below this area indicates a liquidity sweep, suggesting that larger players may have flushed out retail stop-losses before positioning for the next major move.
This zone is not just a number — it represents the psychological line between capitulation and accumulation.
While the macro structure still shows lower highs and lower lows, the reaction in this support range will determine whether a mid-term reversal can begin or if the macro downtrend continues.
---
Pattern & Structure Analysis
Main trend: Bearish, with continuous lower highs and lower lows.
Yellow block (0.405–0.476): Key historical demand zone that previously triggered strong accumulation.
Long wick below: Possible false breakdown or stop hunt, indicating liquidity absorption.
Potential setup: Early formation of a double-bottom pattern if price holds above 0.405 and reclaims higher resistance.
---
Bullish Scenario
If price strongly bounces from 0.405–0.476 and successfully closes above 0.6399 (5D timeframe), it could confirm the start of a mid-term reversal.
Initial target: 0.8754
Next target: 1.1797
Bullish confirmation: 5D close above 0.6399 with rising volume.
Invalidation: 5D close below 0.405.
This zone offers potential accumulation for swing traders, but confirmation from volume and structure is essential before committing.
---
Bearish Scenario
If OP fails to hold 0.405 and closes below this support zone, the bearish momentum will likely accelerate.
First target: 0.23 (previous liquidity sweep low).
Bearish confirmation: 5D close below 0.405 with strong selling volume.
Invalidation: 5D reclaim above 0.6399.
A clean breakdown would confirm a continuation of the macro downtrend, signaling a deeper capitulation phase.
---
Market Narrative
The 0.405–0.476 zone is where buyers and sellers face their final test.
This is the battlefield between smart money accumulation and bearish momentum exhaustion.
A strong bullish reaction here could indicate that smart money is stepping in, while a failure to hold could lead to the final flush before a long consolidation phase.
This is the zone that will define whether OP finds its true bottom or enters another leg down.
---
Technical Summary
Support zone: 0.405–0.476
Nearest resistance: 0.6399
Bullish targets: 0.8754 → 1.1797
Bearish target: 0.23
Main trend: Bearish
Timeframe: 5D (mid-term outlook)
---
#OP #Optimism #OPUSDT #CryptoAnalysis #TechnicalAnalysis #PriceAction #SupportAndResistance #CryptoTrading #MarketStructure #SupplyDemand #CryptoOutlook #BullishScenario #BearishScenario #AltcoinAnalysis
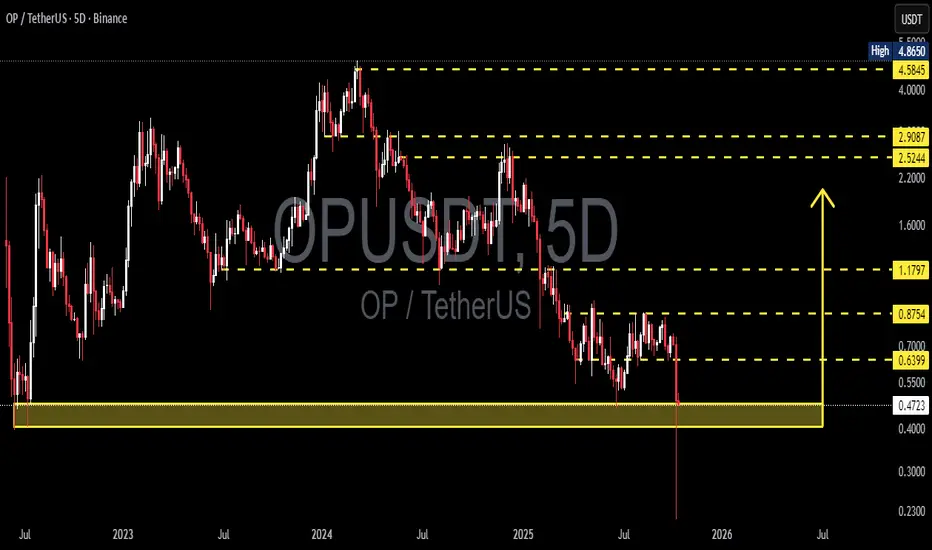
OP/USDT — Major Accumulation Zone: Larger Move is in the Making?
Optimism (OP) is currently consolidating within a major accumulation zone between 0.72–0.60, which has acted as a key macro support since the sharp decline from the 4.8–5.0 peak.
This range represents a crucial battleground between buyers and sellers — where selling pressure is fading and early signs of base formation are emerging.
---
Technical Structure
Current Phase: Sideways consolidation after a prolonged downtrend.
Yellow Zone (0.72–0.60): Strong demand area and macro support tested multiple times.
Key Resistance: 0.8858 — the upper boundary of the range that will define the next major direction.
Potential Pattern: Developing rectangle accumulation or rounded bottom base above demand.
Volume Behavior: Decreasing gradually, indicating quiet accumulation by long-term players (smart money phase).
---
Bullish Scenario
A confirmed breakout and close above 0.8858 would mark the end of accumulation and the start of a potential mid-term uptrend.
Projected upside targets:
1.20 → breakout validation zone
1.80 → main swing target
2.55 – 3.00 → mid-term expansion target if momentum continues
Additional confirmations:
Rising volume during breakout.
Successful retest of 0.8858 as new support.
Formation of higher lows above 0.72.
> “Reclaiming 0.8858 could transform this quiet range into the ignition point of a new bullish phase.”
---
Bearish Scenario
If the price closes below 0.60, the accumulation structure would fail and likely lead to a macro continuation to the downside.
Downside targets:
0.50 – 0.45 → minor support
0.3953 → major historical low and potential capitulation zone
Such a breakdown would confirm renewed selling dominance and a possible search for a new long-term bottom.
---
Conclusion
The 0.72–0.60 range is the critical decision zone for OP’s next major move.
As long as the price holds above this level, the bias remains neutral-to-bullish, supported by signs of accumulation.
A breakout above 0.8858 could mark the beginning of a new uptrend, while a breakdown below 0.60 would signal continuation of the broader downtrend.
> “Calm ranges like this often precede explosive moves — and OP is quietly building the foundation for one.”
---
#Optimism #OPUSDT #CryptoAnalysis #SwingTrading #TechnicalAnalysis #AccumulationZone #BreakoutSetup #Altcoins #CryptoMarket #Layer2 #PriceAction
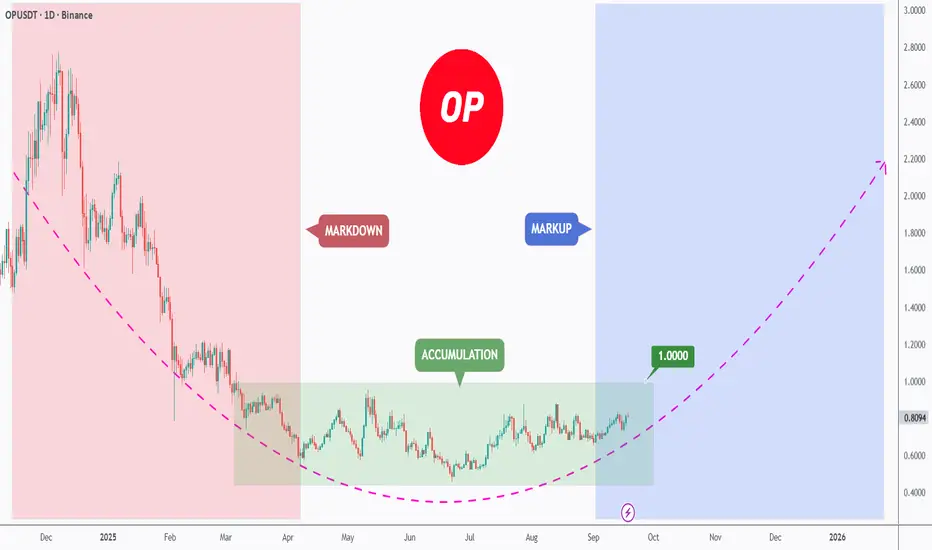
OP - Accumulation Base, Eyes on $1 BINANCE:OPUSDT spent months in markdown, then shifted into a broad accumulation range. Momentum is stabilizing, and price is leaning toward the top of that box.
The first key hurdle is the $1 psychological level 🔑. It lines up with range resistance and a potential phase shift into markup if broken with a clean daily close.
As long as the range low holds, I’ll look for dips to get involved, targeting a retest of $1 and higher inside a developing markup phase 🚀. If price loses the range floor, I’ll step aside and wait for fresh confirmation ⏳.
What’s your plan here => buy the base and ride the breakout, or wait for a confirmed close above $1? 🤔
⚠️ Disclaimer: This is not financial advice. Always do your own research and manage risk properly.
📚 Stick to your trading plan regarding entries, risk, and management.
Good luck! 🍀
All Strategies Are Good; If Managed Properly!
~Richard Nasr
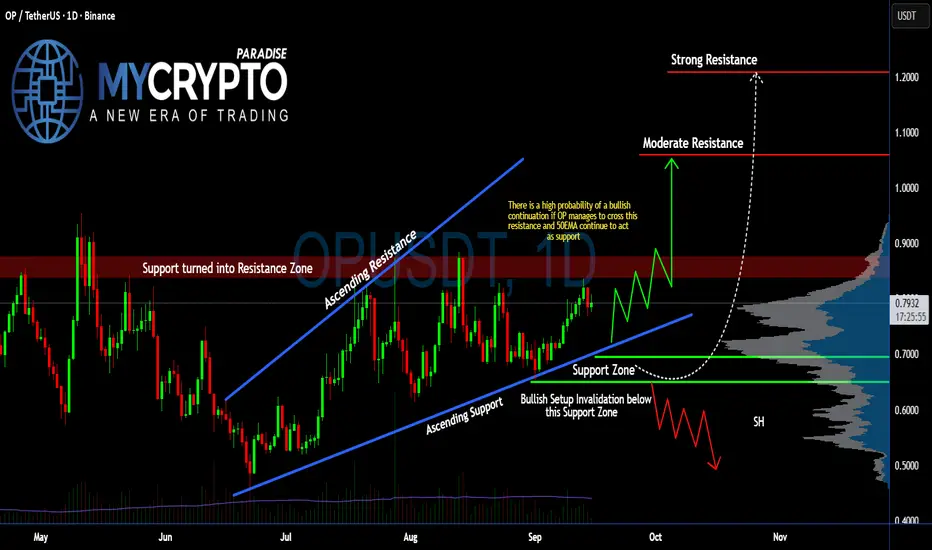
Will #OP Finally Explode or Is This Just Another Trap for Bulls?Yello, Paradisers! Is #Optimism gearing up for a breakout, or is this the final squeeze before bulls get dumped on hard? Let’s dissect what’s really happening on #OPUSDT:
💎After forming a clean ascending channel since mid-June, #OP has been respecting both the ascending support and ascending resistance zones. Price is currently sitting just below the key resistance zone around $0.83–$0.85, which was previously a support level before flipping into strong resistance. This makes it a major decision point for the next move.
💎If #OPUSD manages to break and close above the $0.85 resistance area with strong volume, and the 50EMA continues to hold as dynamic support, then we’re likely to see a push towards the moderate resistance around $1.059. If that level is cleared, the next logical upside target sits near $1.20, aligning with the strong resistance and peak on the volume profile.
💎As long as price holds above the Support Zone between $0.69 and $0.65, the bullish case remains valid. The structure continues to print higher lows, showing that buyers are defending the trendline support. A successful retest here could lead to a powerful bullish continuation.
💎However, if bulls lose control and #OPUSDT closes below the $0.650 support, the entire bullish setup would be invalidated. In that case, price could slide down toward the $0.50–$0.55 zone, especially if volume dries up. This would complete a potential head-and-shoulders pattern and trigger a shift toward a bearish structure.
Stay patient, Paradisers. Let the breakout confirm, and only then do we strike with conviction.
MyCryptoParadise
iFeel the success🌴
OP Secondary trend. Wedge. Reversal zones. 17 04 2025From the wedge breakout, the price reached the level of 2.857 (81%) and from it the trend reversal under the general trend of altcoins, breaking through the "neck" zone of the head and shoulders, thereby realizing this pattern on a large scale and reaching the reversal zone of the minimums of the level of 0.509. We went down to the range below along the fan. Consolidation above the dynamic support opens up the potential for movement to its resistance, I specifically put another meridian, as from it with a high degree of probability, even with the implementation of the bullish potential, there will be a significant pump / dump rollback. It just intersects with the previous consolidation of support, which in this case acts as resistance (those who previously bought in this zone will sell, thereby going into breakeven and stimulating the stop of the impulse and a rollback (logical probability).
Locally, again having formed on the fall, as before, a descending wedge in the secondary trend. It has not yet been fully formed, the price is not clamped. But, conditionally, the price is at the minimum zone. You can start gaining from the average price, or work on a breakthrough of the formation, observing risk and money management. If you are scared (it is always like this at the minimum zone) - then everyone is the same, and most refuse to buy, but willingly buy when the price is already expensive.
A breakthrough of this wedge is a corrective upward movement to the mirror resistance zone of the previous consolidation (highlighted in gray), if in general, a "revival of faith" is observed in alts.
Also after breakout of the wedge, if the market as a whole is bearish on alts, then they will make a cut (in this case, a repeated set) at the zone of minimums in a wide range of price slippage and the complete death of faith in the candy wrapper of "crypto whales", highlighted in green.

OP - following the plan! NASDAQ:OP - following the plan nicely 📈
1000% accuracy since almost 1 week 🔥

Buy Alert OP (Optimism) - August 27, 2025.NASDAQ:OP #Optimism 🩸 — Investors - Tier 1 | Optimism is a low-cost and lightning-fast Ethereum L2 blockchain | August 27, 2025.
We've analyzed the data on the cryptocurrency Optimism and concluded that now is an excellent entry point for a Spot position, with a potential upside of +22% from $0.70 to $0.86.
🚀 Why?
➖ 1. Limit Order on Coinbase: A major player has placed a limit sell order on the crypto exchange Coinbase at $0.86.
➖ 2. Liquidation Max Pain: For Optimism, the Max Pain level is at $0.8901, with the imbalance favoring short traders. Market makers will push the price upward to liquidate those positions, while limit orders above help large players secure their profits.
➖ 3. Chart Analysis: On the chart, we can see how the bullish candle from August 22, 2025, was engulfed, collecting stop-losses from long traders. This is a common manipulation tactic by big players to shake out as many leveraged positions as possible.
➖ 4. Altcoin Trend Shift: The trend for altcoins is gradually shifting from sideways accumulation to aggressive buildup and a growth phase (in other words, liquidations are being harvested on both sides right now, with a large player accumulating for an aggressive surge in Optimism's price—I suspect altseason could kick off in the coming months, though that word has become almost a curse 🙃).
In Summary:
We anticipate Optimism's rise from $0.70 to $0.86 (+22%) in the near term. Avoid leverage—stick to Spot positions only. After this upmove, expect a pullback to around $0.62, where you can build your core portfolio position and wait for altseason.

OP - Bullish structure medium term NASDAQ:OP - Inverse H&S structure spotted - Bullish medium term 📈
Pump potential:
70%+ 🚀
Key demand zone to be maintained:
0.6300 - 0.6150$
Weekly resistances;
0.8150 - 0.9250 - 1.060 - 1.00 - |1.180 - 1.20| - 1.380 - 1.600$

#OP/USDT#OP
The price is moving within a descending channel on the 1-hour frame, adhering well to it, and is heading for a strong breakout and retest.
We are seeing a bounce from the lower boundary of the descending channel, which is support at 0.653.
We have a downtrend on the RSI indicator that is about to be broken and retested, supporting the upward trend.
We are looking for stability above the 100 moving average.
Entry price: 0.702
First target: 0.757
Second target: 0.805
Third target: 0.865

#OP/USDT#OP
The price is moving within a descending channel on the 1-hour frame and is expected to break and continue upward.
We have a trend to stabilize above the 100 moving average once again.
We have a downtrend on the RSI indicator that supports the upward move with a breakout.
We have a support area at the lower limit of the channel at 0.600, acting as strong support from which the price can rebound.
Entry price: 0.616
First target: 0.630
Second target: 0.641
Third target: 0.658

OP - Chance for +70%After weekly close we can see the volume coming in. On the chart we have resistance which if we break through then we can expect price 1.4 which is +70% from now.
If I have some advice for leverage trading I think its better to wait for daily close and then hunt retest if happens.
Rotations of money started already and I don't think is it a case for long run. We need to act, take profit and watch something else.
Like if you like analysis and idea.
Ivan

TradeCityPro | OP Eyes Breakout in Prolonged Altseason Range 👋 Welcome to TradeCity Pro!
In this analysis, I want to review the OP coin for you — one of the Layer 2 projects whose token currently holds a market cap of $1.39 billion and is ranked 68th on CoinMarketCap.
📅 Daily Timeframe
On the daily timeframe, OP is moving within a range box between 0.521 and 0.920, which formed after a downtrend, and the price has been fluctuating in this box for several months.
🔑 One key resistance on this coin is 0.816, which can be used as a trigger for a long position.
📈 This trigger can also be used for spot buying, but given its Bitcoin pair, I prefer to take the position in futures and reserve spot buys for future triggers.
💥 For momentum confirmation of this position, we can use RSI’s entry into the Overbought zone, since RSI is currently near this area, and if it enters, it could support a strong upward move.
📊 The next long trigger is the breakout of 0.920. However, this trigger is not valid at the moment because the price hasn’t reacted to it for a long time, and in the future, if it does react, the level will likely change. In that case, I’ll update the analysis and give you the new trigger.
✔️ If OP declines, the first important support we have is 0.626. A close below this level could allow for a risky short position, but for shorts, I’ll personally wait for a break below 0.521.
📝 Final Thoughts
Stay calm, trade wisely, and let's capture the market's best opportunities!
This analysis reflects our opinions and is not financial advice.
Share your thoughts in the comments, and don’t forget to share this analysis with your friends! ❤️

$OP – One to Keep in the Basket
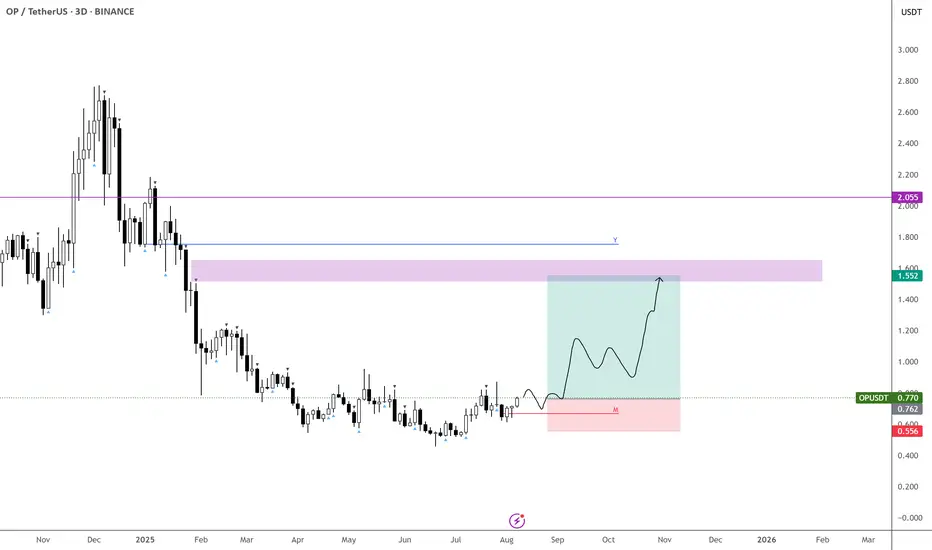
Liking the structure here — the 3day chart is on the verge of triggering a bullish signal, so I’m getting in early with some buys here.
If price dips into $0.66 or $0.55, I’ll be adding more.
Targeting the FVG just below the yearly open for this move. BINANCE:OPUSDT
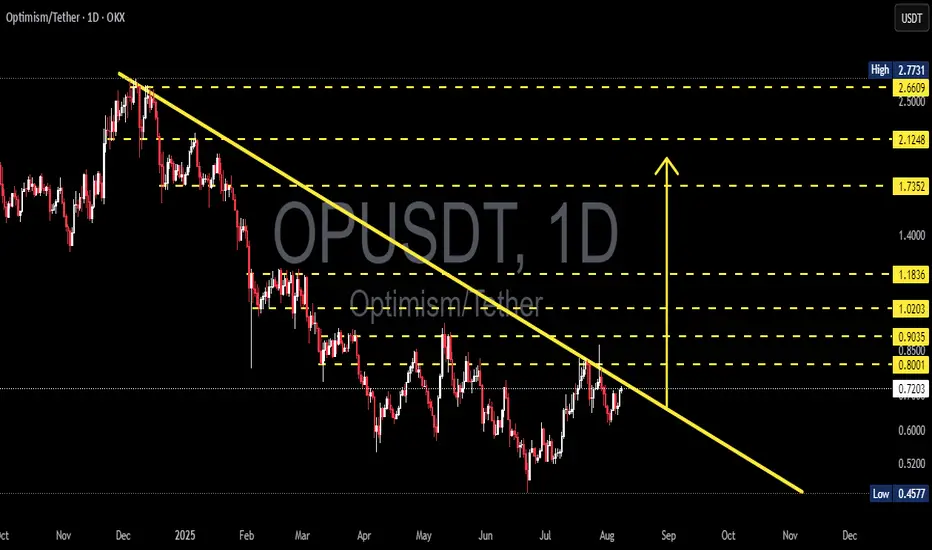
OP/USDT Technical Analysis – Approaching a Major Breakout Zone!Chart Overview: The OP/USDT pair on the 1D (Daily) timeframe is currently moving within a long-term descending trendline, forming a descending triangle or falling resistance channel since November 2024. The price is now approaching a critical point near the long-term resistance trendline (yellow line), which has been tested multiple times.
---
🟢 Bullish Scenario: Breakout Potential
If the price manages to break and close above the descending trendline resistance (currently near the $0.80–$0.85 zone), it would signal a strong bullish breakout. The next key resistance levels to watch (based on yellow dotted horizontal lines) are:
1. $0.9035 – minor resistance
2. $1.0203 – psychological level
3. $1.1836 – mid-term strong resistance
4. $1.7352 and $2.1248 – extended bullish targets
A confirmed breakout would ideally be supported by increasing volume and RSI momentum above 50.
---
🔴 Bearish Scenario: Rejection at Resistance
If the price fails to break the trendline and gets rejected, a downside move is likely to follow. Key support levels to watch are:
1. $0.7200 – current support
2. $0.6000 – minor support
3. $0.4577 – strong historical support (lowest level)
This would suggest continued bearish control and could extend the downtrend that has lasted over 8 months.
---
📊 Pattern Breakdown: Descending Trendline
Consistent lower highs since the peak near $2.77
The descending trendline is the main battle zone between bulls and bears
This pattern often leads to a breakout if buyers gain momentum
---
🎯 Conclusion & Strategy:
This is a critical zone for OP/USDT.
Traders should wait for breakout confirmation before entering long positions.
For breakout traders: consider a buy-the-breakout strategy with stop-loss below the trendline.
For short sellers: look for a rejection at resistance with targets at the nearest support levels.
#OPUSDT #CryptoAnalysis #Altcoins #TechnicalAnalysis #BreakoutTrade #Optimism #CryptoSetup #BullishScenario #BearishScenario #ChartPatterns
[Deep Dive] OP – Edition 4: Accumulated Pressure!Optimism (OP) may be quietly setting the stage for a classic reversal play — with structure, sentiment, and cycle theory all lining up.
After a sharp markdown throughout Q4 2024 and early 2025, OP has spent several months forming what appears to be a rounded accumulation base. And if history rhymes, a markup phase could be next.
🔍 Phase Breakdown
📉 Markdown
The aggressive downtrend sent OP tumbling from above $3 all the way to the $0.50–$0.60 support region, wiping out months of bullish structure and triggering capitulation.
📦 Accumulation
Since then, the price has been compressing sideways in a tight range, respecting the $0.50 psychological zone while creating a rounded bottom pattern. This sideways action — combined with declining volatility — suggests sellers are exhausted, and accumulation may be underway.
📈 Markup Potential
The current setup mirrors textbook market cycles, where markdown gives way to accumulation, followed by expansion. If OP breaks above the $0.70–$0.85 resistance zone with volume, the door opens for a rally toward $1.85 and even $2.00 — the next key supply zones.
⚙️ Fundamental Fuel
Optimism is more than just a Layer 2 — it’s the engine behind the Superchain vision. With OP Stack now powering not only Optimism but also chains like Base and Zora, the protocol is becoming the backbone of Ethereum’s scalability roadmap.
Recent key updates include:
- New governance structures via RetroPGF Round 3 distribution.
- Continued expansion of OP Stack rollups.
- Growth in on-chain activity and TVL thanks to Base's rapid adoption.
All of this adds up to strong long-term tailwinds — especially if Ethereum Layer 2 narratives reheat.
🧠 What to Monitor Next
🔍 Break above $0.85 = confirmation of phase shift.
📊 $0.50 remains the key invalidation level for the current bullish thesis.
🧨 Watch for volume spikes near resistance — they often precede explosive markups.
💬 Are we witnessing the calm before Optimism’s storm — or just another pause in a longer downtrend?
🔔 Disclaimer: This post is for educational and informational purposes only. It does not constitute financial advice. Always do your own research and manage risk carefully.
📚 Always follow your trading plan => including entry, risk management, and trade execution.
Good luck!
All strategies are good, if managed properly.
~ Richard Nasr

Optimism Op price analysis - be careful After the listing of #OP on the Korean exchange, known for its "pump events", we observe a surge in volume along with a breakout from the downtrend.
🐻 The current 6-hour candle on OKX:OPUSDT is attempting to form a pin bar — a potential reversal signal.
⚠️ High volumes often indicate the final phase of a move. Such pumps are usually short-lived — proceed with caution.
👌 Our previously published medium-term forecast for #Optimism remains relevant
________________
📚 Follow us ❤️ for daily crypto insights & updates!
🚀 Don’t miss out on important market moves!
