OP market forms a bullish descending expanding wedgeThe open market has formed a bullish pattern, a descending expanding wedge, and the coin is actively testing its lower boundary
Support is holding the price, if a breakout occurs, it is more likely to be false
The pattern is most likely expected to play out and move above the moving averages
Current price: $0.3751
A breakout of the purple area is likely to result in a downward movement
More detailed analysis, additional charts, and key levels to watch are available on our site
OPUSDC

Might be time to dip back into OPBTC just smashed through $100K, and ETH's hovering right around $3K.
Might be time to dip back into OP—looks like the liq map shows they flushed out every last long trader.
Entry: $0.3547
Take Profit: $0.6800
Stop Loss: $0.3098
Playing it with a 1:8 RR.
If this one gets stopped out, I'll eye the next entry around $0.26 +/- straight into the spot bag. All that prime liquidity's piled up overhead.

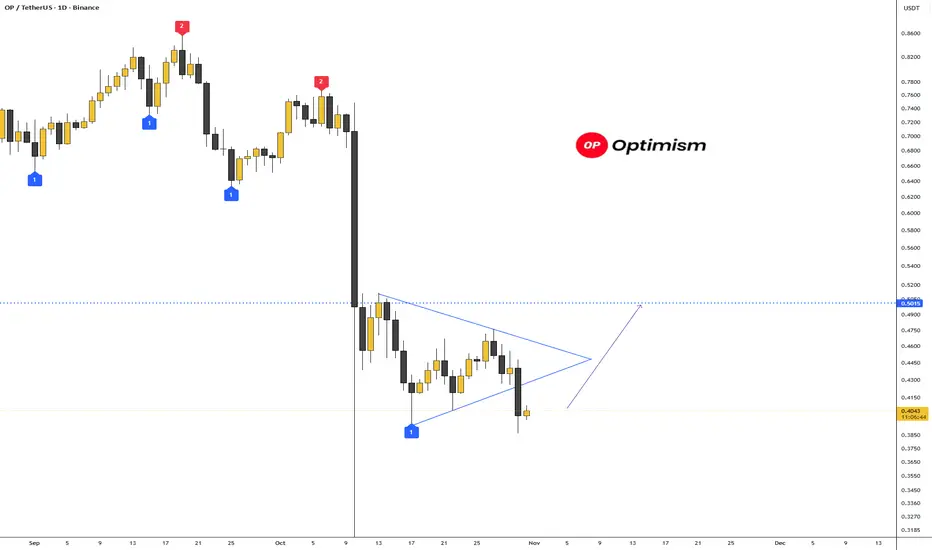
There's also an interesting entry point on OptimismThere's also an interesting entry point on NASDAQ:OP #Optimism.
The trade is almost 1 to 5.
Entry: $0.4059
Take Profit: $0.5015
Stop Loss: $0.3849
It looks a lot like a false breakdown downward and growth along with Bitcoin and Ethereum is quite possible.
Short traders' liquidity has already accumulated.
#Crypto #Trading #DayTrading
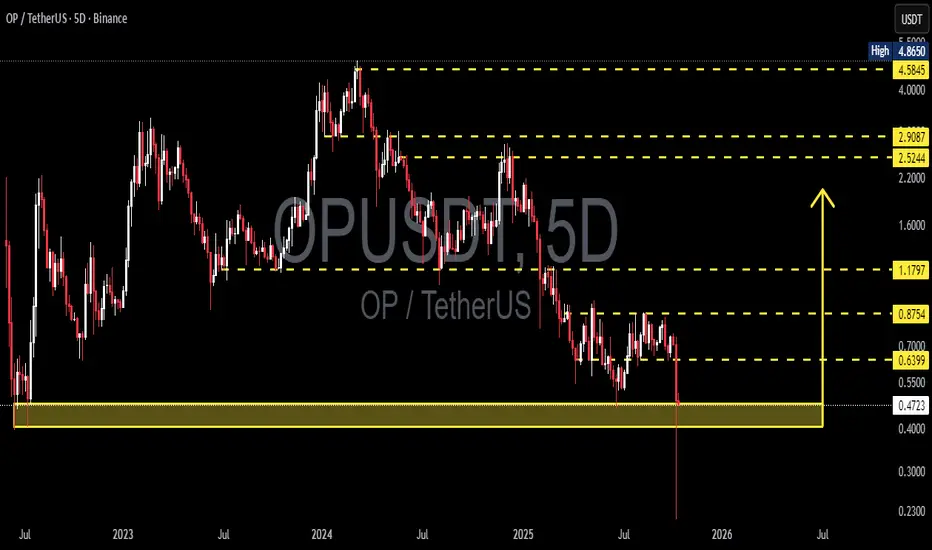
OP/USDT – On the Edge of Reversal or Final Breakdown?Optimism (OP) is standing at a critical crossroads after a long and steady downtrend that has persisted since mid-2024.
Price is now testing the major support zone between 0.405–0.476 (yellow block) — a historical demand area that once marked the beginning of a major rally in the past.
The deep wick below this area indicates a liquidity sweep, suggesting that larger players may have flushed out retail stop-losses before positioning for the next major move.
This zone is not just a number — it represents the psychological line between capitulation and accumulation.
While the macro structure still shows lower highs and lower lows, the reaction in this support range will determine whether a mid-term reversal can begin or if the macro downtrend continues.
---
Pattern & Structure Analysis
Main trend: Bearish, with continuous lower highs and lower lows.
Yellow block (0.405–0.476): Key historical demand zone that previously triggered strong accumulation.
Long wick below: Possible false breakdown or stop hunt, indicating liquidity absorption.
Potential setup: Early formation of a double-bottom pattern if price holds above 0.405 and reclaims higher resistance.
---
Bullish Scenario
If price strongly bounces from 0.405–0.476 and successfully closes above 0.6399 (5D timeframe), it could confirm the start of a mid-term reversal.
Initial target: 0.8754
Next target: 1.1797
Bullish confirmation: 5D close above 0.6399 with rising volume.
Invalidation: 5D close below 0.405.
This zone offers potential accumulation for swing traders, but confirmation from volume and structure is essential before committing.
---
Bearish Scenario
If OP fails to hold 0.405 and closes below this support zone, the bearish momentum will likely accelerate.
First target: 0.23 (previous liquidity sweep low).
Bearish confirmation: 5D close below 0.405 with strong selling volume.
Invalidation: 5D reclaim above 0.6399.
A clean breakdown would confirm a continuation of the macro downtrend, signaling a deeper capitulation phase.
---
Market Narrative
The 0.405–0.476 zone is where buyers and sellers face their final test.
This is the battlefield between smart money accumulation and bearish momentum exhaustion.
A strong bullish reaction here could indicate that smart money is stepping in, while a failure to hold could lead to the final flush before a long consolidation phase.
This is the zone that will define whether OP finds its true bottom or enters another leg down.
---
Technical Summary
Support zone: 0.405–0.476
Nearest resistance: 0.6399
Bullish targets: 0.8754 → 1.1797
Bearish target: 0.23
Main trend: Bearish
Timeframe: 5D (mid-term outlook)
---
#OP #Optimism #OPUSDT #CryptoAnalysis #TechnicalAnalysis #PriceAction #SupportAndResistance #CryptoTrading #MarketStructure #SupplyDemand #CryptoOutlook #BullishScenario #BearishScenario #AltcoinAnalysis
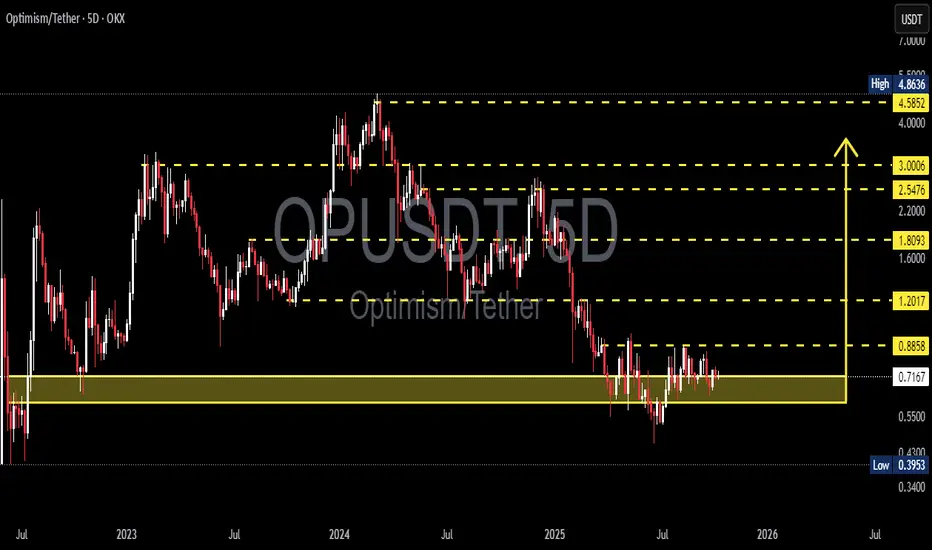
OP/USDT — Major Accumulation Zone: Larger Move is in the Making?
Optimism (OP) is currently consolidating within a major accumulation zone between 0.72–0.60, which has acted as a key macro support since the sharp decline from the 4.8–5.0 peak.
This range represents a crucial battleground between buyers and sellers — where selling pressure is fading and early signs of base formation are emerging.
---
Technical Structure
Current Phase: Sideways consolidation after a prolonged downtrend.
Yellow Zone (0.72–0.60): Strong demand area and macro support tested multiple times.
Key Resistance: 0.8858 — the upper boundary of the range that will define the next major direction.
Potential Pattern: Developing rectangle accumulation or rounded bottom base above demand.
Volume Behavior: Decreasing gradually, indicating quiet accumulation by long-term players (smart money phase).
---
Bullish Scenario
A confirmed breakout and close above 0.8858 would mark the end of accumulation and the start of a potential mid-term uptrend.
Projected upside targets:
1.20 → breakout validation zone
1.80 → main swing target
2.55 – 3.00 → mid-term expansion target if momentum continues
Additional confirmations:
Rising volume during breakout.
Successful retest of 0.8858 as new support.
Formation of higher lows above 0.72.
> “Reclaiming 0.8858 could transform this quiet range into the ignition point of a new bullish phase.”
---
Bearish Scenario
If the price closes below 0.60, the accumulation structure would fail and likely lead to a macro continuation to the downside.
Downside targets:
0.50 – 0.45 → minor support
0.3953 → major historical low and potential capitulation zone
Such a breakdown would confirm renewed selling dominance and a possible search for a new long-term bottom.
---
Conclusion
The 0.72–0.60 range is the critical decision zone for OP’s next major move.
As long as the price holds above this level, the bias remains neutral-to-bullish, supported by signs of accumulation.
A breakout above 0.8858 could mark the beginning of a new uptrend, while a breakdown below 0.60 would signal continuation of the broader downtrend.
> “Calm ranges like this often precede explosive moves — and OP is quietly building the foundation for one.”
---
#Optimism #OPUSDT #CryptoAnalysis #SwingTrading #TechnicalAnalysis #AccumulationZone #BreakoutSetup #Altcoins #CryptoMarket #Layer2 #PriceAction
Buy Alert OP (Optimism) - August 27, 2025.NASDAQ:OP #Optimism 🩸 — Investors - Tier 1 | Optimism is a low-cost and lightning-fast Ethereum L2 blockchain | August 27, 2025.
We've analyzed the data on the cryptocurrency Optimism and concluded that now is an excellent entry point for a Spot position, with a potential upside of +22% from $0.70 to $0.86.
🚀 Why?
➖ 1. Limit Order on Coinbase: A major player has placed a limit sell order on the crypto exchange Coinbase at $0.86.
➖ 2. Liquidation Max Pain: For Optimism, the Max Pain level is at $0.8901, with the imbalance favoring short traders. Market makers will push the price upward to liquidate those positions, while limit orders above help large players secure their profits.
➖ 3. Chart Analysis: On the chart, we can see how the bullish candle from August 22, 2025, was engulfed, collecting stop-losses from long traders. This is a common manipulation tactic by big players to shake out as many leveraged positions as possible.
➖ 4. Altcoin Trend Shift: The trend for altcoins is gradually shifting from sideways accumulation to aggressive buildup and a growth phase (in other words, liquidations are being harvested on both sides right now, with a large player accumulating for an aggressive surge in Optimism's price—I suspect altseason could kick off in the coming months, though that word has become almost a curse 🙃).
In Summary:
We anticipate Optimism's rise from $0.70 to $0.86 (+22%) in the near term. Avoid leverage—stick to Spot positions only. After this upmove, expect a pullback to around $0.62, where you can build your core portfolio position and wait for altseason.

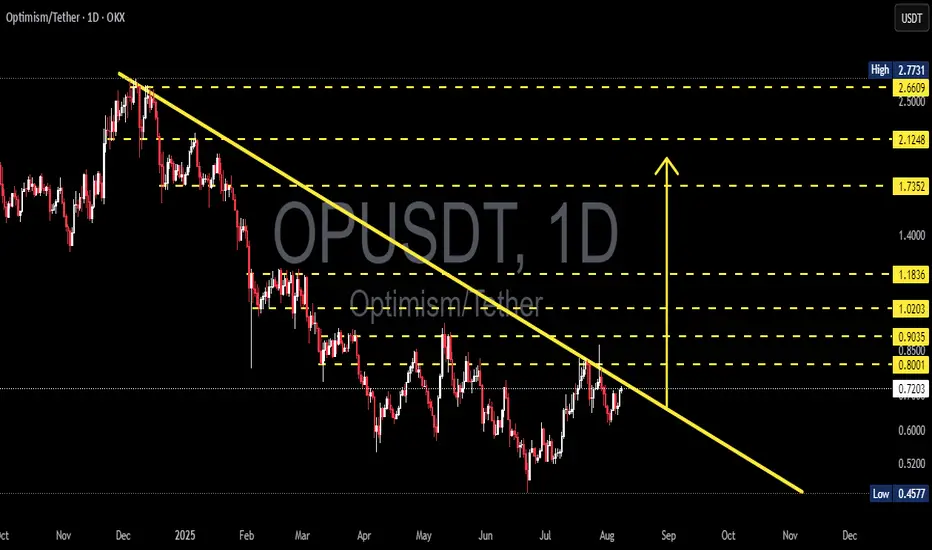
OP/USDT Technical Analysis – Approaching a Major Breakout Zone!Chart Overview: The OP/USDT pair on the 1D (Daily) timeframe is currently moving within a long-term descending trendline, forming a descending triangle or falling resistance channel since November 2024. The price is now approaching a critical point near the long-term resistance trendline (yellow line), which has been tested multiple times.
---
🟢 Bullish Scenario: Breakout Potential
If the price manages to break and close above the descending trendline resistance (currently near the $0.80–$0.85 zone), it would signal a strong bullish breakout. The next key resistance levels to watch (based on yellow dotted horizontal lines) are:
1. $0.9035 – minor resistance
2. $1.0203 – psychological level
3. $1.1836 – mid-term strong resistance
4. $1.7352 and $2.1248 – extended bullish targets
A confirmed breakout would ideally be supported by increasing volume and RSI momentum above 50.
---
🔴 Bearish Scenario: Rejection at Resistance
If the price fails to break the trendline and gets rejected, a downside move is likely to follow. Key support levels to watch are:
1. $0.7200 – current support
2. $0.6000 – minor support
3. $0.4577 – strong historical support (lowest level)
This would suggest continued bearish control and could extend the downtrend that has lasted over 8 months.
---
📊 Pattern Breakdown: Descending Trendline
Consistent lower highs since the peak near $2.77
The descending trendline is the main battle zone between bulls and bears
This pattern often leads to a breakout if buyers gain momentum
---
🎯 Conclusion & Strategy:
This is a critical zone for OP/USDT.
Traders should wait for breakout confirmation before entering long positions.
For breakout traders: consider a buy-the-breakout strategy with stop-loss below the trendline.
For short sellers: look for a rejection at resistance with targets at the nearest support levels.
#OPUSDT #CryptoAnalysis #Altcoins #TechnicalAnalysis #BreakoutTrade #Optimism #CryptoSetup #BullishScenario #BearishScenario #ChartPatterns
OPUSDT 1W AnalysisOP ~ 1W Analysis
#OP Buy back gradually from here, this is the lowest support block for now with a short term target of at least 20%+ from here.

OPUSDT 1D AnalysisOP ~ 1D Analysis
#OP Buy in stages from here with a short term target of at least 15%+ and a long term target of $2.7

op idea"🌟 Welcome to Golden Candle! 🌟
We're a team of 📈 passionate traders 📉 who love sharing our 🔍 technical analysis insights 🔎 with the TradingView community. 🌎
Our goal is to provide 💡 valuable perspectives 💡 on market trends and patterns, but 🚫 please note that our analyses are not intended as buy or sell recommendations. 🚫
Instead, they reflect our own 💭 personal attitudes and thoughts. 💭
Follow along and 📚 learn 📚 from our analyses! 📊💡"

Optimism: Strategic Insight and Growth PotentialI gathered data from Coinbase in the Orderbook and marked significant limit orders placed before Optimism's price correction.
These are likely targets for Optimism's journey to the Moon ($12-$42).
May the force be with us.

OPUSDT S/R Flip TestingThe #OPUSDT pair has dropped to the S/R flip area. This zone should be closely monitored.
Take your risk, make some profit.

Optimism To The Moon🩸 NASDAQ:OP #Optimism (OP/USDT) (March 12, 2024) (#OP, #Spot)
In 2024, Optimism continues to play a significant role in the Ethereum ecosystem as a Layer 2 optimistic rollup solution, emphasizing scalability and efficiency. With a total funding amount of $178.5 million, Optimism has attracted the interest of notable investors and companies, underscoring its potential in the blockchain space.
Optimism's growth has been fueled by strategic partnerships and upgrades, enhancing the network's appeal to developers and users alike. This focus on network efficiency and expanded utility positions Optimism for potential growth amid a broader market adoption of Layer 2 solutions. Optimism has seen a notable rise in its ecosystem, making it an attractive option for investors looking for promising cryptocurrency projects in the run-up to a potential 2024 bull market.
Tokenomics-wise, Optimism boasts a market cap of over $1.2 billion, with a total supply of approximately 4.3 billion tokens and an inflation rate of 2%. The distribution of these tokens is strategically allocated across retroactive public goods funding, investors, core contributors, the ecosystem fund, and airdrops. This allocation strategy underlines Optimism's commitment to both its community and its technological infrastructure.
🕵️ Investors (Tier 1,2):
a16z (Andreessen Horowitz), IDEO CoLab Ventures, Paradigm
As the crypto landscape continues to evolve, Optimism's developments and its role within the Ethereum scaling solution space signify the dynamic nature of the market, offering promising avenues for both developers and investors.
🟢 Entry price: $4.38
🟢 Take Profit 1: $8.76 (50%)
🟢 Take Profit 2: $18.80 (10%)
🟢 Take Profit 3: $23.50 (10%)
🟢 Take Profit 4: $28.20 (10%)
🟢 Take Profit 5: $32.90 (10%)
🟢 Take Profit 6: $37.60 (10%)

Buying Optimism - Target 1.58Traders,
Optimism with the triangle breakout and retest is a solid entry rn. Additionally, there is some hidden bullish divergence occurring on the RSI!
Entry = 1.34
Target = 1.58
SL = 1.25
r/r = 3
Not fin advice. Just showing you all what I am currently playing.
Best,
Stew

OP potentially increase by 50%1D time frame
-
OP created a resistance structure before.
There is also the target to close long.
Target: 2
SL: 1.25

OPUSDT - Buy Setup!!OPUSDT (1D Chart) Technical analysis
OPUSDT (1D Chart) Currently trading at $2.56
Buy level: Above $2.55
Stop loss: Below $2.15
TP1: $2.9
TP2: $3.25
TP3: $ 4
TP4: $ 5
Max Leverage 2x
Always keep Stop loss
Follow Our Tradingview Account for More Technical Analysis Updates, | Like, Share and Comment Your thoughts

OPUSDT - Buy Setup!!OPUSDT (4h Chart) Technical analysis
OPUSDT (4h Chart) Currently trading at $0.95
Buy level: Above $0.95
Stop loss: Below $0.88
TP1: $0.98
TP2: $1
TP3: $1.12
TP4: $1.2
Max Leverage 3x
Always keep Stop loss
Follow Our Tradingview Account for More Technical Analysis Updates, | Like, Share and Comment Your thoughts

OPUSDT OP USDT
As for us op, we notice that we have a right shoulder, a head, and a left shoulder, so I see BINANCE:OPUSDT that all goals have been achieved.
Greetings

OPUSDT - Channel Breakout!OPUSDT (4h Chart) Technical analysis
OPUSDT (4h Chart) Currently trading at $1.26
Buy level: Above $1.25
Stop loss: Below $1.072
Target 1: $1.37
Target 2: $1.61
Target 3: $1.84
Target 4: $2.2
Max Leverage 3x
Always keep Stop loss
Follow Our Tradingview Account for More Technical Analysis Updates, | Like, Share and Comment Your thoughts

OP ready to fly!!!After a very deep pullback and a bullish reversal, I expect a strong move up from here! (High-Quality Trade)
NFA

OP GOING TO CREATE NEW ALL TIME HIGH? or A DUMP?OP/USDT currently moving in a symmetrical triangle which is continuation pattern , most probably it will give a bullish breakout but still their are chances that it will give a breakdown and dump upto our next suuport which is at around 22% below from our lower trendline but if it gives a breakout than technically we can see a jump upto 26% which will make a new all time high.
