OP bullish here.OP coin looks bullish here as price did MSS and now tapped into DEMAND ZONE + FVG area, showing bullish intent, so we can expect pump in coming days.
OPUSDT

#OP/USDT Ready to launch upwards#OP
The price is moving in a descending channel on the 1-hour timeframe. It has reached the lower boundary and is heading towards breaking above it, with a retest of the upper boundary expected.
We have a downtrend on the RSI indicator, which has reached near the lower boundary, and an upward rebound is expected.
There is a key support zone in green at 0.3230. The price has bounced from this level multiple times and is expected to bounce again.
We have a trend towards consolidation above the 100-period moving average, as we are moving close to it, which supports the upward movement.
Entry price: 0.3300
First target: 0.3352
Second target: 0.3456
Third target: 0.3576
Don't forget a simple principle: money management.
Place your stop-loss order below the support zone in green.
For any questions, please leave a comment.
Thank you.

#OP/USDT – Triangle Pattern Breakout Loading?#OP
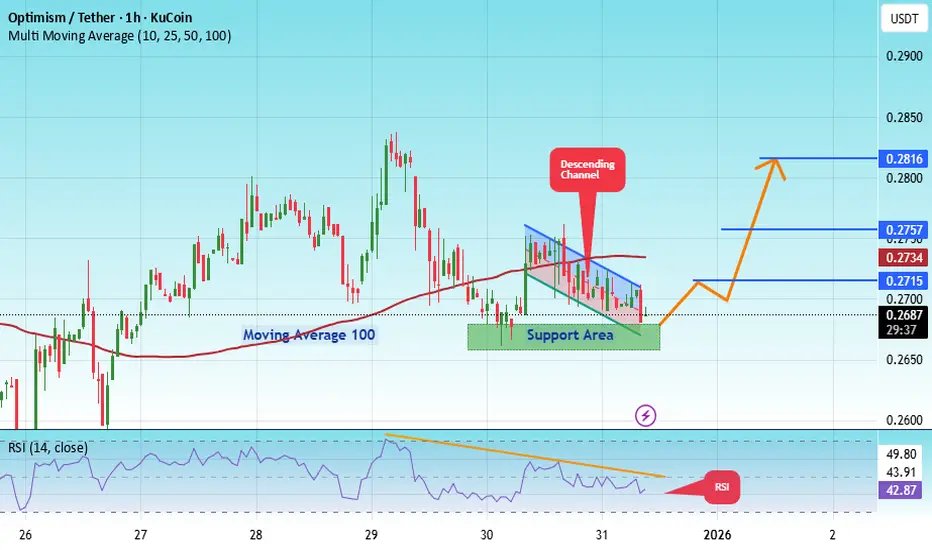
The price is moving in a descending channel on the 1-hour timeframe. It has reached the lower boundary and is heading towards breaking above it, with a retest of the upper boundary expected.
We have a downtrend on the RSI indicator, which has reached near the lower boundary, and an upward rebound is expected.
There is a key support zone in green at 0.2660. The price has bounced from this zone multiple times and is expected to bounce again.
We have a trend towards consolidation above the 100-period moving average, as we are moving close to it, which supports the upward movement.
Entry price: 0.2693
First target: 0.2715
Second target: 0.2757
Third target: 0.2816
Stop loss: Below the support zone in green.
Don't forget a simple thing: capital management.
For inquiries, please leave a comment.
Thank you.
#OP/USDT – Triangle Pattern Breakout Loading?#OP
The price is moving in a descending channel on the 1-hour timeframe. It has reached the lower boundary and is heading towards breaking above it, with a retest of the upper boundary expected.
We have a downtrend on the RSI indicator, which has reached near the lower boundary, and an upward rebound is expected.
There is a key support zone in green at 0.2559. The price has bounced from this zone multiple times and is expected to bounce again.
We have a trend towards consolidation above the 100-period moving average, as we are moving close to it, which supports the upward movement.
Entry price: 0.2624
First target: 0.2668
Second target: 0.2772
Third target: 0.2888
Don't forget a simple principle: money management.
Place your stop-loss order below the support zone in green.
For any questions, please leave a comment.
Thank you.

FireHoseReel | Optimism Near Key Breakout Level as Volume Builds🔥 Welcome To FireHoseReel !
Let’s dive into Optimism (OP) analysis.
⛳️ OP Fundamental Overview
Optimism (OP) helps people use Ethereum faster and cheaper by reducing fees and speeding up transactions for DeFi, NFTs, and apps. Ranked around top 80 on CoinMarketCap, it’s a strong mid-cap Layer-2.
👀 OP 4H Overview
Optimism (OP) is trading inside a 4H range box and is currently positioned near the end of its bearish trend. A breakout above the descending curve trendline, followed by a break of the overhead resistances, could initiate a bullish 4H trend for OP.
📊 Volume Analysis
As price approached the curve trendline and the dynamic resistance at $0.2825, volume increased noticeably. This suggests that a breakout of this zone could lead to a fast and impulsive price move.
✍️ OP Trading Scenarios
🟢 Long Scenario:
A confirmed breakout above $0.2825 with increasing buy volume could allow price to break the top of the range and move toward the $0.3439 resistance.
🔴 Short Scenario:
A breakdown below $0.2518 could trigger a fast move toward a lower support level. Strong selling volume confirmation would be required.
🧠 Protect your capital first. No setup is worth blowing your account. If risk isn’t controlled, profit means nothing. Trade with rules, not emotions.

OP CURRENT EXPECTATIONS It is not finical advice at all . It just fro learning purpose .
My snap is Moja.25

OP market forms a bullish descending expanding wedgeThe open market has formed a bullish pattern, a descending expanding wedge, and the coin is actively testing its lower boundary
Support is holding the price, if a breakout occurs, it is more likely to be false
The pattern is most likely expected to play out and move above the moving averages
Current price: $0.3751
A breakout of the purple area is likely to result in a downward movement
More detailed analysis, additional charts, and key levels to watch are available on our site

There's also an interesting entry point on OptimismThere's also an interesting entry point on NASDAQ:OP #Optimism.
The trade is almost 1 to 5.
Entry: $0.4059
Take Profit: $0.5015
Stop Loss: $0.3849
It looks a lot like a false breakdown downward and growth along with Bitcoin and Ethereum is quite possible.
Short traders' liquidity has already accumulated.
#Crypto #Trading #DayTrading
Optimism one the good opportunity Hi Everyone;
today we have one of the best risk to reward Investment opportunity
it is more than 80 times the risk and the chart is look very promising.
I expect breaking the previous bear market key point will clear the way to the final target.

OP/USDT – Order Block Accumulation + RSI OversoldOP is currently bound within a consolidation range, showing signs of a potential order block formation—a zone where larger players may be accumulating. These structures often precede impulsive, expansive moves once the range is broken. We're seeing tight price action between $0.400 and $0.410, which could act as a springboard.
🔍 The RSI is deep into oversold territory, signaling that the selling momentum may be fading. This aligns with the idea of a reversal or breakout from the current accumulation zone. Watch for volume spikes or candle structure shifts as potential early signals.
📊 Trade Idea:
Entry Zone: $0.400 – $0.410
Take Profit Targets: $0.462 → $0.499 → $0.570
Stop Loss: Below $0.39

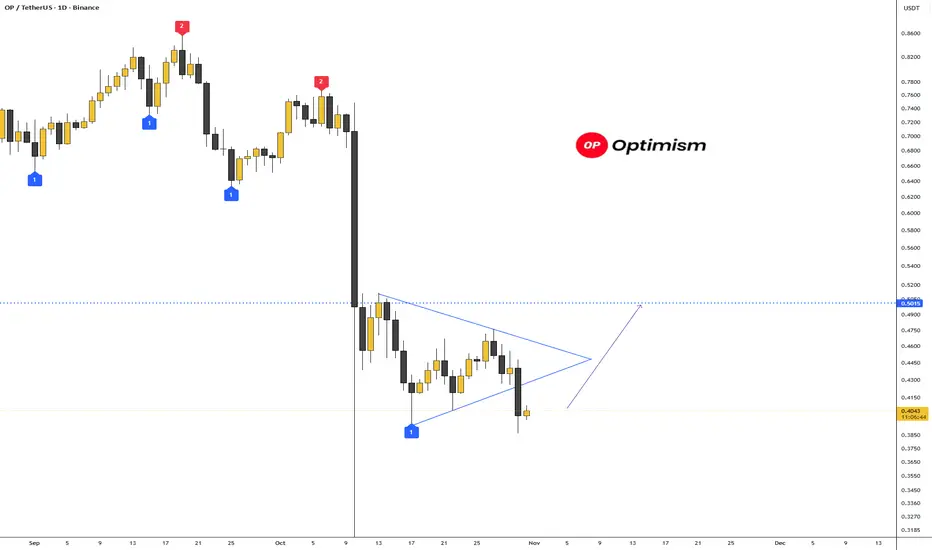
OP/USDT – On the Edge of Reversal or Final Breakdown?Optimism (OP) is standing at a critical crossroads after a long and steady downtrend that has persisted since mid-2024.
Price is now testing the major support zone between 0.405–0.476 (yellow block) — a historical demand area that once marked the beginning of a major rally in the past.
The deep wick below this area indicates a liquidity sweep, suggesting that larger players may have flushed out retail stop-losses before positioning for the next major move.
This zone is not just a number — it represents the psychological line between capitulation and accumulation.
While the macro structure still shows lower highs and lower lows, the reaction in this support range will determine whether a mid-term reversal can begin or if the macro downtrend continues.
---
Pattern & Structure Analysis
Main trend: Bearish, with continuous lower highs and lower lows.
Yellow block (0.405–0.476): Key historical demand zone that previously triggered strong accumulation.
Long wick below: Possible false breakdown or stop hunt, indicating liquidity absorption.
Potential setup: Early formation of a double-bottom pattern if price holds above 0.405 and reclaims higher resistance.
---
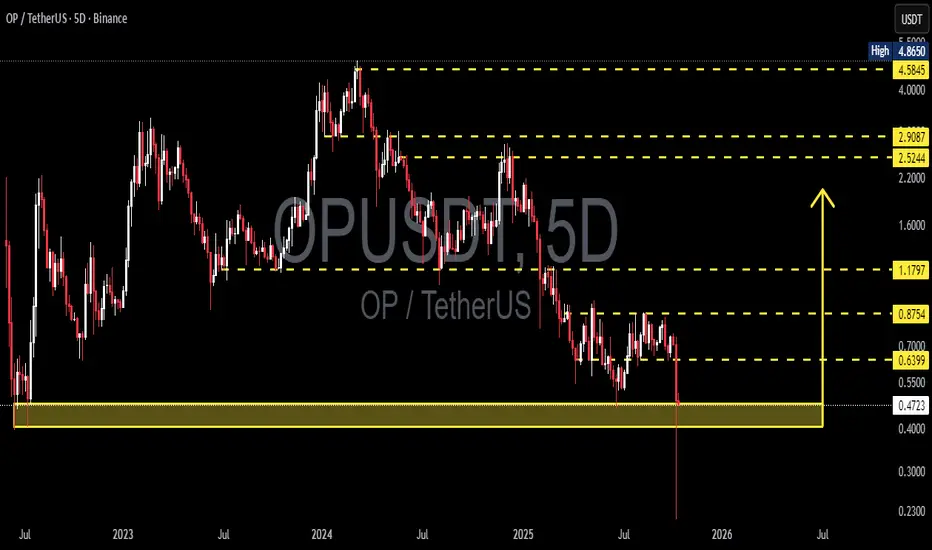
Bullish Scenario
If price strongly bounces from 0.405–0.476 and successfully closes above 0.6399 (5D timeframe), it could confirm the start of a mid-term reversal.
Initial target: 0.8754
Next target: 1.1797
Bullish confirmation: 5D close above 0.6399 with rising volume.
Invalidation: 5D close below 0.405.
This zone offers potential accumulation for swing traders, but confirmation from volume and structure is essential before committing.
---
Bearish Scenario
If OP fails to hold 0.405 and closes below this support zone, the bearish momentum will likely accelerate.
First target: 0.23 (previous liquidity sweep low).
Bearish confirmation: 5D close below 0.405 with strong selling volume.
Invalidation: 5D reclaim above 0.6399.
A clean breakdown would confirm a continuation of the macro downtrend, signaling a deeper capitulation phase.
---
Market Narrative
The 0.405–0.476 zone is where buyers and sellers face their final test.
This is the battlefield between smart money accumulation and bearish momentum exhaustion.
A strong bullish reaction here could indicate that smart money is stepping in, while a failure to hold could lead to the final flush before a long consolidation phase.
This is the zone that will define whether OP finds its true bottom or enters another leg down.
---
Technical Summary
Support zone: 0.405–0.476
Nearest resistance: 0.6399
Bullish targets: 0.8754 → 1.1797
Bearish target: 0.23
Main trend: Bearish
Timeframe: 5D (mid-term outlook)
---
#OP #Optimism #OPUSDT #CryptoAnalysis #TechnicalAnalysis #PriceAction #SupportAndResistance #CryptoTrading #MarketStructure #SupplyDemand #CryptoOutlook #BullishScenario #BearishScenario #AltcoinAnalysis
Good moment for buy OPGood moment for buy OP. We are long time in the flat channel and now, I think, the moment for brake it up. This is good moment for buy with good risk\reward ratio. The stop below previous local low. Will see...
OP/USDT — Major Accumulation Zone: Larger Move is in the Making?
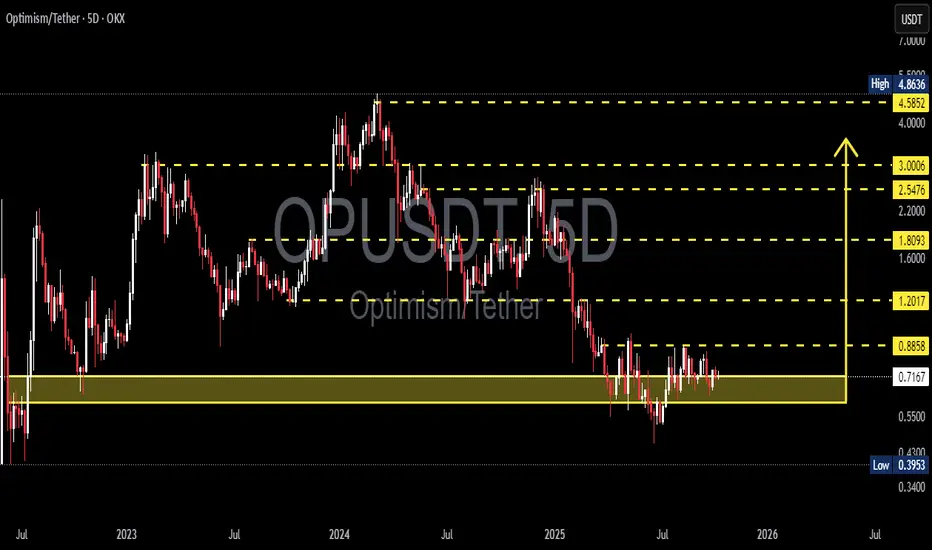
Optimism (OP) is currently consolidating within a major accumulation zone between 0.72–0.60, which has acted as a key macro support since the sharp decline from the 4.8–5.0 peak.
This range represents a crucial battleground between buyers and sellers — where selling pressure is fading and early signs of base formation are emerging.
---
Technical Structure
Current Phase: Sideways consolidation after a prolonged downtrend.
Yellow Zone (0.72–0.60): Strong demand area and macro support tested multiple times.
Key Resistance: 0.8858 — the upper boundary of the range that will define the next major direction.
Potential Pattern: Developing rectangle accumulation or rounded bottom base above demand.
Volume Behavior: Decreasing gradually, indicating quiet accumulation by long-term players (smart money phase).
---
Bullish Scenario
A confirmed breakout and close above 0.8858 would mark the end of accumulation and the start of a potential mid-term uptrend.
Projected upside targets:
1.20 → breakout validation zone
1.80 → main swing target
2.55 – 3.00 → mid-term expansion target if momentum continues
Additional confirmations:
Rising volume during breakout.
Successful retest of 0.8858 as new support.
Formation of higher lows above 0.72.
> “Reclaiming 0.8858 could transform this quiet range into the ignition point of a new bullish phase.”
---
Bearish Scenario
If the price closes below 0.60, the accumulation structure would fail and likely lead to a macro continuation to the downside.
Downside targets:
0.50 – 0.45 → minor support
0.3953 → major historical low and potential capitulation zone
Such a breakdown would confirm renewed selling dominance and a possible search for a new long-term bottom.
---
Conclusion
The 0.72–0.60 range is the critical decision zone for OP’s next major move.
As long as the price holds above this level, the bias remains neutral-to-bullish, supported by signs of accumulation.
A breakout above 0.8858 could mark the beginning of a new uptrend, while a breakdown below 0.60 would signal continuation of the broader downtrend.
> “Calm ranges like this often precede explosive moves — and OP is quietly building the foundation for one.”
---
#Optimism #OPUSDT #CryptoAnalysis #SwingTrading #TechnicalAnalysis #AccumulationZone #BreakoutSetup #Altcoins #CryptoMarket #Layer2 #PriceAction
OP Looks Bullish (6H)Based on the structure that OP has formed on the chart, it appears to be in a reaccumulation phase. It seems we are approaching the end of this phase.
Two entry zones have been identified for this asset, and we will enter gradually (in steps) within each zone.
Targets are marked on the chart.
A daily candle closing below the invalidation level will invalidate this setup.
For risk management, please don't forget stop loss and capital management
When we reach the first target, save some profit and then change the stop to entry
Comment if you have any questions
Thank You

[OPUSDT] Waiting for Breakout WaveIt is clear that OP has formed a round bottom and is now approaching resistance at 0.83. With market volume still increasing, I expect OP to break this resistance soon.
In case OP rejects the resistance, I believe it won’t take long before a breakout occurs, as the price is reaching the end of the round bottom formation. I have already entered a buy position at this level.
This analysis is for reference only and should not be considered financial advice.

OP Market Update📊 NASDAQ:OP Market Update
NASDAQ:OP has broken out of the red resistance zone 🔴✅
👉 Now it’s approaching the first target at the green line 🎯
👉 If momentum continues, the second target is at the blue line 📈
⚡ Manage your trade and trail stop-loss as price moves.
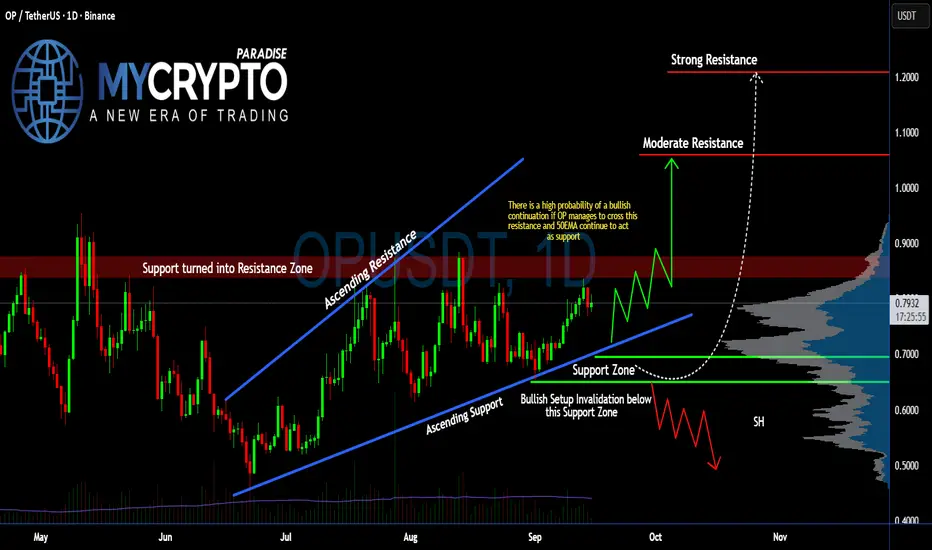
Will #OP Finally Explode or Is This Just Another Trap for Bulls?Yello, Paradisers! Is #Optimism gearing up for a breakout, or is this the final squeeze before bulls get dumped on hard? Let’s dissect what’s really happening on #OPUSDT:
💎After forming a clean ascending channel since mid-June, #OP has been respecting both the ascending support and ascending resistance zones. Price is currently sitting just below the key resistance zone around $0.83–$0.85, which was previously a support level before flipping into strong resistance. This makes it a major decision point for the next move.
💎If #OPUSD manages to break and close above the $0.85 resistance area with strong volume, and the 50EMA continues to hold as dynamic support, then we’re likely to see a push towards the moderate resistance around $1.059. If that level is cleared, the next logical upside target sits near $1.20, aligning with the strong resistance and peak on the volume profile.
💎As long as price holds above the Support Zone between $0.69 and $0.65, the bullish case remains valid. The structure continues to print higher lows, showing that buyers are defending the trendline support. A successful retest here could lead to a powerful bullish continuation.
💎However, if bulls lose control and #OPUSDT closes below the $0.650 support, the entire bullish setup would be invalidated. In that case, price could slide down toward the $0.50–$0.55 zone, especially if volume dries up. This would complete a potential head-and-shoulders pattern and trigger a shift toward a bearish structure.
Stay patient, Paradisers. Let the breakout confirm, and only then do we strike with conviction.
MyCryptoParadise
iFeel the success🌴
OP Secondary trend. Wedge. Reversal zones. 17 04 2025From the wedge breakout, the price reached the level of 2.857 (81%) and from it the trend reversal under the general trend of altcoins, breaking through the "neck" zone of the head and shoulders, thereby realizing this pattern on a large scale and reaching the reversal zone of the minimums of the level of 0.509. We went down to the range below along the fan. Consolidation above the dynamic support opens up the potential for movement to its resistance, I specifically put another meridian, as from it with a high degree of probability, even with the implementation of the bullish potential, there will be a significant pump / dump rollback. It just intersects with the previous consolidation of support, which in this case acts as resistance (those who previously bought in this zone will sell, thereby going into breakeven and stimulating the stop of the impulse and a rollback (logical probability).
Locally, again having formed on the fall, as before, a descending wedge in the secondary trend. It has not yet been fully formed, the price is not clamped. But, conditionally, the price is at the minimum zone. You can start gaining from the average price, or work on a breakthrough of the formation, observing risk and money management. If you are scared (it is always like this at the minimum zone) - then everyone is the same, and most refuse to buy, but willingly buy when the price is already expensive.
A breakthrough of this wedge is a corrective upward movement to the mirror resistance zone of the previous consolidation (highlighted in gray), if in general, a "revival of faith" is observed in alts.
Also after breakout of the wedge, if the market as a whole is bearish on alts, then they will make a cut (in this case, a repeated set) at the zone of minimums in a wide range of price slippage and the complete death of faith in the candy wrapper of "crypto whales", highlighted in green.

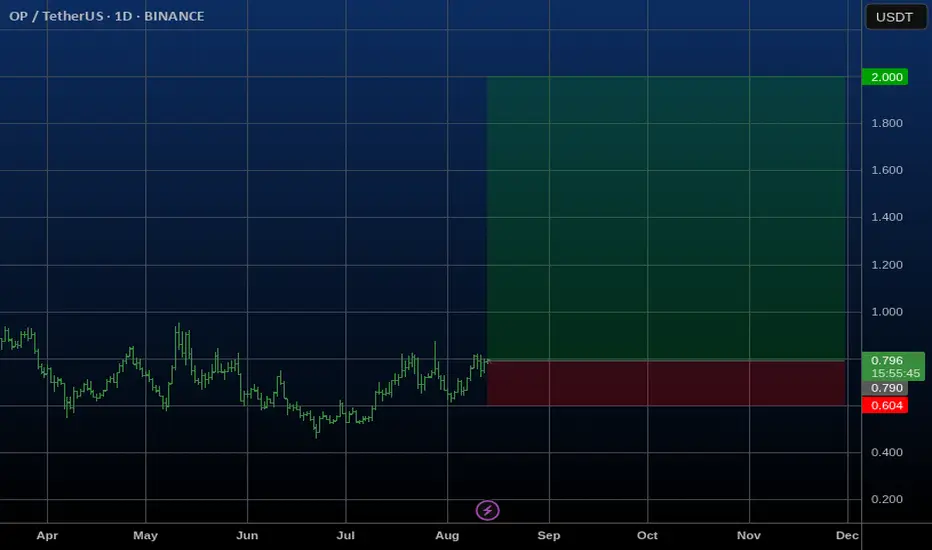
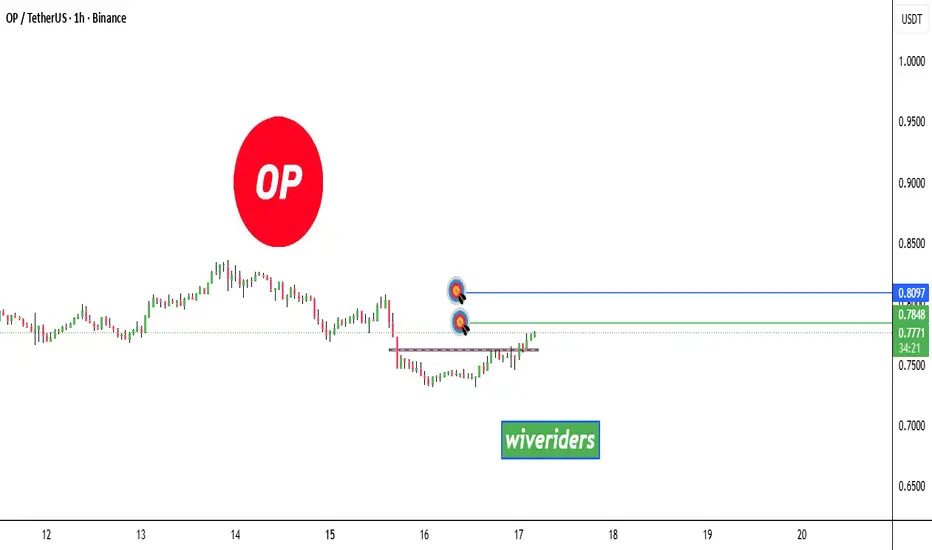
Buy Alert OP (Optimism) - August 27, 2025.NASDAQ:OP #Optimism 🩸 — Investors - Tier 1 | Optimism is a low-cost and lightning-fast Ethereum L2 blockchain | August 27, 2025.
We've analyzed the data on the cryptocurrency Optimism and concluded that now is an excellent entry point for a Spot position, with a potential upside of +22% from $0.70 to $0.86.
🚀 Why?
➖ 1. Limit Order on Coinbase: A major player has placed a limit sell order on the crypto exchange Coinbase at $0.86.
➖ 2. Liquidation Max Pain: For Optimism, the Max Pain level is at $0.8901, with the imbalance favoring short traders. Market makers will push the price upward to liquidate those positions, while limit orders above help large players secure their profits.
➖ 3. Chart Analysis: On the chart, we can see how the bullish candle from August 22, 2025, was engulfed, collecting stop-losses from long traders. This is a common manipulation tactic by big players to shake out as many leveraged positions as possible.
➖ 4. Altcoin Trend Shift: The trend for altcoins is gradually shifting from sideways accumulation to aggressive buildup and a growth phase (in other words, liquidations are being harvested on both sides right now, with a large player accumulating for an aggressive surge in Optimism's price—I suspect altseason could kick off in the coming months, though that word has become almost a curse 🙃).
In Summary:
We anticipate Optimism's rise from $0.70 to $0.86 (+22%) in the near term. Avoid leverage—stick to Spot positions only. After this upmove, expect a pullback to around $0.62, where you can build your core portfolio position and wait for altseason.

OP - Bullish structure medium term NASDAQ:OP - Inverse H&S structure spotted - Bullish medium term 📈
Pump potential:
70%+ 🚀
Key demand zone to be maintained:
0.6300 - 0.6150$
Weekly resistances;
0.8150 - 0.9250 - 1.060 - 1.00 - |1.180 - 1.20| - 1.380 - 1.600$

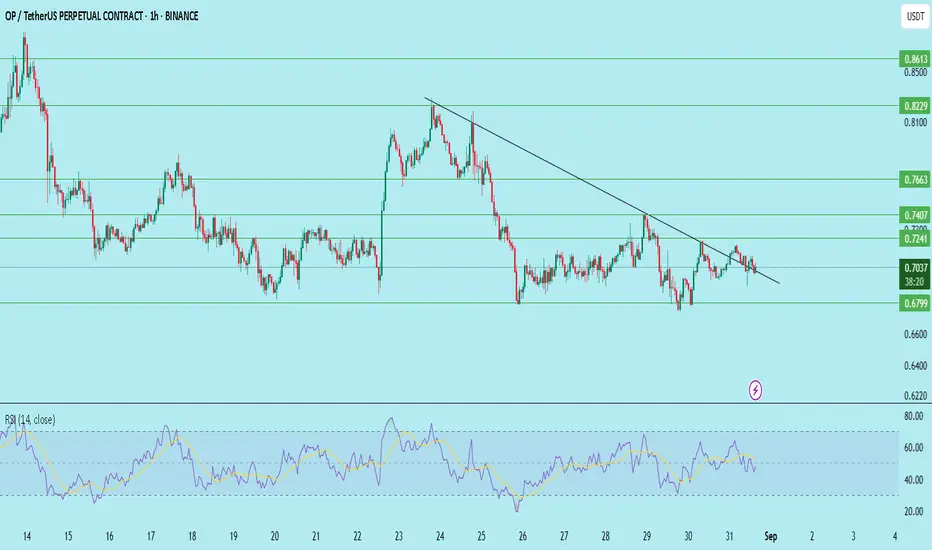
OP/USDT Accumulation in Progress !!Currently, OP is testing the descending trendline while holding above the demand zone at 0.6860–0.6721. RSI sits near neutral (49), suggesting that the next move could determine whether the breakout occurs or further downside is seen.
Trade Plan (Long Setup):
Entry Zone: CMP (0.7050) → down to 0.6860
Stop Loss: 0.6721 (below demand zone)
Targets:
0.7240
0.7407
0.7663
0.8229
Expected Profit: ~16% to the extended target
Insights:
Break above 0.7240 confirms bullish continuation.
Losing 0.6721 invalidates the setup, opening downside risk.
RSI divergence is possible if the price retests 0.6860 and bounces strongly.
DYOR | Not Financial Advice
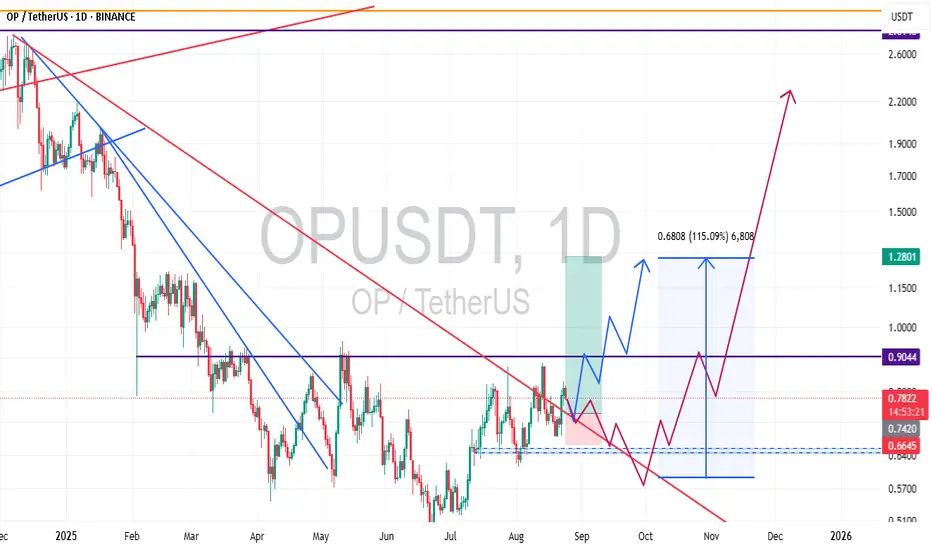
crypto pair opusdt Greetings dear friends
I have two predictions for the OP currency that you see in the picture
I hope they come true and friends will use them
OP Breakout Alert!🚨 NASDAQ:OP Breakout Alert! 🚨
NASDAQ:OP is currently testing the red resistance zone 🔴
If price breaks out, the first target will be the green line level 🎯
A confirmed breakout would signal bullish continuation and open the door for further upside ✅
