#OP/USDT – Triangle Pattern Breakout Loading?#OP
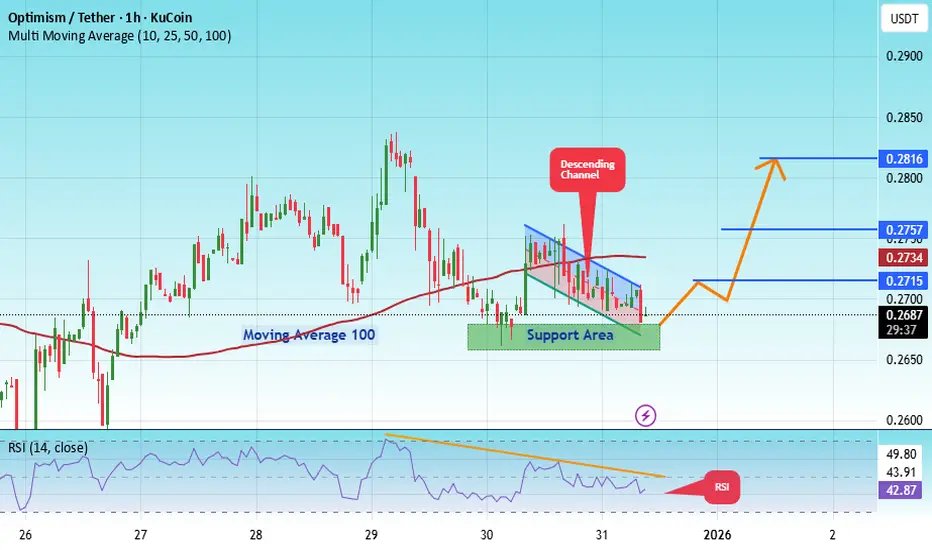
The price is moving in a descending channel on the 1-hour timeframe. It has reached the lower boundary and is heading towards breaking above it, with a retest of the upper boundary expected.
We have a downtrend on the RSI indicator, which has reached near the lower boundary, and an upward rebound is expected.
There is a key support zone in green at 0.2660. The price has bounced from this zone multiple times and is expected to bounce again.
We have a trend towards consolidation above the 100-period moving average, as we are moving close to it, which supports the upward movement.
Entry price: 0.2693
First target: 0.2715
Second target: 0.2757
Third target: 0.2816
Stop loss: Below the support zone in green.
Don't forget a simple thing: capital management.
For inquiries, please leave a comment.
Thank you.
Opusdtlong
#OP/USDT – Triangle Pattern Breakout Loading?#OP
The price is moving in a descending channel on the 1-hour timeframe. It has reached the lower boundary and is heading towards breaking above it, with a retest of the upper boundary expected.
We have a downtrend on the RSI indicator, which has reached near the lower boundary, and an upward rebound is expected.
There is a key support zone in green at 0.2559. The price has bounced from this zone multiple times and is expected to bounce again.
We have a trend towards consolidation above the 100-period moving average, as we are moving close to it, which supports the upward movement.
Entry price: 0.2624
First target: 0.2668
Second target: 0.2772
Third target: 0.2888
Don't forget a simple principle: money management.
Place your stop-loss order below the support zone in green.
For any questions, please leave a comment.
Thank you.

#OP/USDT Ready to launch upwards#OP
The price is moving in a descending channel on the 1-hour timeframe. It has reached the lower boundary and is heading towards breaking above it, with a retest of the upper boundary expected.
We have a downtrend on the RSI indicator, which has reached near the lower boundary, and an upward rebound is expected.
There is a key support zone in green at 0.3230. The price has bounced from this level multiple times and is expected to bounce again.
We have a trend towards consolidation above the 100-period moving average, as we are moving close to it, which supports the upward movement.
Entry price: 0.3300
First target: 0.3352
Second target: 0.3456
Third target: 0.3576
Don't forget a simple principle: money management.
Place your stop-loss order below the support zone in green.
For any questions, please leave a comment.
Thank you.

Optimism one the good opportunity Hi Everyone;
today we have one of the best risk to reward Investment opportunity
it is more than 80 times the risk and the chart is look very promising.
I expect breaking the previous bear market key point will clear the way to the final target.

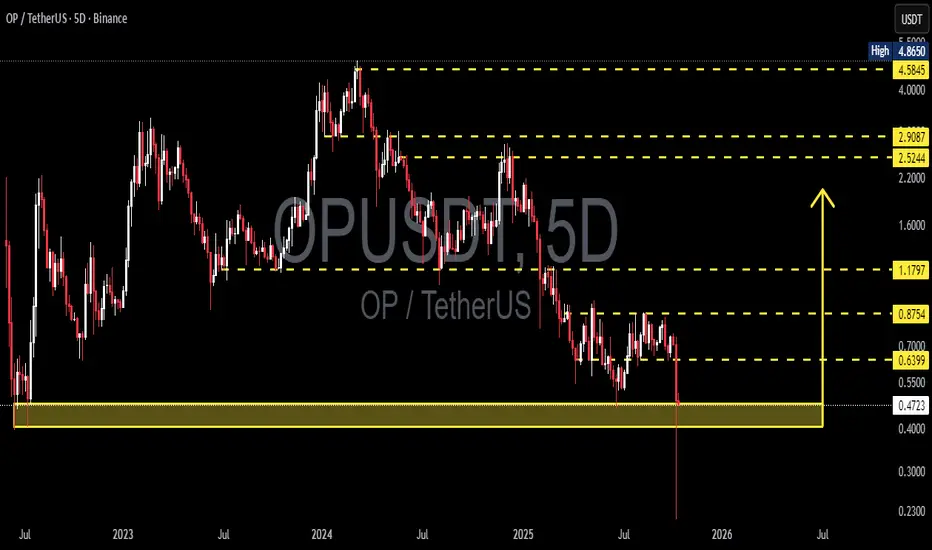
OP/USDT – On the Edge of Reversal or Final Breakdown?Optimism (OP) is standing at a critical crossroads after a long and steady downtrend that has persisted since mid-2024.
Price is now testing the major support zone between 0.405–0.476 (yellow block) — a historical demand area that once marked the beginning of a major rally in the past.
The deep wick below this area indicates a liquidity sweep, suggesting that larger players may have flushed out retail stop-losses before positioning for the next major move.
This zone is not just a number — it represents the psychological line between capitulation and accumulation.
While the macro structure still shows lower highs and lower lows, the reaction in this support range will determine whether a mid-term reversal can begin or if the macro downtrend continues.
---
Pattern & Structure Analysis
Main trend: Bearish, with continuous lower highs and lower lows.
Yellow block (0.405–0.476): Key historical demand zone that previously triggered strong accumulation.
Long wick below: Possible false breakdown or stop hunt, indicating liquidity absorption.
Potential setup: Early formation of a double-bottom pattern if price holds above 0.405 and reclaims higher resistance.
---
Bullish Scenario
If price strongly bounces from 0.405–0.476 and successfully closes above 0.6399 (5D timeframe), it could confirm the start of a mid-term reversal.
Initial target: 0.8754
Next target: 1.1797
Bullish confirmation: 5D close above 0.6399 with rising volume.
Invalidation: 5D close below 0.405.
This zone offers potential accumulation for swing traders, but confirmation from volume and structure is essential before committing.
---
Bearish Scenario
If OP fails to hold 0.405 and closes below this support zone, the bearish momentum will likely accelerate.
First target: 0.23 (previous liquidity sweep low).
Bearish confirmation: 5D close below 0.405 with strong selling volume.
Invalidation: 5D reclaim above 0.6399.
A clean breakdown would confirm a continuation of the macro downtrend, signaling a deeper capitulation phase.
---
Market Narrative
The 0.405–0.476 zone is where buyers and sellers face their final test.
This is the battlefield between smart money accumulation and bearish momentum exhaustion.
A strong bullish reaction here could indicate that smart money is stepping in, while a failure to hold could lead to the final flush before a long consolidation phase.
This is the zone that will define whether OP finds its true bottom or enters another leg down.
---
Technical Summary
Support zone: 0.405–0.476
Nearest resistance: 0.6399
Bullish targets: 0.8754 → 1.1797
Bearish target: 0.23
Main trend: Bearish
Timeframe: 5D (mid-term outlook)
---
#OP #Optimism #OPUSDT #CryptoAnalysis #TechnicalAnalysis #PriceAction #SupportAndResistance #CryptoTrading #MarketStructure #SupplyDemand #CryptoOutlook #BullishScenario #BearishScenario #AltcoinAnalysis
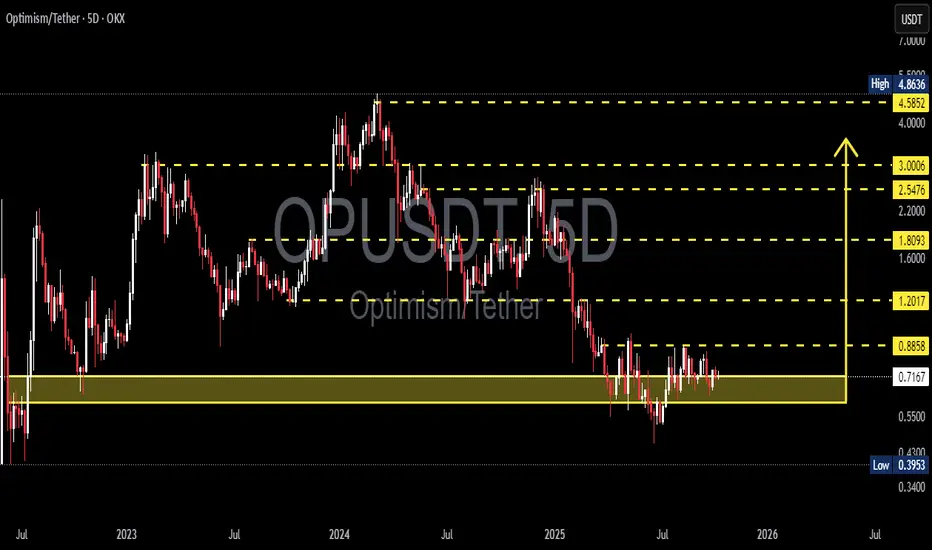
OP/USDT — Major Accumulation Zone: Larger Move is in the Making?
Optimism (OP) is currently consolidating within a major accumulation zone between 0.72–0.60, which has acted as a key macro support since the sharp decline from the 4.8–5.0 peak.
This range represents a crucial battleground between buyers and sellers — where selling pressure is fading and early signs of base formation are emerging.
---
Technical Structure
Current Phase: Sideways consolidation after a prolonged downtrend.
Yellow Zone (0.72–0.60): Strong demand area and macro support tested multiple times.
Key Resistance: 0.8858 — the upper boundary of the range that will define the next major direction.
Potential Pattern: Developing rectangle accumulation or rounded bottom base above demand.
Volume Behavior: Decreasing gradually, indicating quiet accumulation by long-term players (smart money phase).
---
Bullish Scenario
A confirmed breakout and close above 0.8858 would mark the end of accumulation and the start of a potential mid-term uptrend.
Projected upside targets:
1.20 → breakout validation zone
1.80 → main swing target
2.55 – 3.00 → mid-term expansion target if momentum continues
Additional confirmations:
Rising volume during breakout.
Successful retest of 0.8858 as new support.
Formation of higher lows above 0.72.
> “Reclaiming 0.8858 could transform this quiet range into the ignition point of a new bullish phase.”
---
Bearish Scenario
If the price closes below 0.60, the accumulation structure would fail and likely lead to a macro continuation to the downside.
Downside targets:
0.50 – 0.45 → minor support
0.3953 → major historical low and potential capitulation zone
Such a breakdown would confirm renewed selling dominance and a possible search for a new long-term bottom.
---
Conclusion
The 0.72–0.60 range is the critical decision zone for OP’s next major move.
As long as the price holds above this level, the bias remains neutral-to-bullish, supported by signs of accumulation.
A breakout above 0.8858 could mark the beginning of a new uptrend, while a breakdown below 0.60 would signal continuation of the broader downtrend.
> “Calm ranges like this often precede explosive moves — and OP is quietly building the foundation for one.”
---
#Optimism #OPUSDT #CryptoAnalysis #SwingTrading #TechnicalAnalysis #AccumulationZone #BreakoutSetup #Altcoins #CryptoMarket #Layer2 #PriceAction
[OPUSDT] Waiting for Breakout WaveIt is clear that OP has formed a round bottom and is now approaching resistance at 0.83. With market volume still increasing, I expect OP to break this resistance soon.
In case OP rejects the resistance, I believe it won’t take long before a breakout occurs, as the price is reaching the end of the round bottom formation. I have already entered a buy position at this level.
This analysis is for reference only and should not be considered financial advice.

OP - following the plan! NASDAQ:OP - following the plan nicely 📈
1000% accuracy since almost 1 week 🔥

#OP/USDT#OP
The price is moving within a descending channel on the 1-hour frame, adhering well to it, and is heading for a strong breakout and retest.
We are seeing a bounce from the lower boundary of the descending channel, which is support at 0.653.
We have a downtrend on the RSI indicator that is about to be broken and retested, supporting the upward trend.
We are looking for stability above the 100 moving average.
Entry price: 0.702
First target: 0.757
Second target: 0.805
Third target: 0.865

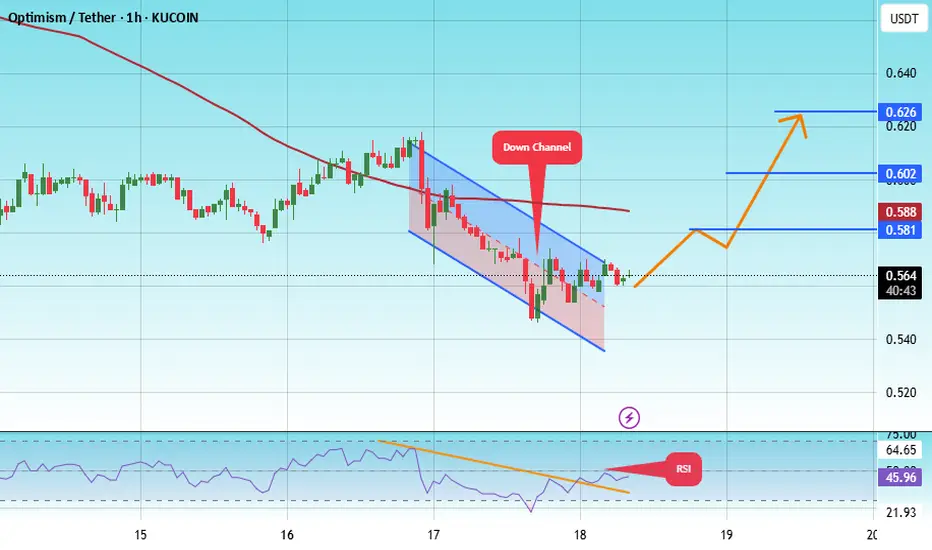
#OP/USDT#OP
The price is moving within a descending channel on the 1-hour frame, adhering well to it, and is heading toward a strong breakout and retest.
We are experiencing a rebound from the lower boundary of the descending channel. This support is at 0.544.
We have a downtrend on the RSI indicator that is about to be broken and retested, supporting the upward trend.
We are heading toward stability above the 100 moving average.
Entry price: 0.564
First target: 0.581
Second target: 0.602
Third target: 0.626
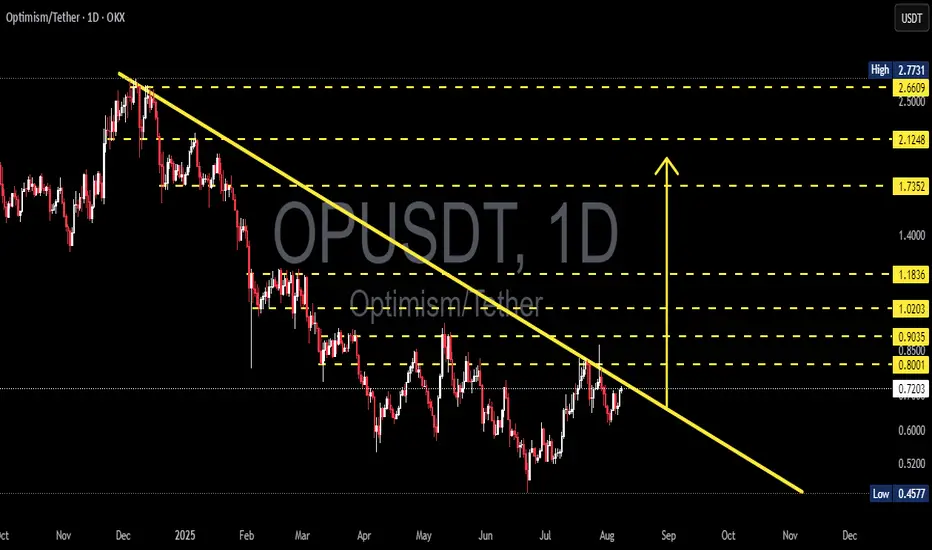
OP/USDT Technical Analysis – Approaching a Major Breakout Zone!Chart Overview: The OP/USDT pair on the 1D (Daily) timeframe is currently moving within a long-term descending trendline, forming a descending triangle or falling resistance channel since November 2024. The price is now approaching a critical point near the long-term resistance trendline (yellow line), which has been tested multiple times.
---
🟢 Bullish Scenario: Breakout Potential
If the price manages to break and close above the descending trendline resistance (currently near the $0.80–$0.85 zone), it would signal a strong bullish breakout. The next key resistance levels to watch (based on yellow dotted horizontal lines) are:
1. $0.9035 – minor resistance
2. $1.0203 – psychological level
3. $1.1836 – mid-term strong resistance
4. $1.7352 and $2.1248 – extended bullish targets
A confirmed breakout would ideally be supported by increasing volume and RSI momentum above 50.
---
🔴 Bearish Scenario: Rejection at Resistance
If the price fails to break the trendline and gets rejected, a downside move is likely to follow. Key support levels to watch are:
1. $0.7200 – current support
2. $0.6000 – minor support
3. $0.4577 – strong historical support (lowest level)
This would suggest continued bearish control and could extend the downtrend that has lasted over 8 months.
---
📊 Pattern Breakdown: Descending Trendline
Consistent lower highs since the peak near $2.77
The descending trendline is the main battle zone between bulls and bears
This pattern often leads to a breakout if buyers gain momentum
---
🎯 Conclusion & Strategy:
This is a critical zone for OP/USDT.
Traders should wait for breakout confirmation before entering long positions.
For breakout traders: consider a buy-the-breakout strategy with stop-loss below the trendline.
For short sellers: look for a rejection at resistance with targets at the nearest support levels.
#OPUSDT #CryptoAnalysis #Altcoins #TechnicalAnalysis #BreakoutTrade #Optimism #CryptoSetup #BullishScenario #BearishScenario #ChartPatterns
OPUSDT Update
Symbol: OP/USDT
Timeframe: Daily
Chart Analysis:
The price is currently approaching a key resistance zone at around 0.673, as seen in the chart. A descending trendline from May to June has been acting as resistance. The price has recently made a strong move towards this resistance zone, showing a potential breakout pattern.
If the price successfully breaks above the 0.673 resistance, we could see a bullish continuation towards the next resistance levels, potentially up to 0.700 or higher. The breakout would suggest a reversal of the prior downtrend.
Key Levels:
* Resistance: 0.673 (current resistance zone)
* Support: 0.600 (lower support area)
Trade Strategy:
1. Long Entry: Consider entering a long position if the price breaks above the 0.673 resistance with strong volume.
2. Target: A reasonable target could be the 0.700 region. Keep an eye on price action as it approaches this level.
3. Stop Loss: Place a stop loss below the 0.600 support to manage risk in case of a failed breakout.
Risk-Reward: A potential reward-to-risk ratio of 2:1 or better, depending on entry and exit points.
Conclusion:
Monitor the price closely for a breakout above the 0.673 level. If it breaks and sustains, a bullish move could follow. Watch for volume confirmation and market momentum to gauge the strength of the breakout.

OPUSDT Forming Falling ChannelOPUSDT is currently exhibiting a promising setup that could lead to a significant bullish move. The chart shows that the price has broken out of a well-defined falling channel pattern, which often signals the end of a correction phase and the beginning of a potential uptrend. With the breakout confirmed and good volume supporting this move, there is a strong possibility of a 90% to 100% gain in the coming sessions, drawing the attention of traders looking for breakout plays.
Optimism (OP) has been a hot topic within the crypto community due to its role in scaling Ethereum through its layer 2 solution. The consistent development and growing adoption of the Optimism network have sparked investor interest, providing a fundamental backdrop that complements the bullish technical signals. Many traders see this breakout as an opportunity to get in early on a potential recovery rally.
The current price action suggests that OPUSDT may continue its upward trajectory if buying pressure remains strong and key resistance levels are cleared convincingly. Traders should watch for sustained volume spikes and possible retests of the breakout level, which can offer more confidence in the continuation of the bullish momentum. As always, risk management is essential when navigating such moves.
✅ Show your support by hitting the like button and
✅ Leaving a comment below! (What is You opinion about this Coin)
Your feedback and engagement keep me inspired to share more insightful market analysis with you!

OP/USDT Weekly Reversal Zone: Strong Bounce ExpectedThe OP/USDT pair is currently showing strong signs of a potential trend reversal from a major long-term demand zone.
📊 Timeframe: 1W (Weekly)
🟨 Key Support Zone: 0.396 – 0.542 USDT
The price has revisited a historically strong support area that previously served as an accumulation zone since mid-2022. The recent bounce from this level reinforces the likelihood of a bullish reversal.
📈 Upside Targets (Resistance Levels):
1. Minor Resistances:
0.699
0.844
2. Mid-Term Target:
1.190 (key breakout confirmation level)
3. Long-Term Bullish Targets:
2.168
2.400
2.700
2.991
3.725
4.020
4.538
4.865 (Previous major high)
🛡️ Critical Demand Zone:
As long as price holds above the 0.396–0.542 range, bullish structure remains intact. A breakdown below this range could invalidate the setup.
🔄 Outlook:
The chart pattern suggests the formation of a higher low and a potential breakout in stages, supported by volume and positive sentiment. Watch the 0.699 and 0.844 levels for initial confirmation of buyer strength.
📌 Note:
This setup offers an attractive risk-reward ratio for mid to long-term traders watching for a trend reversal.

OPUSDT 1W AnalysisOP ~ 1W Analysis
#OP Buy back gradually from here, this is the lowest support block for now with a short term target of at least 20%+ from here.

OPUSDT 1D AnalysisOP ~ 1D Analysis
#OP Buy in stages from here with a short term target of at least 15%+ and a long term target of $2.7

#OP/USDT#OP
The price is moving within a descending channel on the 1-hour frame and is expected to continue upward.
We have a trend to stabilize above the 100 moving average once again.
We have a downtrend on the RSI indicator, which supports the upward move by breaking it upward.
We have a support area at the lower limit of the channel at 0.817.
Entry price: 0.860
First target: 0.891
Second target: 0.916
Third target: 0.950

OPUSDT 1D AnalysisOP ~ 1D Analysis
#OP Buy after successfully penetrating this resistant line with a short -term target of at least 15%+ from here.

OPUSDT 3D AnalysisOP ~ 3D Analysis
#OP Buy gradually from here if you still have a Conviction on this coin with a short -term target of at least 15%+ from here.

OPUSDT 4DOP ~ 4D Analysis
#OP Place two purchases at this support level, with a short -term target of at least 20%+.
This is a key support that needs attention.

#OP/USDT#OP
The price is moving in a descending channel on the 1-hour frame and is adhering to it well and is heading to break it strongly upwards and retest it
We have a bounce from the lower limit of the descending channel, this support is at a price of 0.834
We have a downtrend on the RSI indicator that is about to be broken and retested, which supports the rise
We have a trend to stabilize above the moving average 100
Entry price 0.909
First target 0.939
Second target 0.992
Third target 1.054

OP / USDT: Gearing up for a breakout above Trendline resistance OP/USDT: Gearing Up for a Breakout Above Trendline Resistance
OP/USDT is shaping up for an exciting move 📈 as it approaches a critical trendline resistance zone 📊. The price has been consolidating tightly, creating the perfect setup for a potential breakout 💥. If the breakout happens, we could see a strong bullish trend unfold 🚀. Keep a close eye 👀 on this pair and wait for confirmation before acting.
Key insights:
1. Trendline resistance: OP/USDT is approaching a long-standing trendline that has previously acted as a barrier. A break above this could mark the start of a strong upward move.
2. Volume surge: Watch for a significant increase in trading volume during the breakout to confirm buyer strength 🔥.
3. Bullish signals: Momentum indicators like RSI and MACD are trending positively ⚡, supporting the case for a bullish breakout.
Steps to confirm the breakout:
Look for a clear 4H or daily candle closing above the trendline 📍.
A noticeable spike in volume during the breakout can signal strong buying activity 📊.
A retest of the broken resistance as a new support zone adds credibility to the move ✅.
Be cautious of fake breakouts, such as sharp reversals or wicks above the trendline ⚠️.
Risk management strategies:
Use stop-loss orders to manage your risk effectively 🔒.
Ensure position sizing aligns with your overall trading strategy 🎯.
This analysis is for educational purposes only and not financial advice. Always conduct your own research (DYOR) 🔍 before making investment decisions.

Analysis of OPUSDT Perpetual Swap (4H - OKX)Analysis of OPUSDT Perpetual Swap (4H - OKX)
1. Trend Analysis
Bearish Momentum Continues:
Price remains below EMA 50, EMA 100, and EMA 200, indicating a strong downtrend.
Multiple sell signals confirm continued selling pressure.
The price is hovering near the lower part of the structure, meaning it is still searching for strong support.
Potential Oversold Conditions:
The Stochastic RSI is at an extreme level, suggesting the market could be oversold and a short-term bounce may occur.
However, until a clear reversal pattern forms, the trend remains bearish.
2. Key Resistance Levels (Supply Zones)
🔴 Major Resistance Areas:
1.5030 USDT (EMA 50 Resistance & Fib 0.500 Zone):
If price bounces, this is the first major test for buyers.
1.6139 - 1.7025 USDT (EMA 100 & Fib 0.618 Zone):
A stronger resistance zone; if price reaches this level, expect potential selling pressure.
1.8999 - 1.9419 USDT (Fib 0.786 - 0.886 & EMA 200 Zone):
A critical area; breaking this would indicate a shift toward a bullish structure.
3. Key Support Levels (Demand Zones)
🟢 Crucial Support Areas:
1.4225 - 1.4335 USDT: Local support area; if this breaks, price could drop further.
1.3581 - 1.3150 USDT (Demand Zone & Entry Point):
This is a strong historical demand zone; if price reaches here, buyers might step in.
1.2850 USDT: A deeper support level, marking the last known major buying area before a potential larger breakdown.
4. Risks & Concerns
⚠️ Bearish Signals & Potential Risks:
Trend Still Bearish: Price is trading below all major EMAs, meaning any bounce could be a short-term retracement.
Weak Buying Volume: Without strong volume, even if price bounces, it may fail to sustain upward movement.
Possible Breakdown Below Support: If price breaks below 1.3150 USDT, further declines toward 1.2850 USDT are likely.
5. Trading Strategy
✅ Long Scenario (If Price Holds Support & Shows Strength):
Entry: If price bounces from 1.3150 - 1.3581 USDT (Demand Zone).
Target 1: 1.4335 - 1.5030 USDT (EMA 50 Resistance).
Target 2: 1.6139 - 1.7025 USDT (EMA 100 Resistance).
Stop-Loss: Below 1.2850 USDT to minimize downside risk.
✅ Short Scenario (If Price Rejected at Resistance):
Entry: If price reaches 1.5030 - 1.6139 USDT and shows weakness or rejection.
Target 1: 1.4225 USDT (Local Support).
Target 2: 1.3581 - 1.3150 USDT (Demand Zone Retest).
Stop-Loss: Above 1.7500 USDT to avoid getting trapped in a breakout.
6. Summary & Outlook
📌 OPUSDT remains in a strong downtrend, with support at 1.3150 - 1.3581 USDT.
📌 Key resistance levels are 1.5030 - 1.7025 USDT. If the price fails to break, expect continued downside.
📌 A bounce could lead to a short-term recovery, but bearish sentiment dominates.
📌 Trading Strategy: Wait for a confirmed bounce from support for long entries or short at key resistance levels.
🔎 Recommendation:
Monitor price action near 1.3150 USDT for a potential bounce.
If rejection happens at 1.5030 - 1.6139 USDT, consider shorting opportunities.
💬 Would you like a deeper breakdown of any specific area? 🚀📊
