ORCA/USDT — Symmetrical Triangle Apex: The Calm Before the Storm🔎 Chart Overview
ORCA/USDT has been forming a massive Symmetrical Triangle since early 2024. The pattern is defined by lower highs (gradual selling pressure) and higher lows (steady accumulation by buyers). This represents a phase of tight consolidation, and as the price approaches the apex, the probability of a strong impulsive move ahead increases dramatically.
Currently, the price trades around 2.41 USDT, right inside the demand zone at 2.3 – 2.6 (yellow box). This zone has acted as a critical support multiple times since 2024, making it the key battleground for the next directional move.
---
🔼 Bullish Scenario (Breakout)
Trigger: A confirmed 4D candle close above the descending trendline and reclaim of the 3.00 – 3.41 USDT zone.
Confirmation: A breakout accompanied by rising volume would signal strong bullish momentum.
Upside Targets:
🎯 3.41 (first key resistance)
🎯 5.20 (psychological level)
🎯 7.48 (historical resistance)
🎯 9.90 (ATH / ultimate mid-term target)
Invalidation: A breakdown and 4D close below 2.3 USDT would invalidate the bullish setup.
---
🔽 Bearish Scenario (Breakdown)
Trigger: A breakdown below the 2.3 – 2.6 demand zone and loss of the ascending trendline support.
Downside Targets:
🛑 1.60
🛑 0.90
🛑 0.42 (historical Low) if capitulation unfolds.
Invalidation: A swift reclaim above 2.3 – 2.6 and re-entry into the triangle structure.
---
📌 Pattern Implications
The Symmetrical Triangle is a neutral pattern, but once a breakout occurs near the apex, it often leads to powerful trending moves.
The closer the price gets to the apex, the less time remains before volatility spikes.
Volume expansion will be the most reliable confirmation to separate a genuine breakout from a fakeout.
---
🎯 Extra Insight
The 2.3 – 2.6 demand zone is more than just support — it’s a strategic accumulation area where buyers have consistently defended their ground.
Holding this zone and breaking the descending resistance could trigger a multi-month rally.
Conversely, losing this zone could push ORCA into a capitulation phase before the next major cycle begins.
#ORCA #ORCAUSDT #Crypto #Altcoins #Breakout #PriceAction #TrianglePattern #TechnicalAnalysis #BullishScenario #BearishScenario
Orcausdtperp

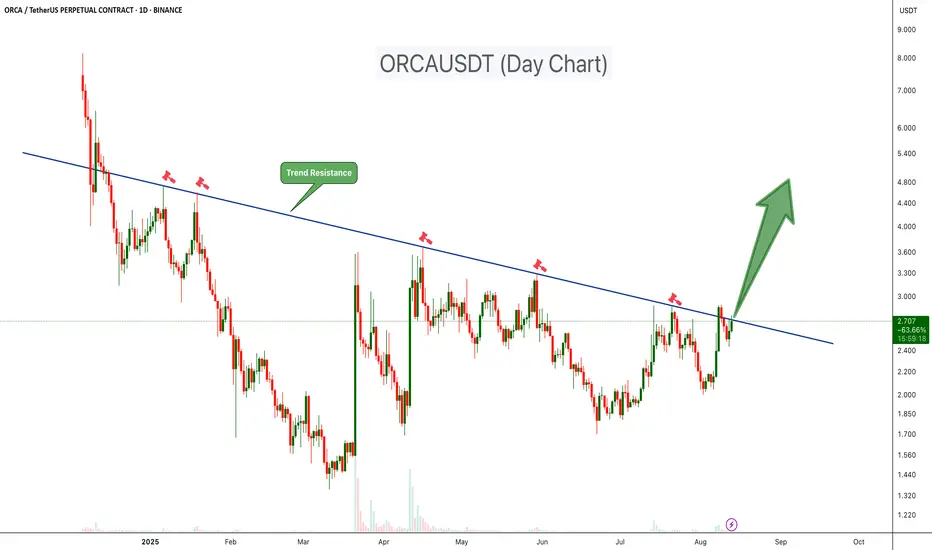
ORCAUSDT at Key Trendline: Big Move Loading!ORCAUSDT has been trading under a clear descending trendline resistance since late 2024, with multiple failed breakout attempts marked by sharp rejections. This trendline has consistently acted as a strong supply zone, pushing prices lower each time it was tested.
Key Points:
-Trend Resistance: Price is once again testing the long-term descending trendline. This level has rejected rallies multiple times in the past (January, March, May, and early August 2025).
-Volume Pickup: Recent price action shows increasing bullish volume, suggesting growing buying pressure as the resistance level is approached.
-Potential Breakout Setup: A strong daily close above $2.90 could signal a confirmed breakout, flipping long-term resistance into support.
Upside Target: If a breakout is confirmed, we could expect a 50%-200% move coming weeks
Risk Factor: A rejection from this zone could see price revisit support at $2.20–$2.00 before any renewed attempt higher.
Buy Level: Above $2.90 (After daily breakout)
ORCA is at a crucial decision point. This is the fifth test of the descending trendline since early 2025; a breakout now could trigger a significant bullish move, while another rejection may extend the consolidation phase.
Cheers
Hexa