ORDI/USDT Final Support Zone — Reversal or Bearish Continuation?ORDI/USDT on the 3D timeframe remains in a medium-to-long-term bearish trend. Since peaking around $90–$97, price has consistently formed lower highs and lower lows, confirming strong seller dominance. Currently, price is trading near a major historical support zone after a sharp capitulation move.
---
Pattern & Technical Structure
1. Descending Trendline (Major Bearish Structure)
A well-defined descending trendline connecting multiple lower highs since late 2024.
As long as price remains below this trendline, the overall market structure stays bearish.
2. Bearish Continuation Formation
Step-by-step breakdown of key support levels:
$26.7 → $13.0 → $10.7 → $8.25
This structure indicates distribution and sustained selling pressure, not a healthy correction.
3. Potential Base Formation (Early Stage)
Price consolidation is visible around $4.75 – $5.90 with decreasing volatility.
This could be an early base formation, but no confirmed trend reversal yet.
---
Key Levels
Resistance Zones
$5.90 (minor resistance / previous breakdown level)
$8.25 (key supply zone)
$10.70 – $13.00 (major resistance cluster)
$26.70 (macro resistance)
Support Zones
$4.75 (current local support)
$3.80 – $4.00 (last demand zone)
A breakdown below this area could trigger further downside continuation.
---
Bullish Scenario
Price holds above $4.75 and forms a higher low.
A strong close above $5.90 signals early bullish momentum.
Strong confirmation comes with a breakout above the descending trendline, targeting:
$8.25
$10.70
$13.00
This scenario suggests a relief rally or early trend reversal, not a full bullish trend unless major resistance is reclaimed.
---
Bearish Scenario
Failure to hold above $4.75.
Strong breakdown toward $3.80 – $4.00.
Losing this zone would:
Confirm bearish continuation
Open the path for new lows
As long as price stays below the main trendline, bearish dominance remains intact.
---
Conclusion
ORDI/USDT is still in a primary bearish phase, but price is now trading in a critical decision zone. The $4.75 – $5.90 area acts as a key battle zone between buyers and sellers. Aggressive traders may watch for early reversal signals, while conservative traders should wait for confirmed trendline breakout before considering medium-term long positions.
---
#ORDI #ORDIUSDT #BRC20 #BitcoinEcosystem #CryptoTrading #TechnicalAnalysis #BearishMarket #TrendReversal #AltcoinAnalysis
Ordiusdt

ORDI / USDT : Short term setupORDI is trading near a key demand zone with potential for a 10–15% upside.
Using a two-entry plan to manage risk, with a possible secondary entry around $3.86–$3.75 if price dips.
Target remains near $4.52 as long as structure holds.
Patience and confirmation are key.
Not financial advice.

ORDI Weekly AnalysisORDI is currently trading at a major higher timeframe support zone after a prolonged downtrend.
This level has acted as support multiple times in the past, making it an important area to monitor for potential price reactions.
Market structure remains bearish on the higher timeframe, but downside momentum is slowing down and price is starting to consolidate.
Key levels to watch:
Support at the current range low
Resistance at the previous breakdown level
Higher timeframe resistance above, as marked on the chart
If price holds support and manages to reclaim resistance, continuation toward the next resistance levels becomes possible.
If price fails to hold support, consolidation or further downside cannot be ruled out.
This analysis is based on market structure and support and resistance levels.
No predictions, only scenarios.
All levels and scenarios are clearly marked on the chart.
Questions or comments are welcome in the comments below.
MrC

ORDIUSDT Forming Falling WedgeORDIUSDT is forming a clear falling wedge pattern, a classic bullish reversal signal that often indicates an upcoming breakout in crypto trading pairs like this one. The price has been consolidating within a narrowing range after a sharp downtrend, with recent lows around $7 suggesting that selling pressure is weakening while buyers are beginning to regain control near key support levels. With good volume confirming accumulation at these lower levels amid rising investor interest, the setup hints at a potential bullish breakout soon, especially as ORDI's ties to Bitcoin Ordinals and BRC-20 hype fuel renewed momentum. The projected move could lead to an impressive gain of 140% to 150%+ once the price breaks above the wedge resistance, turning recent corrections into explosive altcoin price action.
This falling wedge pattern is typically seen at the end of downtrends or corrective phases, and it represents a potential shift in market sentiment from bearish to bullish for ORDIUSDT. Traders closely watching this crypto pair are noting the strengthening momentum as it nears a breakout zone around $8.77, with technical indicators like RSI showing oversold bounces and fib retracement levels holding firm. The good trading volume adds confidence to this pattern, showing that market participants are positioning early in anticipation of a reversal, particularly with recent signals hitting take-profit targets and bouncing from ascending supports.
Investors’ growing interest in ORDIUSDT reflects rising confidence in the project’s long-term fundamentals, including its role in blockchain scalability and Ordinals adoption, alongside current technical strength in this falling wedge setup. As of early November 2025, trading activity spikes underscore real demand, making this a high-conviction opportunity for those hunting bullish reversal patterns in altcoins. If the breakout confirms with sustained volume, this could mark the start of a fresh bullish leg, with projections eyeing $16 to $21 zones for substantial medium-term gains as buying momentum accelerates.
✅ Show your support by hitting the like button and ✅ Leaving a comment below! (What is You opinion about this Coin) Your feedback and engagement keep me inspired to share more insightful market analysis with you!

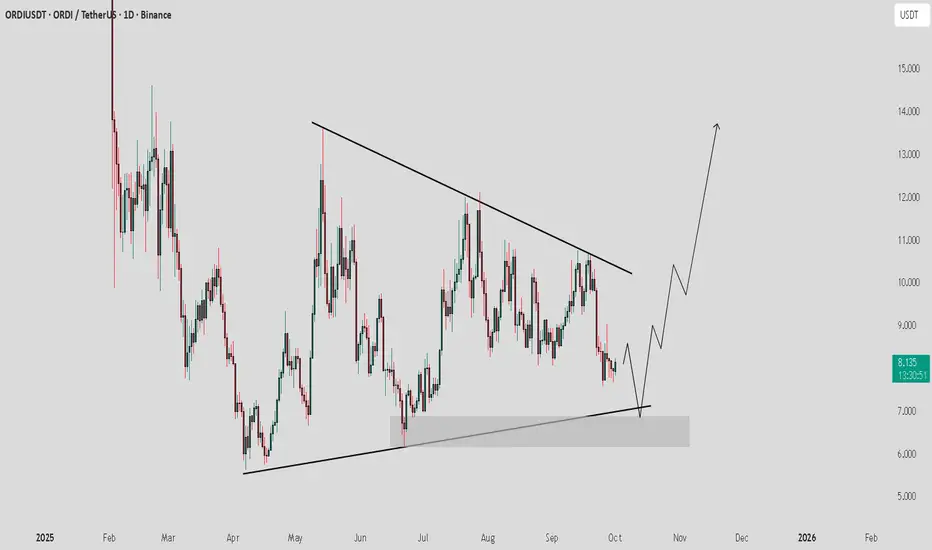
ORDIUSDT Approaching the Big Breakout! The End of the Downtrend?ORDI/USDT is now at one of its most crucial moments of 2025.
After a sharp rebound from the $3–$4 zone, the price is approaching the main descending trendline that has rejected every major rally for months.
This is a make-or-break zone — where the market will decide whether a major reversal begins or if this is just another bearish trap before continuation down.
---
🧩 Technical Structure
Main trend: Strong downtrend since early 2025, forming a clear series of lower highs and lower lows.
Primary resistance: The yellow descending trendline connecting all major peaks.
Key support zone: $3.1 – $4.8 (strong demand area).
Key resistances: $6.0 (current level), $10.5, $13, $20, and major resistance at $49–$53.
Volume note: The latest rebound shows a strong volume spike, signaling renewed buyer interest.
---
⚡ Bullish Scenario – “The Reversal Awakening”
If ORDI can close a daily candle above the descending trendline, it would mark the first true breakout of this long-term downtrend — a potential start of a major trend reversal.
Bullish triggers:
Daily close above $7–$7.5 with solid volume.
Retest of the breakout zone holding as new support.
Strong continuation candles confirming breakout momentum.
🎯 Bullish Targets:
1. $10.50 — first resistance and conservative target.
2. $13.00 — medium-term target.
3. $20.00+ — next major target if the breakout sustains.
📈 A confirmed breakout here would officially break the mid-term downtrend structure.
---
💀 Bearish Scenario – “False Break & The Trap Zone”
If ORDI fails to break above the trendline and forms a rejection candle (long upper wick), it could trigger another bull trap.
This would signal that bears are still in control, pushing price back toward lower supports.
Bearish confirmation signs:
Rejection candle at the trendline with high volume.
No follow-through in the next session.
🎯 Bearish Targets:
$4.8 → $3.8 (short-term correction zone).
If $3.1 support breaks, expect further downside continuation.
⚠️ Bearish invalidation: A confirmed daily close above the trendline (breakout).
---
🧠 Pattern & Sentiment
Current structure forms a descending resistance breakout setup — a potential reversal pattern after months of decline.
The sharp rebound with volume may indicate early accumulation.
Market sentiment is shifting, but confirmation is key before declaring a trend change.
---
🧭 Strategy & Risk Management
Conservative Approach:
Wait for a daily close above the trendline.
Enter on the successful retest (trendline becomes support).
Place stop below the previous swing low (~$4.0).
First target $10.5, then $13.
Aggressive Approach:
Early entry near $6.0–$6.2 (anticipating breakout).
Tight stop below $5.0.
Add on confirmation after breakout.
💡 Remember: Volume confirmation is the key to validating any breakout.
---
🔮 Epic Summary
ORDI stands at the edge of transformation.
After a year-long downtrend, it’s now testing the same trendline that has rejected every rally before.
A clean breakout could mark the beginning of a powerful bullish phase, while a sharp rejection would confirm that bears are not done yet.
This isn’t just another resistance — it’s the decision zone for ORDI’s next major move.
---
#ORDI #ORDIUSDT #CryptoAnalysis #TechnicalAnalysis #Altcoin #CryptoTrading #BreakoutSetup #TrendlineBreakout #SupportResistance #BullishScenario #BearishScenario #ChartAnalysis #CryptoCharts

$ORDI/USDT pessimistic outlook, I do not invest anymore.I have invested and made good money trading SEED_DONKEYDAN_MARKET_CAP:ORDI for a while. I have ridden the rise and sold at $69, missing the peak and feeling bad at the time.
Now my sentiment about SEED_DONKEYDAN_MARKET_CAP:ORDI is very bearish, and I will explain why I will stop trading it. Here are several events that have happened and are red flags:
1. SEED_DONKEYDAN_MARKET_CAP:ORDI was created in March 2023 by Domo, an enigmatic blockchain analyst; he just posted it on Github, and it was adopted by the team developing Bitcoin code. Binance launched it nobody knows why,
2. SEED_DONKEYDAN_MARKET_CAP:ORDI does not have a proper website. The founder didn't make money out of it and is not supporting it.
3. SEED_DONKEYDAN_MARKET_CAP:ORDI does not have an identified legal entity, no budget, no tokenomics, no roadmap, and no ecosystem.
4. SEED_DONKEYDAN_MARKET_CAP:ORDI now has RUNE (not the Thorchain CRYPTOCAP:RUNE ), which has a questionable name and seems to be a modification of BRC-20 to make money out of it. I personally think that it is shady.
So SEED_DONKEYDAN_MARKET_CAP:ORDI is a VERY HIGH investment risk, manipulated by Binance, with no team, and no future, to be honest. Worse, RUNE seems to be a takeover by Casey Rodarmor, a Bitcoin dev, and the name he has chosen is not compatible with any exchange because it already exists with a top 50 token that is older and succesful!
What the hell is going on?
I think that $95 is the all-time high for this coin for its lifetime, which will dump into oblivion before the end of this bull run, with no fundamental attached to it, I do not see what can save it.
Of course, I might be wrong; some magic could happen, and some pump might occur, but the signs of imminent death are already showing. It has dumped 66%, one of the worst performances of all the top 100 cryptos since its ATH. It is not recovering.
Conclusion: Be very careful with this coin. It has been short-lived and is probably in the process of dying.

ORDI / USDT : Looking in a good momentum for a rallyORDI / USDT has bounced from strong support and is showing positive momentum. If this strength continues, we could see a bullish move towards $10 – $12 – $15 in the coming days.
Keep a close watch on momentum and manage risk wisely.
NOTE : Breakdown from support will invalidate this setup
ORDI / USDT : Looking for a price to bounce back from supportORDI is moving towards support for a possible retest. If it holds and we see a bounce, a strong move can follow with breakout targets at $12–$15. The key level to watch is this support – as long as it holds, the setup remains valid. A breakdown below will invalidate the setup.
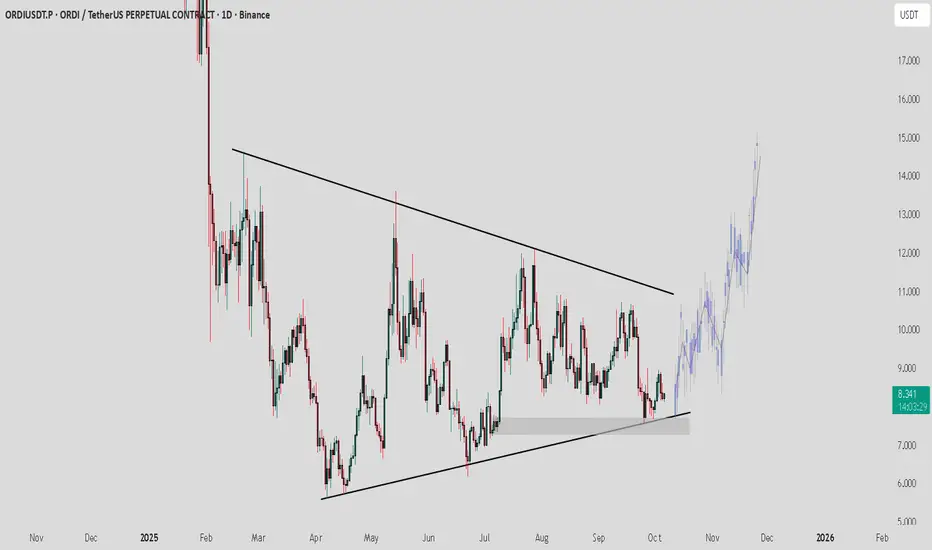
ORDI/USDT — Symmetrical Triangle: A Major Breakout?Currently, ORDI/USDT is consolidating tightly after a prolonged downtrend from the 52.880 peak. The chart is showing a symmetrical triangle, with a descending trendline pressing from above and a rising support line holding from below.
This pattern reflects a compression phase — volatility is narrowing, momentum is being stored, and a major breakout is likely to occur soon.
---
🔎 Pattern & Structure Details
Main trend: Long-term bearish since Dec 2024 (consistent lower highs).
Key support zone: 5.61 – 7.00 (highlighted yellow box), tested multiple times since April.
Key resistance zone: Descending trendline + horizontal resistance around 10.298.
Volatility: Shrinking significantly — the price is moving closer to the apex of the triangle, where breakouts usually happen with strong volume.
---
🟢 Bullish Scenario
1. Breakout confirmation: Daily close above 10.30 with high volume (clear break of descending trendline).
2. Initial targets: 11.58, then 13.17.
3. Extended targets (mid-term): If momentum continues, possible rally toward 20.43 – 23.38.
4. Risk Management: Place stop-loss below 8.0 or under the retest level in case of a false breakout.
---
🔴 Bearish Scenario
1. Breakdown confirmation: Daily close below 7.00 (falling out of the accumulation zone).
2. Initial target: 5.61 support.
3. If 5.61 breaks: Price could extend lower into the 4.0 – 5.0 psychological zone.
4. Risk Management: Stop-loss can be placed above 8.5 – 9.0 to avoid fake breakdowns.
---
⚖️ Conclusion
Neutral outlook until breakout: Symmetrical triangles are statistically neutral, but since it formed inside a broader downtrend, bearish continuation probability is slightly higher.
However, a breakout above resistance with strong volume could trigger a trend reversal and bring back mid-term bullish momentum.
Best approach: wait for confirmed breakout (daily close + volume) before taking positions.
---
ORDI is consolidating inside a symmetrical triangle. Key support zone: 5.61 – 7.00, key resistance: 10.30. The next breakout will set the direction:
🚀 Bullish: Break above 10.30 → targets 11.58, 13.17, even 20+.
🔻 Bearish: Drop below 7.00 → target 5.61, possibly 4.0.
Volatility is tightening — expect a big move soon. Trade with risk management, avoid FOMO.
#ORDI #ORDIUSDT #Crypto #PriceAction #Breakout #TechnicalAnalysis

ORDIUSDT Forming Falling WedgeORDIUSDT is currently displaying a classic falling wedge pattern on the charts, a formation typically associated with bullish reversals. This technical setup suggests that the recent downtrend may be nearing exhaustion, with potential for a strong upward breakout. The wedge has been forming with lower highs and lower lows converging toward a breakout point, and recent candles suggest bullish pressure is beginning to build. With good volume supporting the structure, the conditions look ripe for a breakout rally.
A breakout from this falling wedge could see ORDIUSDT gaining between 70% to 80% in the coming weeks, based on historical price action and wedge height projections. The increased investor interest and healthy trading volume add conviction to this scenario, making it an attractive setup for both short-term swing traders and long-term crypto investors. The asset appears to be forming a base, and if the breakout confirms above key resistance levels, it could rapidly advance toward new highs.
What further adds to the bullish thesis is the growing attention toward Ordinals and Bitcoin-native assets, of which ORDI is a prominent player. Market participants are gradually shifting focus back to unique infrastructure and innovation-driven tokens, and ORDIUSDT may benefit from this shift in sentiment. With bullish divergence on indicators and confirmation of a breakout, this could be a strong candidate for a high-risk, high-reward opportunity.
Traders should keep an eye on volume spikes and confirmation candles for a safer entry. As always, risk management is key in volatile conditions, but technically, ORDIUSDT shows a promising structure that deserves close monitoring.
✅ Show your support by hitting the like button and
✅ Leaving a comment below! (What is You opinion about this Coin)
Your feedback and engagement keep me inspired to share more insightful market analysis with you!

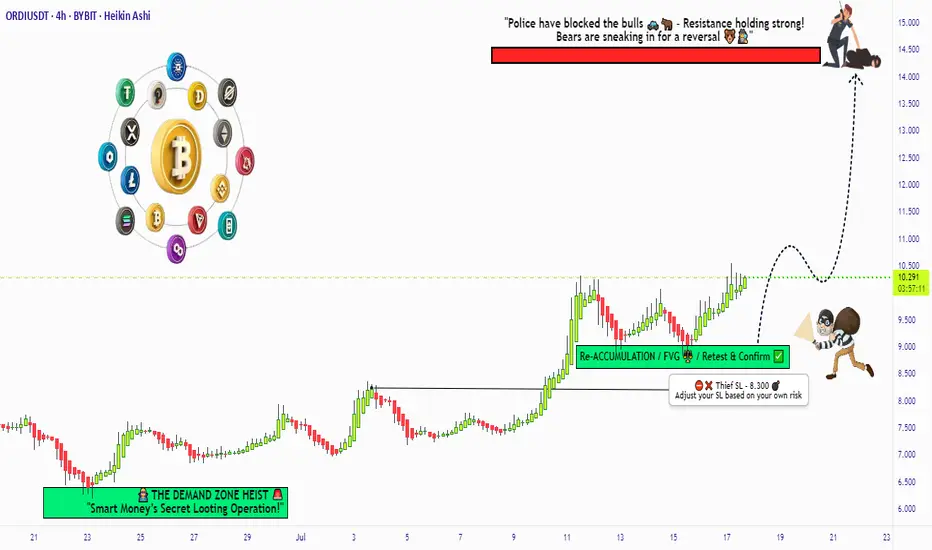
"ORDI/USDT: Pirate’s Treasure Trade! Bullish & Loaded"🚨 ORDI/USDT HEIST ALERT! 🚨 ORDI/USDT Bullish Raid Plan (Thief Trading Style) 💰🎯
🌟 Attention Market Pirates & Profit Raiders! 🌟
🔥 Thief Trading Strategy Activated! 🔥
📌 Mission Brief:
Based on our elite Thief Trading analysis (technical + fundamental heist intel), we’re plotting a bullish robbery on ORDI/USDT. Our goal? Loot profits near the high-risk resistance zone before the "Police Barricade" (bear traps & reversals) kicks in!
🚨 Trade Setup (Day/Swing Heist Plan):
Entry (📈): "The vault is open! Swipe bullish loot at any price!"
Pro Tip: Use buy limits near 15M/30M swing lows for safer pullback entries.
Advanced Thief Move: Layer multiple DCA limit orders for maximum stealth.
Stop Loss (🛑): 8.300 (Nearest 4H candle body swing low). Adjust based on your risk tolerance & lot size!
Target (🎯): 14.400 (or escape early if the market turns risky!).
⚡ Scalper’s Quick Loot Guide:
Only scalp LONG!
Rich thieves? Go all-in! Broke thieves? Join swing traders & execute the plan slowly.
Use trailing SL to lock profits & escape safely!
💎 Why ORDI/USDT? (Fundamental Heist Intel)
✅ Bullish momentum in play!
✅ Macro trends, & intermarket signals favor upside!
✅ News-driven volatility? Expect big moves!
⚠️ WARNING: Market Cops (News Events) Ahead!
Avoid new trades during high-impact news!
Trailing stops = Your best escape tool!
💥 BOOST THIS HEIST!
👉 Hit LIKE & FOLLOW to strengthen our robbery squad! More lucrative heists coming soon! 🚀💰
🎯 Final Note: This is NOT financial advice—just a thief’s masterplan! Adjust based on your risk & strategy!
🔥 Ready to Raid? Let’s STEAL Some Profits! 🏴☠️💸
👇 Drop a comment & boost the plan! 👇
(🔔 Stay tuned for the next heist!) 🚀🤫
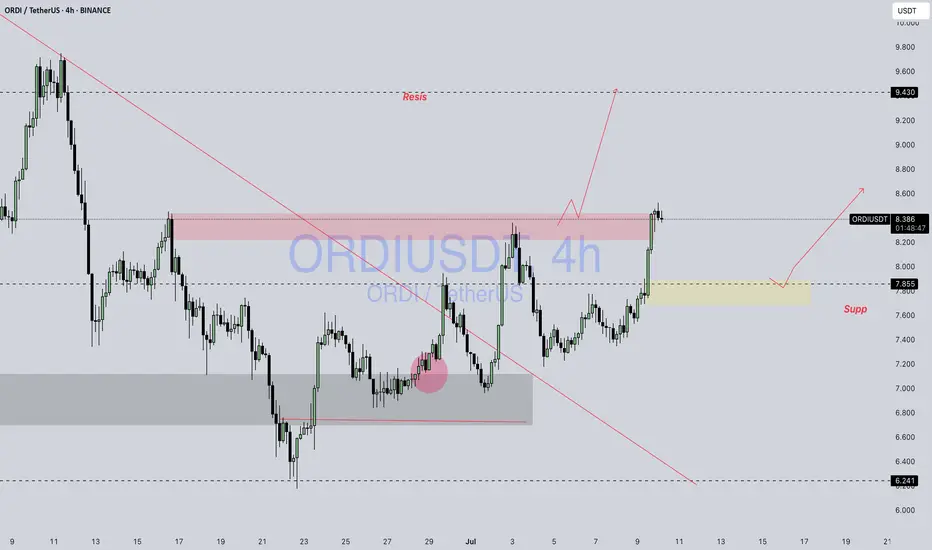
ORDI / USDTBINANCE:ORDIUSDT
### 📊 **Technical**###
* **Current Price:** \~8.377 USDT
* **Chart Type:** Candlestick (4H)
* **Trendline:** A long-term **downtrend line** has been broken, signaling a potential trend reversal or breakout.
---
### 📍 **Key Zones:**
1. **Resistance Zone (Red Box):**
* Located around **8.3 to 8.5** USDT.
* Price is currently testing this zone.
* A clean breakout with volume can send price toward the **next resistance at 9.43** USDT.
2. **Support Zone (Yellow Box):**
* Around **7.85** USDT.
* If price faces rejection from the resistance, it might pull back to this support and bounce from there.
3. **Next Major Resistance:**
* Marked at **9.430** USDT — likely the next target if the breakout sustains.
---
### 🧭 **Scenarios to Watch:**
* ✅ **Bullish Scenario:**
* Break and hold above the red resistance zone.
* Possible continuation toward 9.43 USDT.
* ⚠️ **Bearish Pullback Scenario:**
* Rejection from the red zone.
* Retest of the 7.85 support zone.
* A bounce here could still maintain a bullish structure.
Disclaimer : Not Financial Advice
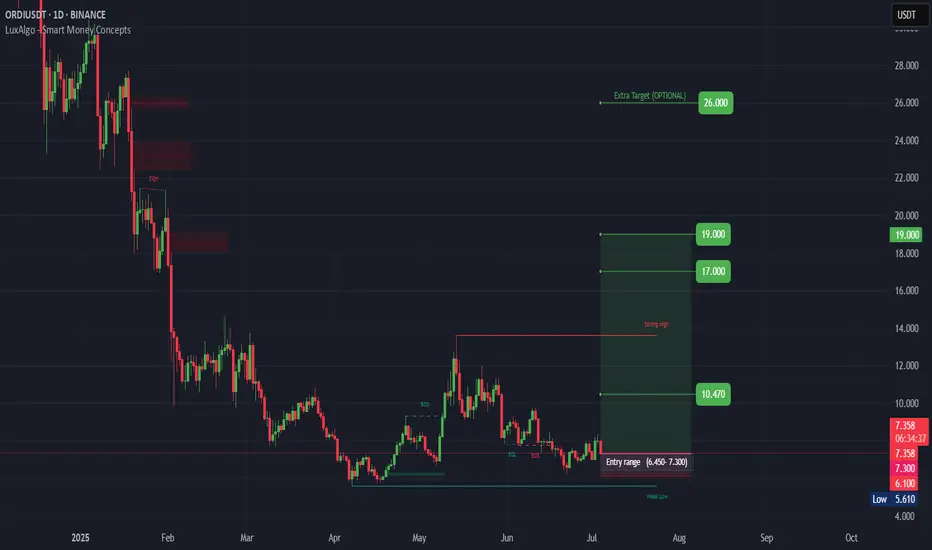
ORDI (SPOT)BINANCE:ORDIUSDT
#ORDI/ USDT
Entry(6.450- 7.300)
SL 1D close below 6.100
T1 10.470
T2 17.000
T3 19.000
1 Extra Targets(optional) in chart, if you like to continue in the trade with making stoploss very high.
______________________________________________________________
Golden Advices.
********************
* collect the coin slowly in the entry range.
* Please calculate your losses before the entry.
* Do not enter any trade you find it not suitable for you.
* No FOMO - No Rush , it is a long journey.
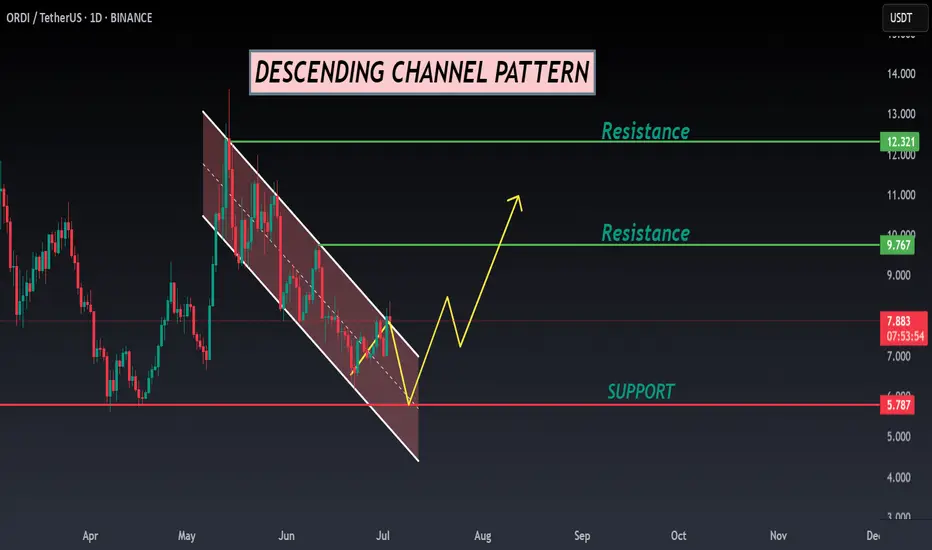
ORDI ANALYSIS📊 #ORDI Analysis
✅There is a formation of Descending Channel Pattern in daily time frame.
After a breakout of the pattern we would see a bullish momentum and can Target for $9.5 in few weeks🧐
👀Current Price: $7.890
🎯 Target Price : $9.500
⚡️What to do ?
👀Keep an eye on #ORDI price action and volume. We can trade according to the chart and make some profits⚡️⚡️
#ORDI #Cryptocurrency #Breakout #TechnicalAnalysis #DYOR
ORDIUSDT Forming Falling WedgeORDIUSDT is shaping up to be one of the more compelling opportunities on the crypto charts right now. The pair is forming a classic falling wedge pattern, which is widely regarded as a strong bullish reversal setup when spotted after a prolonged downtrend. This pattern often signals that selling pressure is fading and buyers are preparing to take control. With good volume building up, it’s clear that investors and traders are taking renewed interest in this project as it nears a potential breakout zone.
What makes ORDIUSDT even more interesting is the promising upside it could deliver if this falling wedge pattern confirms as expected. A projected gain of 70% to 80%+ makes this setup especially attractive for swing traders looking for medium-term positions with solid reward-to-risk ratios. The broader market sentiment is shifting, and coins with technically strong reversal setups like ORDIUSDT often outperform during such phases.
The community buzz and on-chain activity surrounding ORDI is also gaining traction, which adds further confidence to this bullish scenario. Many traders see the confluence of technical signals and increasing investor interest as a sign that this pair could soon break above its descending resistance line and rally aggressively. Keeping an eye on key resistance levels and volume spikes will be crucial to spot the right entry point.
✅ Show your support by hitting the like button and
✅ Leaving a comment below! (What is You opinion about this Coin)
Your feedback and engagement keep me inspired to share more insightful market analysis with you!

ORDIUSDT Hanging by a Thread Before the Next Leg Down?Yello Paradisers! Are you ready for the next big move on #ORDIUSDT? Because if you’re not already positioned or thinking three steps ahead, this structure could catch you off guard. We’re seeing signs of exhaustion, and the market is setting up for another potential drop. Here’s what you need to know before it's too late.
💎#ORDIUSDT remains in a clear downtrend, printing consistent lower highs and lower lows. Each rally is weaker than the last, and buyers have failed to break above key resistance zones. After the most recent failed bounce into the 7.28–7.51 area—where support has now flipped to resistance—sellers regained control and pushed price back below the 21 EMA. This confirms the
bearish momentum remains dominant and is high probability to go further down.
💎The structure continues to print classic breakdown signals. Multiple breaks of structure (BOS) further validate the downtrend. As long as price remains under the 8.47 invalidation level, there's no technical reason to consider a bullish scenario. Any short-term bounce into resistance is more likely to be a selling opportunity rather than a reversal signal.
💎If price continues lower from here, we’re watching the support levels at 6.46 and then the major support level between 5.79–5.53. A sweep of those levels could trap late shorts, but until we see a confirmed shift in market structure, our bias remains bearish. Patience will be rewarded here.
💎This is a classic scenario where retail traders often get chopped up. The real move comes after both sides get squeezed. Don't be part of the noise.
Strive for consistency, not quick profits. Treat the market as a businessman, not as a gambler. The downtrend is clear, but only disciplined traders will be able to extract profits here without emotional mistakes. Stay sharp, stay strategic, and above all—stay safe, Paradisers.
MyCryptoParadise
iFeel the success🌴

Ordi / Usdt BINANCE:ORDIUSDT
**Key Levels**
- **Resistance:** 7.855 (recent high) → 8.500 (next barrier)
- **Support:** 7.090 (today's low) → 6.241 (critical floor)
**Current Action**
- Trading at **7.118** (-1.96%) after testing **7.281** high
- Rejected from **7.281**, now near **7.090 support**
**What to Watch**
- **Bullish Case:** Hold above **7.090**, retest **7.855**
- **Bearish Risk:** Break below **7.090** → Drop to **6.241**
**Trade Setup**
- **Longs:** Only if holds 7.090 + volume (target 7.855)
- **Shorts:** If breaks 7.090 (target 6.500-6.241)
**Volume Alert**
- Weak bids → Risk of deeper correction
*(Not financial advice!)* 🔍

ORDIUSDT 2D AnalysisORDI ~ 2D Analysis
#ORDI This is the lowest support block for now. Buy if you still have confidence in this coin with a short term target of at least 15%++.

ORDI/USDT – Bullish Falling Wedge Formation!!Hey Traders — if you're into high-conviction setups with real momentum, this one’s for you.
ORDI is forming a bullish falling wedge pattern and is currently consolidating near crucial support. The price is showing initial signs of breakout potential.
Here's the trade plan:
Entry: $7.20–$7.70
Targets: $9.20 / $10.50 / $11.90
Stop Loss: $6.50 (Strict)
Excellent risk-to-reward opportunity here. Keep your stops tight and manage your risk wisely.

ordiSupport and press the rocket to cheer me up
Observe the ten percent loss limit
Stay away from Bitcoins
Feel free to buy and sell and post your comments

ordiWe have a series of numbers that can be considered as medium-term targets. But in the short term, the red box is in the way as resistance.

ORDIUSDT heading to weekly supportORDIUSDT is currently trending down after hitting the weekly resistance WR1.
The price is likely to head to weekly support WS1. This support is going to hold the price and provide the bounce.
I believe, the price is very likely to bounce from WS1 and then move upward and on this attempt it may break weekly resistance WR1.
I will share the update once we have the price bounce from WS1 and trading around WR1.

$ORDI Enters Key Fib Support, Watching for Bounce!!SEED_DONKEYDAN_MARKET_CAP:ORDI
It’s not forming any clear pattern, but based on the Fib retracement, price is currently sitting in the golden entry zone around the 0.5–0.618 level.
Also, the 100 MA, which previously acted as strong resistance, is now working as support.
This setup looks interesting because of the tight stop-loss and high reward potential.
I’ve entered the trade with this logic.
Let’s see how it plays out 👀
#ORDI #CRYPTOMOJO_TA
