ORDIUSDT Approaching the Big Breakout! The End of the Downtrend?ORDI/USDT is now at one of its most crucial moments of 2025.
After a sharp rebound from the $3–$4 zone, the price is approaching the main descending trendline that has rejected every major rally for months.
This is a make-or-break zone — where the market will decide whether a major reversal begins or if this is just another bearish trap before continuation down.
---
🧩 Technical Structure
Main trend: Strong downtrend since early 2025, forming a clear series of lower highs and lower lows.
Primary resistance: The yellow descending trendline connecting all major peaks.
Key support zone: $3.1 – $4.8 (strong demand area).
Key resistances: $6.0 (current level), $10.5, $13, $20, and major resistance at $49–$53.
Volume note: The latest rebound shows a strong volume spike, signaling renewed buyer interest.
---
⚡ Bullish Scenario – “The Reversal Awakening”
If ORDI can close a daily candle above the descending trendline, it would mark the first true breakout of this long-term downtrend — a potential start of a major trend reversal.
Bullish triggers:
Daily close above $7–$7.5 with solid volume.
Retest of the breakout zone holding as new support.
Strong continuation candles confirming breakout momentum.
🎯 Bullish Targets:
1. $10.50 — first resistance and conservative target.
2. $13.00 — medium-term target.
3. $20.00+ — next major target if the breakout sustains.
📈 A confirmed breakout here would officially break the mid-term downtrend structure.
---
💀 Bearish Scenario – “False Break & The Trap Zone”
If ORDI fails to break above the trendline and forms a rejection candle (long upper wick), it could trigger another bull trap.
This would signal that bears are still in control, pushing price back toward lower supports.
Bearish confirmation signs:
Rejection candle at the trendline with high volume.
No follow-through in the next session.
🎯 Bearish Targets:
$4.8 → $3.8 (short-term correction zone).
If $3.1 support breaks, expect further downside continuation.
⚠️ Bearish invalidation: A confirmed daily close above the trendline (breakout).
---
🧠 Pattern & Sentiment
Current structure forms a descending resistance breakout setup — a potential reversal pattern after months of decline.
The sharp rebound with volume may indicate early accumulation.
Market sentiment is shifting, but confirmation is key before declaring a trend change.
---
🧭 Strategy & Risk Management
Conservative Approach:
Wait for a daily close above the trendline.
Enter on the successful retest (trendline becomes support).
Place stop below the previous swing low (~$4.0).
First target $10.5, then $13.
Aggressive Approach:
Early entry near $6.0–$6.2 (anticipating breakout).
Tight stop below $5.0.
Add on confirmation after breakout.
💡 Remember: Volume confirmation is the key to validating any breakout.
---
🔮 Epic Summary
ORDI stands at the edge of transformation.
After a year-long downtrend, it’s now testing the same trendline that has rejected every rally before.
A clean breakout could mark the beginning of a powerful bullish phase, while a sharp rejection would confirm that bears are not done yet.
This isn’t just another resistance — it’s the decision zone for ORDI’s next major move.
---
#ORDI #ORDIUSDT #CryptoAnalysis #TechnicalAnalysis #Altcoin #CryptoTrading #BreakoutSetup #TrendlineBreakout #SupportResistance #BullishScenario #BearishScenario #ChartAnalysis #CryptoCharts
Ordiusdtsignal

ORDI/USDT — Symmetrical Triangle: A Major Breakout?Currently, ORDI/USDT is consolidating tightly after a prolonged downtrend from the 52.880 peak. The chart is showing a symmetrical triangle, with a descending trendline pressing from above and a rising support line holding from below.
This pattern reflects a compression phase — volatility is narrowing, momentum is being stored, and a major breakout is likely to occur soon.
---
🔎 Pattern & Structure Details
Main trend: Long-term bearish since Dec 2024 (consistent lower highs).
Key support zone: 5.61 – 7.00 (highlighted yellow box), tested multiple times since April.
Key resistance zone: Descending trendline + horizontal resistance around 10.298.
Volatility: Shrinking significantly — the price is moving closer to the apex of the triangle, where breakouts usually happen with strong volume.
---
🟢 Bullish Scenario
1. Breakout confirmation: Daily close above 10.30 with high volume (clear break of descending trendline).
2. Initial targets: 11.58, then 13.17.
3. Extended targets (mid-term): If momentum continues, possible rally toward 20.43 – 23.38.
4. Risk Management: Place stop-loss below 8.0 or under the retest level in case of a false breakout.
---
🔴 Bearish Scenario
1. Breakdown confirmation: Daily close below 7.00 (falling out of the accumulation zone).
2. Initial target: 5.61 support.
3. If 5.61 breaks: Price could extend lower into the 4.0 – 5.0 psychological zone.
4. Risk Management: Stop-loss can be placed above 8.5 – 9.0 to avoid fake breakdowns.
---
⚖️ Conclusion
Neutral outlook until breakout: Symmetrical triangles are statistically neutral, but since it formed inside a broader downtrend, bearish continuation probability is slightly higher.
However, a breakout above resistance with strong volume could trigger a trend reversal and bring back mid-term bullish momentum.
Best approach: wait for confirmed breakout (daily close + volume) before taking positions.
---
ORDI is consolidating inside a symmetrical triangle. Key support zone: 5.61 – 7.00, key resistance: 10.30. The next breakout will set the direction:
🚀 Bullish: Break above 10.30 → targets 11.58, 13.17, even 20+.
🔻 Bearish: Drop below 7.00 → target 5.61, possibly 4.0.
Volatility is tightening — expect a big move soon. Trade with risk management, avoid FOMO.
#ORDI #ORDIUSDT #Crypto #PriceAction #Breakout #TechnicalAnalysis

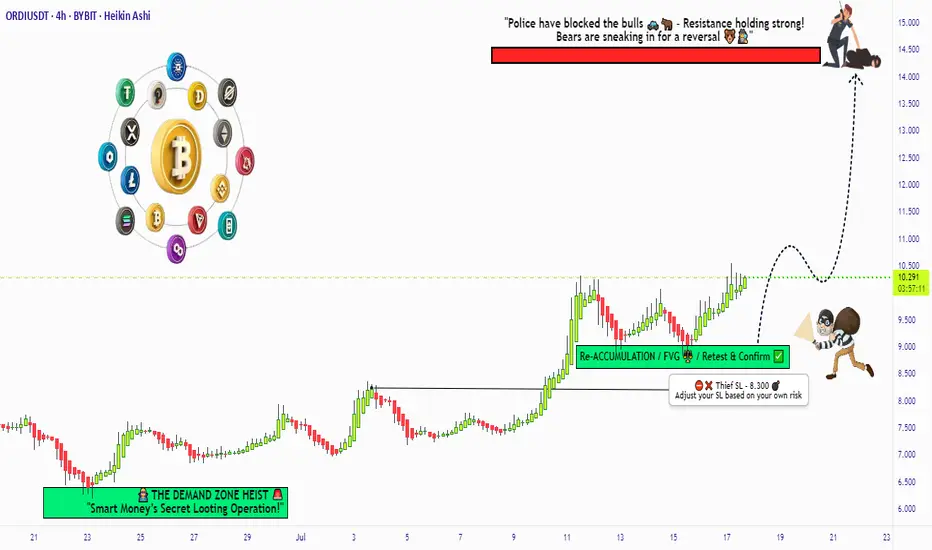
"ORDI/USDT: Pirate’s Treasure Trade! Bullish & Loaded"🚨 ORDI/USDT HEIST ALERT! 🚨 ORDI/USDT Bullish Raid Plan (Thief Trading Style) 💰🎯
🌟 Attention Market Pirates & Profit Raiders! 🌟
🔥 Thief Trading Strategy Activated! 🔥
📌 Mission Brief:
Based on our elite Thief Trading analysis (technical + fundamental heist intel), we’re plotting a bullish robbery on ORDI/USDT. Our goal? Loot profits near the high-risk resistance zone before the "Police Barricade" (bear traps & reversals) kicks in!
🚨 Trade Setup (Day/Swing Heist Plan):
Entry (📈): "The vault is open! Swipe bullish loot at any price!"
Pro Tip: Use buy limits near 15M/30M swing lows for safer pullback entries.
Advanced Thief Move: Layer multiple DCA limit orders for maximum stealth.
Stop Loss (🛑): 8.300 (Nearest 4H candle body swing low). Adjust based on your risk tolerance & lot size!
Target (🎯): 14.400 (or escape early if the market turns risky!).
⚡ Scalper’s Quick Loot Guide:
Only scalp LONG!
Rich thieves? Go all-in! Broke thieves? Join swing traders & execute the plan slowly.
Use trailing SL to lock profits & escape safely!
💎 Why ORDI/USDT? (Fundamental Heist Intel)
✅ Bullish momentum in play!
✅ Macro trends, & intermarket signals favor upside!
✅ News-driven volatility? Expect big moves!
⚠️ WARNING: Market Cops (News Events) Ahead!
Avoid new trades during high-impact news!
Trailing stops = Your best escape tool!
💥 BOOST THIS HEIST!
👉 Hit LIKE & FOLLOW to strengthen our robbery squad! More lucrative heists coming soon! 🚀💰
🎯 Final Note: This is NOT financial advice—just a thief’s masterplan! Adjust based on your risk & strategy!
🔥 Ready to Raid? Let’s STEAL Some Profits! 🏴☠️💸
👇 Drop a comment & boost the plan! 👇
(🔔 Stay tuned for the next heist!) 🚀🤫
ORDIUSDT Hanging by a Thread Before the Next Leg Down?Yello Paradisers! Are you ready for the next big move on #ORDIUSDT? Because if you’re not already positioned or thinking three steps ahead, this structure could catch you off guard. We’re seeing signs of exhaustion, and the market is setting up for another potential drop. Here’s what you need to know before it's too late.
💎#ORDIUSDT remains in a clear downtrend, printing consistent lower highs and lower lows. Each rally is weaker than the last, and buyers have failed to break above key resistance zones. After the most recent failed bounce into the 7.28–7.51 area—where support has now flipped to resistance—sellers regained control and pushed price back below the 21 EMA. This confirms the
bearish momentum remains dominant and is high probability to go further down.
💎The structure continues to print classic breakdown signals. Multiple breaks of structure (BOS) further validate the downtrend. As long as price remains under the 8.47 invalidation level, there's no technical reason to consider a bullish scenario. Any short-term bounce into resistance is more likely to be a selling opportunity rather than a reversal signal.
💎If price continues lower from here, we’re watching the support levels at 6.46 and then the major support level between 5.79–5.53. A sweep of those levels could trap late shorts, but until we see a confirmed shift in market structure, our bias remains bearish. Patience will be rewarded here.
💎This is a classic scenario where retail traders often get chopped up. The real move comes after both sides get squeezed. Don't be part of the noise.
Strive for consistency, not quick profits. Treat the market as a businessman, not as a gambler. The downtrend is clear, but only disciplined traders will be able to extract profits here without emotional mistakes. Stay sharp, stay strategic, and above all—stay safe, Paradisers.
MyCryptoParadise
iFeel the success🌴

ORDIUSDT 2D AnalysisORDI ~ 2D Analysis
#ORDI This is the lowest support block for now. Buy if you still have confidence in this coin with a short term target of at least 15%++.

ORDIUSDT 2D AnalysisORDI ~ 2D Analysis
#ORDI This trade is very high risk
This is the lowest support for now, buy gradually with a short -term target of at least 15%+.

ORDIUSDT 4DORDI ~ 4D
#ORDI This is the key support that needs to be maintained. If you still have Conviction on this coin,. Small quantity purchases from here are not so bad. target 20%++

ORDIUSDT 4DORDI ~ 4D
#ORDI So far it still maintains this support block,. If you still have Conviction on this coin,. Buy in stages, Target 20%++

ORDIUSDT 3DORDI ~ 3D
#ORDI If you still have Conviction on this coin,. Purchase in two stages. you can buy inside this pattern or you can buy at this support block. Minimum target 20%++

ORDIUSDTORDI ~ 2D ✅
#ORDI Ready to continue rising after successfully closing the price above the resistance of this descending pattern.
Rejection from here will make the price consolidate even longer in this descending pattern.

#ORDI entry range ( 26.73 - 28.19) for 20% profit (34.22)#ORDI
entry range ( 26.73 - 28.19)
20% Target (34.22)
SL .4H close below 25.66
#ORDI
SEED_DONKEYDAN_MARKET_CAP:ORDI
#ORDIUSDT
#ORDIUSD
#swingtrade
#shortterminvestment
#ALTCOIN
#Cryptotading
#cryptoinvesting
#investment
##trading
#cryptocurrencytrading
#bitcoininvestments
#Investing_Coins
#Investingcoins
#Crypto_investing
#Cryptoinvesting
**** #Manta ,#OMNI, #DYM, #AI, #IO, #XAI , #ACE #NFP #RAD #WLD #ORDI ****
#bitcoin
#BTC
#BTCUSDT
BINANCE:ORDIUSDT

ORDIUSDTORDI ~ 2D
#ORDI If you have Conviction on this Coin,. You need to consider this support block., To start purchasing gradually. at least for a 20%+ increase

ORDI/USDT Breakout Alert!! Potential bullish momentum for ORDI.💎 Paradisers, ORDI is indeed showcasing intriguing movements that deserve careful observation.
💎 The successful breakout from the descending channel signifies bullish momentum for ORDI. Currently, the price is potentially preparing to retest the trendline before continuing its upward trajectory toward the supply area of around $55.45.
💎 A successful breakout above this supply zone would confirm ORDI's return to a bullish trend, potentially leading to significant upward movement toward our target strong resistance area.
💎 However, if ORDI encounters resistance at the supply area and receives a strong rejection indicated by a bearish candle, the price may retreat to downward movement.
💎 In such a scenario, ORDI could revisit the support area around $44.60, which coincides with the resistance neckline of the ascending triangle.
💎 ORDI must bounce from this support area and resume its upward trajectory. Failure to bounce, or a breakdown below the support, could signal further downward movement, potentially leading to a test of the Bullish OB area. ORDI needs to reclaim the price above the support area at $44.60 upon reaching the Bullish OB area to maintain bullish momentum.
💎 However, if ORDI breaks below the Bullish OB area, confirmed by a daily candle close below it, it could indicate a bearish trend reversal, leading to continued downward movement.
MyCryptoParadise
iFeel the success🌴
