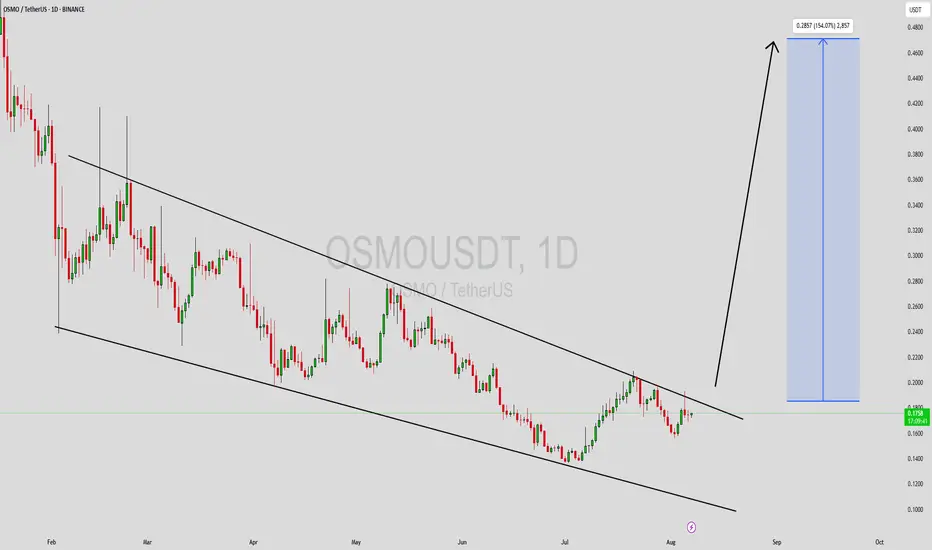
OSMOUSDT Forming Falling WedgeOSMOUSDT is currently displaying a well-formed falling wedge pattern, a classic bullish reversal signal that often precedes strong upward momentum. This pattern is characterized by a narrowing price range, which reflects decreasing selling pressure and a potential shift in market sentiment. As the wedge tightens, a breakout becomes increasingly likely—especially when accompanied by growing volume and investor interest as seen in the recent OSMOUSDT price action.
The falling wedge setup on OSMOUSDT is further supported by a notable uptick in volume, signaling that accumulation may be underway. Historically, falling wedges break to the upside with strong momentum, often leading to rapid price expansion. In this case, the projected upside move is estimated to be in the range of 140% to 150% from current levels. This makes OSMO one of the more attractive breakout candidates in the mid-cap altcoin space, especially for traders seeking high-reward setups.
The overall market sentiment around Osmosis has also been increasingly positive, with more eyes turning toward decentralized finance projects and blockchain infrastructure plays. OSMO, being a core player in the Cosmos ecosystem, is well-positioned for strong speculative interest, particularly as its technicals align with favorable chart patterns and renewed on-chain activity.
For those tracking breakout patterns and looking to capitalize on explosive moves, OSMOUSDT offers a technically sound and timely opportunity worth serious consideration.
✅ Show your support by hitting the like button and
✅ Leaving a comment below! (What is You opinion about this Coin)
Your feedback and engagement keep me inspired to share more insightful market analysis with you!
Osmousdtsignals
OSMOUSDT 5DOSMO ~ 5D
#OSMO This trade is high risk. But if you still have Conviction on the coin,. Buy gradually on this block with a short term target of at least 20%++


Osmo Coin price analysis and PredictionOsmo Coin price analysis and Prediction
Support and Resistance

OSMOUSDT Ahead of a major bullish break-outOsmosis (OSMOUSDT) is testing and marginally breaking today the Lower Highs trend-line that started on the May 05 High. With the 1D RSI on Higher Lows while the price has been on Lower Lows, i.e. a Bullish Divergence, we can finally see a major break-out. The next Resistance level in line and potential target is the 1D MA50 (blue trend-line) and the Lower Highs trend-line since the April 03 High.
If I had to make a projection that would be a rise towards the April 03 Lower Highs trend-line, then sideways consolidation or small correction until the 1D MA50 hits the April Lower Highs. If broken then the coin can test the March 01 Lower Highs and the 1D MA100 (green trend-line) at the same time.
At any point though, if the price after the consolidation/ correction breaks below the recent low/ Support, expect a sharp drop towards the 2.5 Fibonacci extension.
--------------------------------------------------------------------------------------------------------
** Please support this idea with your likes and comments, it is the best way to keep it relevant and support me. **
--------------------------------------------------------------------------------------------------------
