OXT/USDT — Decision Zone: Reversal or Breakdown?🔎 Overview
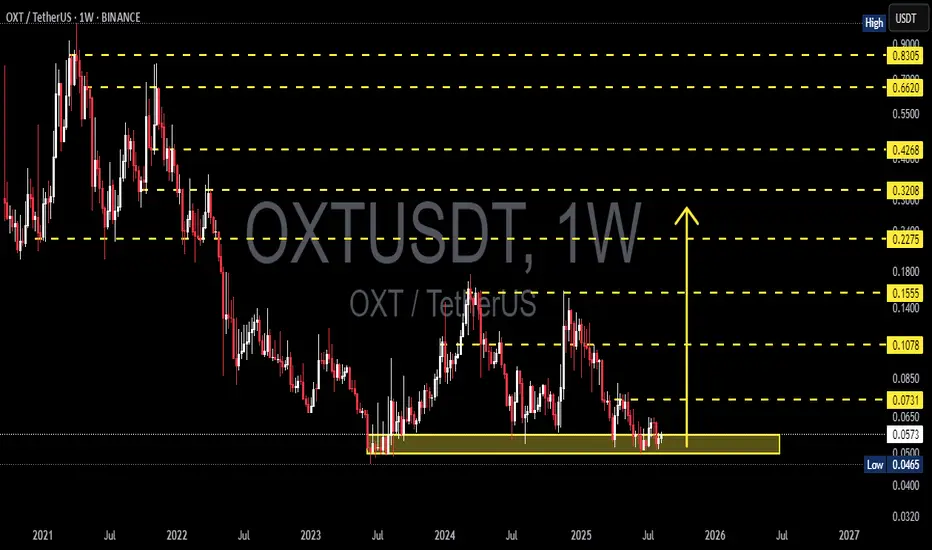
The OXT/USDT pair is currently sitting at a critical juncture. Since the 2021 peak, the price has been under consistent bearish pressure, forming a series of lower highs. On the other hand, from 2023 until now, OXT has repeatedly held the historical support zone at 0.0465 – 0.0600 (highlighted yellow box).
This area signals a potential accumulation phase, where long-term investors may view the price as “undervalued.” Simply put, the market is balancing between two extremes — a multi-year reversal (triple-bottom) or a breakdown into new lows.
---
🟢 Bullish Scenario — Reversal from Multi-Year Support
The accumulation zone (0.0465 – 0.0600) has held for more than 2 years, forming a potential triple-bottom structure.
A weekly close above 0.0731 would be the first signal of recovery momentum.
Stronger bullish confirmation comes at a breakout above 0.1078, which would mark the first higher high after years of decline.
Potential upside targets:
🎯 0.1555 (mid-level resistance)
🎯 0.2275 (major swing target)
🎯 0.3208 – 0.4268 (longer-term distribution zone if trend reversal extends).
If validated, this area could represent a “generational buy zone” for long-term investors.
---
🔴 Bearish Scenario — Breakdown & Continuation of Downtrend
Failure to defend 0.0465 with a confirmed weekly close below this level would invalidate the 2-year base.
A breakdown could trigger a capitulation wave, with price seeking new, lower support levels (not visible on current chart).
Psychologically, losing this long-held support could fuel panic selling, making the decline sharper than previous moves.
Bearish continuation is only confirmed with a weekly close below the yellow support box, not just a wick.
---
📐 Pattern & Structure
Main trend: Bearish since 2021 (lower highs remain intact).
Current structure: Multi-year range/consolidation → possible accumulation.
Formations:
Triple-bottom / Accumulation zone (if held).
Descending structure remains in play (as long as 0.1078 is not reclaimed).
Interpretation: OXT is at the psychological tipping point between “capitulation” or the early stage of a new trend.
---
⚖️ Conclusion
The 0.0465 – 0.0600 zone is the make-or-break area for OXT/USDT.
Bullish case: Multi-year reversal potential if weekly closes above 0.0731 → 0.1078.
Bearish case: Weekly close below 0.0465 = breakdown and continuation of long-term downtrend.
For swing traders and investors, the current area may offer the best risk-reward zone — but weekly close confirmation remains the key.
---
#OXT #Oxen #USDT #Crypto #AltcoinAnalysis #TechnicalAnalysis #SupportResistance #Accumulation #Breakout #TripleBottom #BearishVsBullish #SwingTrading
Oxtlong

OXT/USDT — Accumulation Before a Breakout or Further Decline?📌 Overview
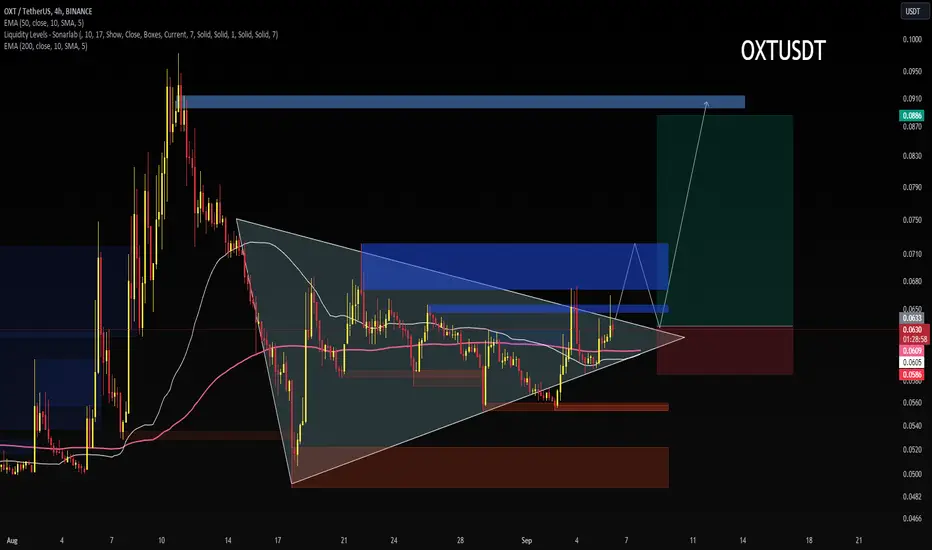
OXT/USDT is currently at a critical stage on the weekly chart, consolidating within the strong demand zone at 0.0465–0.0650 (yellow box) that has been tested multiple times since mid-2023. This area acts as the last line of defense for buyers before price enters uncharted multi-year lows. The macro structure remains in a long-term downtrend since the 2021 peak, but the base formation in this low zone opens up a significant opportunity for a medium-term relief rally if a breakout is confirmed.
---
1. Key Technical Levels
Main Support / Demand Zone (yellow box): 0.0465 – 0.0650
→ This is the “floor” that has been holding price for nearly two years.
Minor Support: 0.0500 (psychological & repeated reaction level)
Layered Resistance Levels:
0.0731 → 0.1078 → 0.1555 → 0.2275 → 0.3208 → 0.4268 → 0.6620 → 0.8305
---
2. Structure & Patterns
Macro Trend: A sequence of lower highs since 2021 → indicating the primary trend is still bearish.
Potential Pattern:
Base / Accumulation Range near multi-year lows → resembles an early rounding bottom, but not confirmed yet.
Possible spring pattern: brief drop below main support followed by a sharp reclaim.
Volume (not shown here): Often decreases near the bottom range, signaling sellers may be losing strength.
---
3. Bullish Scenario (Relief Rally Potential)
💡 Conservative confirmation:
Break & weekly close above 0.0731.
Step-by-step targets: 0.1078 → 0.1555 → 0.2275.
0.1078 is the key breakout pivot; clearing it could trigger large-scale short covering.
⚡ Aggressive setup:
False breakdown below 0.0465 (spring) followed by a quick weekly close back above 0.050–0.055.
Initial target: 0.0650, then 0.0731 if momentum continues.
Best suited for swing traders aiming for high risk/reward.
---
4. Bearish Scenario (Trend Continuation)
Clean weekly close below 0.0465 + failed retest (0.0465 turning into resistance).
Downside targets: 0.0400 then 0.0320.
Failure to break 0.0731 and forming another lower high would also indicate sellers remain in control.
---
5. Strategic Notes
The 0.0465–0.0650 zone is the final battleground between long-term buyers and sellers controlling the macro trend.
Patience is required on this 1W timeframe; valid breakouts may take several weekly candles to confirm.
Aggressive traders may consider entries within the yellow box with tight stops below 0.0465, while conservative traders can wait for a confirmed breakout above key resistance.
---
6. Key Takeaway
As long as price holds inside or above the yellow box, relief rally potential remains alive.
Breaking 0.0731 will be the first major signal of sentiment shift.
A breakdown below 0.0465 opens a new chapter in the long-term downtrend.
#OXT #OXTUSDT #OrchidProtocol #CryptoAnalysis #PriceAction #WeeklyChart #SwingTrade #SupportResistance #BreakoutSetup #CryptoTrading
ORCHID | OXT | Is one to keep your eyes on.ORCHID isn't a very well known coin (OXT), but it's one that you'll wanna keep your eyes on. It looks to me like it's about to make a spectacular move to the upside. Also, I posted the monthly chart in the comments below to give you a better overall perspective of the pattern within the pattern.
Good luck, and always use a stop-loss!

OXT SPOT SIGNAL WEEKLYHello dear traders,
In the OXT cryptocurrency on the weekly timeframe, with the breaking of the trend line and the current market conditions in the crypto market, we can expect a significant price growth in this currency. It can be said that this currency can be considered as a spot investment.
Thank you for your support. May you have a joyful and profitable journey.

OXT-USDT - DAILYThese are my Keylevels for OXT.
Nothing do to here, i think that we need to wait for more confirmations.

OXT to the moonOXT is showing its strength -- can it pull through and get back over previous major support (Now resistance) around the .20 cent range. If it did, it would be a proverbial, three pointer at the buzzer sending them into overtime! ;)

OXT Getting ready for LIFT OFF!OXT is an interesting coin in that the charts have always been a little easier to read than most others. OXT is currently in its low ends of the price spectrum, which means people are scooping up coins prepping for the next run up. OXT tends to shoot up out of no where and as you can see in the chart, it seems to pop up roughly every 8 months. If this cycle continues, we may be in for a serious pump here soon. Could we see a pump to .50 cents or could we see a pump to $1 as it has done already in the past? I have a feeling that soon, and by soon i mean in the next month or two, we may be a huge rally on OXT.

OXT BULLISH BIAS
OXT shows a golden cross together with pattern breakout and this bullrun
I expect to reach that high again
Feel free to share,like and suscribe.
''Stay safe out there everybody''

Long OXT NOW 🚀🔥
OXTUSDT Long Entry : 0.2260 - 0.2250 $
short term : 0.2436 - 0.2493 $
mid term : 0.2660 - 0.2676 - 0.2847 - 0.3164 $
long term : 0.5 - 0.55 - 0.66 - 1 $
Enjoy !

OXT coin ANALYSISThe oxt currency is a very strong currency, and it has a strong project, as well as in technical analysis it is in support, a strong area and an uptrend, I advise you to buy it, and these are its TARGET
👑 ̲F̲X̲o̲n̲e̲4̲a̲l̲l̲ 👑 VIP 🚀🚀
🟢 #OXT - USDT 🔚BINANCE
💰 Buy : now 0.37
🔸TARGET 🎯
🔹 0.57
🔹 0.77
🔹 1.00 $
ADVICE : The decision is yours GOOD LUCK

OXT/USDT Now 53% Up from our entry#oxtusdt Profit update:
#OXT did 53% profit so far.
You can book you profit if you happy.

OXT/USDT did 27% within 13 hours#OXTUSDT profit update:
#OXT did 27% within 13 hours.
Hope you enjoyed.
TP1: $0.6269 ✅

OXT/USDT 100% Potential from here#OXT/USDT TA Update:-
$OXT currently trading at $0.5
And this is support level.
My entry:- $0.47-$0.5
Targets:- $0.62/$0.78/$1
Stop Loss:- $0.45
Support:- $0.48
Resistance:- $0.62

OXT/USDT👑 ̲F̲X̲o̲n̲e̲4̲a̲l̲l̲ 👑 VIP 🚀🚀,
🟢OXT - USDT 🔚BINANCE
Buy limit : 0.42
🔸target💰
🔹0.65$
🔹1$
🔹3$
🎯 time about 3$ : 2 months or 3 months

80% coming in next days ... wait for 2nd target✅ Buy: 0.77 - 0.83 ✅
🎯TARGETS:
1- $1.0467
2- $1.3880
💵 Trade Size: 5-7% of Portfolio
🚫Invalidation(SL): daily candle close below 0.52
Please click LIKE button and Appreciate my hard work.
Must follow me for latest crypto real time updates.
thank you

Retest Time For Lots Of AltcoinsThis season is very good for buy. Like every other coin oxt is retesting too. Good opportunity to get in. My targets on chart.
Follow me for more charts :).
