Plan Your Stop Loss Before the Market Plans It for YouStop loss is not just a level on your chart, it’s your safety belt in trading. It’s what protects your capital when things don’t go in your favor.
Before you enter a trade, you should already know where your stop loss will be. It is less meaningful to decide it after you are in a trade because that’s where emotions take over.
Stoploss is not just a “feel comfortable" point, rather it is the place beyond which your whole idea goes wrong.
There are a few points that need to be focused before deciding your stoploss-
Support and Resistance
Open your trading time frame and go one step up.
Ex. if you trade on 5minute chart, go to 15minutes chart and if you trade on 1hour chart, go to 4hourly chart to identify support and resistance
Here are some clean step ups-
For day trade 1-5, 5-15, 15-60 (minutes)
For Swing trade 30-120, 60-240 (minutes)
For long term 1D-1W, 1W-1M
On the higher timeframe chart, identify important Support and resistance levels
Important support/resistance levels are those which have been tested multiple times or from where strong reactions have already been seen.
Identify the market direction
Up- Price making higher highs- higher lows
Down- Price making lower lows- lower highs formation
Sideways- Price trading in a tight range with no clear direction
If market is up- look for buying a pullback near support zones
If market is down- look for a selling a pullback near resistance zones
If market is sideways- buy near support and sell near resistance
Before you take your trade first know your risk in the trade
Identify the level beyond which your whole idea behind the trade goes wrong- this level is your stoploss
A stoploss could be below the support if you are looking to buy at support
Or this could be above resistance if you are looking to sell at resistance
Identify the next significant level- this is you target
The next resistance in case of long trade
Next support in case of short trade
Calculate if the distance from your entry and your target is more than the distance of your entry from the stoploss.
If it is more then, the reward-risk ratio is in your favor, and the idea is executable.
On the other hand, if the risk in a trade is more than the reward then the trade idea can be avoided.
Also decide your position size according to your stoploss
A wider stoploss means small position size so that you don't lose more than a fixed percentage per trade
A small stoploss means you can increase position size as you have more room to accommodate.
If you find that your stop has to be too wide to make sense, just don’t force the trade. Wait for a cleaner, tighter setup that fits your plan.
Deciding a stoploss is an essential part of your strategy. You might know all the candlestick patterns but without stoploss, they are more like tossing a coin.
Do you decide your stoploss beforehand or after taking a trade?
Tell me in the comment section.
Community ideas

Hedge Fund Secrets: Unveiling the Hidden World of High-FinanceIntroduction
Hedge funds represent one of the most mysterious and influential corners of global finance. Often surrounded by secrecy and elite status, they attract both admiration and controversy. While mutual funds are accessible to the average investor, hedge funds are designed for the wealthy—institutions, corporations, and high-net-worth individuals—who seek aggressive growth and diversification. The “secrets” of hedge funds lie not only in their strategies but also in their flexibility, risk-taking ability, and sophisticated financial engineering.
This essay explores the structure, functioning, strategies, and inner workings of hedge funds—uncovering the tactics and philosophies that make them powerful engines in the financial markets.
1. What Is a Hedge Fund?
A hedge fund is a private investment partnership that pools money from investors and employs a range of strategies to earn high returns, often regardless of market direction. Unlike mutual funds, hedge funds are lightly regulated and have more freedom in how they invest. They can use leverage (borrowed money), short selling, derivatives, and alternative assets such as real estate, commodities, cryptocurrencies, or private equity.
The term “hedge” comes from the original goal—to “hedge” against market risk by taking offsetting positions. However, modern hedge funds have evolved into aggressive return-seeking vehicles, willing to take large, calculated risks for potentially outsized profits.
2. The Secret Structure: Limited Partnership Model
Most hedge funds operate under a limited partnership (LP) structure:
The general partner (GP) manages the fund, makes investment decisions, and assumes full liability.
The limited partners (LPs) are the investors who provide the capital but have limited liability.
This structure allows hedge fund managers to maintain flexibility and control while protecting investors from excessive risk exposure. The GP typically earns a management fee (2%) of total assets and a performance fee (20%) of profits—known as the “2 and 20 rule.” This incentivizes managers to maximize returns.
This performance-based compensation is one of the fund’s “secrets to motivation.” It aligns the manager’s goals with the investors’—both profit when performance is strong. However, it also encourages risk-taking, as the rewards can be massive.
3. The Secret Ingredient: Flexibility and Freedom
Unlike mutual funds or pension funds, hedge funds have minimal investment restrictions. This flexibility is their biggest advantage. Hedge funds can:
Short sell stocks (bet on price decline)
Use leverage to amplify returns
Trade derivatives like options, futures, and swaps
Invest globally across asset classes
Move in and out of positions rapidly
This freedom allows hedge funds to profit in bull or bear markets. For instance, during the 2008 financial crisis, some hedge funds—like John Paulson’s—made billions by betting against the U.S. housing market using credit default swaps.
4. Hedge Fund Strategies: The Real Secrets
Hedge funds are not a single strategy—they are a collection of sophisticated investment techniques. Some of the most powerful and “secretive” strategies include:
A. Long/Short Equity
The classic hedge fund strategy. Managers buy undervalued stocks (long) and short overvalued ones (short). The goal is to profit from relative performance rather than overall market direction.
Example: If a manager expects Apple to outperform Samsung, they go long Apple and short Samsung, profiting from the spread regardless of whether the tech sector rises or falls.
B. Global Macro
This strategy exploits global economic trends—interest rates, currencies, commodities, and geopolitical events. Legendary investor George Soros famously used this approach when he “broke the Bank of England” in 1992, betting against the British pound and earning over $1 billion.
C. Event-Driven
Event-driven funds profit from corporate events such as mergers, bankruptcies, or restructurings. Merger arbitrage is common: buying shares of a company being acquired and shorting the acquirer to profit from the deal’s price spread.
D. Quantitative (Quant) Strategies
Quant funds use advanced algorithms, machine learning, and statistical models to find patterns in massive data sets. These funds rely on technology and mathematics rather than human judgment.
Firms like Renaissance Technologies (founded by Jim Simons) have built mathematical models that consistently outperform markets—a true “black box” secret of modern finance.
E. Distressed Securities
These funds buy the debt of companies in financial trouble, betting that they will recover or that assets can be sold for more than their current market value. This strategy requires deep expertise in corporate law, restructuring, and valuation.
F. Multi-Strategy
Large funds diversify across multiple strategies to balance risk and return. These “all-weather” funds can adapt quickly to changing market conditions.
5. Leverage: The Power and the Danger
One of the most closely guarded secrets of hedge funds is how they use leverage to amplify returns. By borrowing money, a hedge fund can increase its exposure to profitable trades. For instance, a 10% return on a $1 billion position becomes 20% if the fund borrows another $1 billion.
However, leverage also magnifies losses. Many hedge fund collapses—like Long-Term Capital Management (LTCM) in 1998—occurred because excessive leverage turned small losses into disasters. The secret lies in risk management discipline: knowing when to cut losses and when to increase exposure.
6. Risk Management: The Hidden Backbone
While hedge funds are often portrayed as reckless gamblers, successful ones are masters of risk management. They use advanced models to monitor:
Value at Risk (VaR): the maximum expected loss over a given period.
Beta: sensitivity to market movements.
Drawdown limits: maximum allowed decline before positions are cut.
Some hedge funds employ dedicated risk teams independent of portfolio managers. The secret here is not just in taking risks—but in knowing which risks are worth taking.
7. Information Edge: The Secret Weapon
Information is the lifeblood of hedge funds. Successful managers invest heavily in data analytics, market intelligence, and proprietary research. The best funds have access to alternative data—credit card transactions, satellite imagery, social media trends, and supply chain data—that help them detect market trends before others.
In essence, hedge funds compete on information asymmetry. The faster and more accurately they interpret data, the greater their advantage.
However, this “edge” must stay within legal limits. In the past, some hedge funds were caught in insider trading scandals, revealing the fine line between legitimate research and illegal access to non-public information.
8. The Psychology of Hedge Fund Managers
Another hidden secret lies in the psychological resilience of hedge fund managers. The job involves high pressure, rapid decision-making, and emotional control. Successful managers often possess:
Contrarian thinking: Going against market consensus.
Risk tolerance: Comfort with uncertainty and volatility.
Discipline: Following the model or thesis even under stress.
Adaptability: Changing strategies when markets shift.
In many ways, hedge fund management is as much an art as a science—combining intellect, intuition, and emotional stability.
9. Technology: The New Frontier
Modern hedge funds are deeply intertwined with technology and artificial intelligence. High-frequency trading (HFT), machine learning algorithms, and predictive analytics now dominate the industry. Algorithms can execute trades in microseconds, identifying inefficiencies humans cannot detect.
The secret advantage of top-tier funds like Two Sigma or Citadel lies in their data infrastructure—massive computing power, real-time analytics, and AI-driven prediction models. These technological tools enable them to extract tiny profits millions of times per day.
10. Secrecy and Regulation
Hedge funds are notoriously secretive about their strategies. Their competitive advantage depends on keeping algorithms, models, and data confidential. Unlike mutual funds, they are not required to disclose holdings publicly. Investors receive quarterly or annual reports, but details remain hidden to protect intellectual property.
However, after major scandals and financial crises, regulators have increased oversight. The U.S. Securities and Exchange Commission (SEC) now requires large hedge funds to register and disclose basic information about risk and leverage. Yet, compared to other financial institutions, they still enjoy considerable privacy.
11. Hedge Funds and Market Influence
Though they represent a small portion of total global assets, hedge funds have an outsized impact on financial markets due to their leverage and trading volume. They can:
Move markets through large positions.
Provide liquidity during volatile times.
Expose overvalued or fraudulent companies (through short selling).
Hedge institutional portfolios against systemic risks.
However, their power can also destabilize markets if excessive leverage or herd behavior occurs—as seen during the 2008 crisis or the GameStop short squeeze of 2021.
12. The Dark Side: Failures and Risks
Not all hedge funds are successful. Many close within a few years due to poor performance, high fees, or changing market conditions. Common causes of failure include:
Over-leverage: excessive borrowing leading to collapse.
Overconfidence: ignoring market signals.
Lack of liquidity: inability to exit positions in time.
Misaligned incentives: managers chasing bonuses over long-term success.
The hedge fund secret to survival is adaptability—those that continuously evolve with technology, regulation, and global trends endure.
13. The Future of Hedge Funds
The hedge fund industry is changing rapidly. Artificial intelligence, blockchain, and decentralized finance (DeFi) are reshaping investment strategies. Investors are demanding lower fees and greater transparency, pushing funds to prove their value.
Sustainability is also becoming important. New hedge funds now explore ESG (Environmental, Social, Governance) strategies, blending profitability with ethical investing.
The next generation of hedge funds will likely combine AI-driven insights, quantitative analytics, and global macro intelligence—a fusion of technology and human expertise.
Conclusion
Hedge funds remain one of the most fascinating institutions in modern finance. Their “secrets” are not mystical tricks but a blend of flexibility, innovation, information, and discipline. They thrive on uncovering inefficiencies in the global financial system, exploiting them with speed, intelligence, and precision.
At their best, hedge funds bring liquidity, innovation, and market efficiency. At their worst, they amplify volatility and risk. The truth lies in their dual nature—both as engines of progress and mirrors of financial ambition.
In the end, the ultimate hedge fund secret is mastery over uncertainty—turning chaos into opportunity through knowledge, technology, and courage.

ESG Investing and Green FinanceIntroduction
In the 21st century, global finance has undergone a profound transformation. Investors, corporations, and governments are increasingly recognizing that economic growth must go hand in hand with environmental protection, social responsibility, and ethical governance. This shift has given rise to two major trends — ESG (Environmental, Social, and Governance) investing and Green Finance. Both concepts aim to align financial decision-making with sustainability goals, addressing global challenges such as climate change, inequality, and responsible corporate behavior. ESG investing and Green Finance are not just moral imperatives; they are strategic approaches that seek long-term value creation, risk management, and the transition to a low-carbon economy.
1. Understanding ESG Investing
ESG investing refers to an investment strategy that incorporates environmental, social, and governance factors into financial analysis and portfolio management. It goes beyond traditional financial metrics by assessing how companies manage sustainability-related risks and opportunities.
Environmental criteria evaluate how a company impacts the planet — through carbon emissions, waste management, water usage, renewable energy adoption, and biodiversity protection.
Social criteria examine how a company treats people — including employees, customers, suppliers, and local communities. It focuses on labor rights, diversity, equality, workplace safety, and human rights.
Governance criteria assess corporate ethics, transparency, board diversity, executive compensation, and shareholder rights.
In essence, ESG investing combines profitability with purpose, allowing investors to generate financial returns while contributing to positive social and environmental outcomes.
2. Evolution and Growth of ESG Investing
The origins of ESG investing can be traced back to socially responsible investing (SRI) movements of the 1960s and 1970s. Activist investors avoided industries such as tobacco, weapons, or apartheid-linked businesses. However, ESG investing evolved beyond exclusionary screening to focus on proactive investment in sustainable and responsible companies.
A significant milestone occurred in 2006, when the United Nations launched the Principles for Responsible Investment (UNPRI), encouraging institutional investors to integrate ESG principles into their investment decisions. Since then, ESG investing has grown exponentially.
By 2025, the global ESG assets under management (AUM) are projected to exceed $50 trillion, representing more than one-third of total global assets. Major asset managers like BlackRock, Vanguard, and Fidelity have incorporated ESG frameworks into their portfolios, while ESG-focused funds have outperformed traditional funds in many market cycles, particularly during crises such as the COVID-19 pandemic.
3. Key Components of ESG
(a) Environmental Factors
Environmental aspects are central to ESG investing. Investors assess a company’s carbon footprint, energy efficiency, waste disposal practices, and compliance with environmental laws. For instance, companies that transition toward renewable energy sources or adopt circular economy principles are considered environmentally sustainable.
Important sub-factors include:
Greenhouse gas (GHG) emissions and carbon neutrality goals
Renewable energy investment
Water conservation and pollution control
Sustainable supply chains
Biodiversity preservation
For example, Tesla and Ørsted attract ESG investors for their leadership in clean energy and low-carbon technologies.
(b) Social Factors
The social dimension emphasizes a company’s treatment of people and communities. This includes fair labor practices, human rights, product safety, customer privacy, and diversity initiatives. A company’s reputation and long-term success often depend on social responsibility and stakeholder trust.
Key areas include:
Employee welfare and workplace safety
Gender and racial diversity in leadership
Consumer protection and ethical marketing
Community development programs
Supply chain ethics
Firms like Unilever and Patagonia are known for integrating social responsibility into their corporate strategy, enhancing both brand loyalty and long-term profitability.
(c) Governance Factors
Governance ensures accountability, transparency, and ethical leadership. It involves assessing how decisions are made within an organization and whether management aligns with shareholders’ and stakeholders’ interests.
Governance evaluation considers:
Board composition and independence
Executive pay and accountability
Anti-corruption policies
Shareholder voting rights
Ethical corporate conduct
Poor governance can lead to scandals and losses, as seen in corporate collapses like Enron or Wirecard, where lack of oversight and transparency destroyed investor confidence.
4. ESG Investing Strategies
Investors use several methods to implement ESG principles:
Negative Screening: Excluding companies involved in harmful industries (e.g., fossil fuels, tobacco, or weapons).
Positive Screening: Selecting companies that perform better on ESG metrics than their peers.
Best-in-Class Approach: Investing in the most sustainable companies within each sector.
Thematic Investing: Focusing on specific sustainability themes such as renewable energy, clean water, or gender equality.
Impact Investing: Targeting measurable social and environmental outcomes alongside financial returns.
ESG Integration: Incorporating ESG data into traditional financial analysis to evaluate overall risk-adjusted returns.
These approaches allow investors to align their portfolios with their values and long-term sustainability goals.
5. Importance and Benefits of ESG Investing
ESG investing offers multiple advantages to investors, businesses, and society.
Risk Mitigation: Companies with strong ESG performance tend to manage risks better, reducing exposure to legal, environmental, and reputational crises.
Financial Performance: Numerous studies show a positive correlation between ESG integration and long-term financial returns. Sustainable firms are often more efficient, innovative, and resilient.
Investor Demand: Younger generations, especially Millennials and Gen Z, increasingly prefer ethical investments that align with their values.
Regulatory Support: Governments and regulators are promoting ESG disclosures, creating an environment where sustainability becomes a necessity rather than a choice.
Corporate Reputation: Strong ESG performance enhances brand image, attracting customers, investors, and top talent.
6. Understanding Green Finance
While ESG investing focuses on evaluating sustainability within investments, Green Finance refers to financial instruments and services that directly support environmentally beneficial projects. It aims to mobilize capital toward green initiatives that promote climate resilience, energy efficiency, and ecological sustainability.
Green Finance includes a wide range of products such as:
Green Bonds – bonds issued to finance renewable energy, clean transportation, and waste management projects.
Green Loans – loans with favorable terms for sustainable projects.
Green Mutual Funds and ETFs – investment funds focusing on companies or projects that meet environmental standards.
Carbon Markets and Credits – mechanisms that incentivize emissions reduction.
Sustainable Insurance and Banking – financial institutions offering eco-friendly products and services.
In essence, Green Finance channels money into projects that contribute to a low-carbon and sustainable future.
7. The Rise of Green Finance Globally
Green finance gained global recognition after the 2015 Paris Agreement, which called for aligning financial systems with climate goals. The agreement encouraged nations to mobilize trillions of dollars in climate finance to limit global warming to below 2°C.
Leading economies such as the European Union, China, and the United States have established green finance frameworks.
The EU Green Deal and EU Taxonomy for Sustainable Activities provide a clear classification system for green investments.
China’s Green Bond Endorsed Project Catalogue guides green bond issuance and has made China one of the largest green bond markets globally.
Multilateral institutions such as the World Bank and Asian Development Bank support developing nations in adopting green finance principles.
According to the Climate Bonds Initiative, global green bond issuance surpassed $600 billion in 2023, signaling the growing importance of sustainability-linked finance.
8. Relationship Between ESG Investing and Green Finance
While both concepts share sustainability as their foundation, they differ in scope and application.
ESG investing focuses on evaluating corporate behavior and integrating sustainability into investment decisions across all industries.
Green Finance specifically directs capital toward projects that have clear environmental benefits.
However, the two are interconnected. ESG investors often allocate capital to green financial instruments, while green finance initiatives rely on ESG metrics to ensure accountability and transparency. Together, they form the backbone of sustainable finance, promoting a more inclusive and climate-conscious global economy.
9. Challenges in ESG Investing and Green Finance
Despite their growth, both ESG investing and green finance face several challenges:
Lack of Standardization: Different countries and rating agencies use varied ESG criteria, leading to inconsistent assessments and “greenwashing.”
Greenwashing Risks: Some companies exaggerate their sustainability claims to attract investors without actual environmental commitment.
Data Availability: Reliable ESG data and performance metrics are limited, especially in developing markets.
Short-Term Investor Mindset: Many investors prioritize short-term gains over long-term sustainability impacts.
Regulatory Barriers: Inconsistent regulations across jurisdictions make it difficult to measure and compare ESG performance globally.
Transition Costs: Shifting to sustainable business models requires upfront investments that may deter smaller firms.
Addressing these challenges requires global cooperation, transparent reporting, and strong regulatory frameworks.
10. The Future of ESG and Green Finance
The future of finance is undeniably green and responsible. Governments, institutions, and individuals are realizing that sustainability is essential for economic resilience and planetary survival. Key future trends include:
Mandatory ESG Disclosure: Regulators in the EU, India, and the US are introducing compulsory ESG reporting standards for corporations.
Technology Integration: Artificial intelligence, blockchain, and big data analytics are improving ESG measurement and transparency.
Sustainable Development Goals (SDGs): ESG investing and green finance will play vital roles in achieving the United Nations’ 17 SDGs by 2030.
Green Central Banking: Central banks are increasingly integrating climate risks into monetary policies and lending frameworks.
Emerging Market Participation: Developing countries are adopting green finance to address energy transitions and attract foreign investment.
Ultimately, ESG and green finance are not temporary trends — they represent a long-term transformation of the global financial system.
Conclusion
ESG investing and Green Finance have redefined how the world views the relationship between money, ethics, and the environment. They demonstrate that profitability and sustainability can coexist, driving innovation, resilience, and inclusive growth. As climate change intensifies and social challenges persist, the role of finance as a catalyst for sustainable development has never been more crucial.
By integrating ESG principles and promoting green financial instruments, investors and policymakers can pave the way toward a more sustainable, equitable, and prosperous global economy. The future belongs to those who not only generate wealth but also protect the planet and uplift society — a vision where finance serves humanity, not just profits.

WTO, IMF, and World Bank: Their Role in Global TradingIntroduction
In the 21st century, global trade stands as one of the strongest pillars of economic growth, development, and interdependence among nations. The expansion of international trade has led to greater efficiency, technology transfer, and global prosperity. However, this complex network of trade relationships requires rules, institutions, and financial frameworks to ensure stability and fairness. Three major global institutions play vital roles in shaping, regulating, and supporting global trade — the World Trade Organization (WTO), the International Monetary Fund (IMF), and the World Bank. Together, these institutions form the backbone of the international economic system, influencing trade policies, providing financial assistance, and fostering global economic stability.
1. The World Trade Organization (WTO)
1.1 Background and Objectives
The World Trade Organization was established in 1995, succeeding the General Agreement on Tariffs and Trade (GATT), which had been in place since 1948. The primary objective of the WTO is to facilitate smooth and fair international trade by reducing trade barriers, resolving disputes, and ensuring compliance with trade agreements. It currently has 164 member countries, representing over 98% of world trade.
The WTO’s mission is to create a rules-based international trading system where goods and services can move freely across borders under agreed-upon regulations. Its guiding principles include non-discrimination, transparency, fair competition, and progressive liberalization.
1.2 Key Functions of the WTO
Trade Negotiations –
The WTO serves as a platform for member nations to negotiate trade agreements. Through rounds of negotiations, such as the Doha Development Round, the WTO works to reduce tariffs, subsidies, and other trade barriers. These negotiations aim to create a more inclusive trading environment, especially for developing countries.
Trade Dispute Settlement –
One of the WTO’s most important functions is to resolve trade disputes among member countries. The Dispute Settlement Body (DSB) ensures that trade conflicts are addressed fairly and according to international law. For instance, disputes between the United States and China or between the European Union and India are handled under the WTO’s structured dispute resolution mechanism.
Trade Policy Monitoring –
The WTO regularly monitors the trade policies of its member nations to ensure transparency and compliance with agreed rules. This surveillance helps prevent protectionist measures that could disrupt global trade.
Capacity Building and Technical Assistance –
The WTO provides technical assistance to developing and least-developed countries to help them understand and implement trade agreements. This support allows them to participate more effectively in global markets.
1.3 WTO’s Impact on Global Trade
The WTO has contributed to significant growth in international trade. Since its establishment, global trade volumes have more than quadrupled, promoting economic integration and reducing poverty in many countries. By reducing tariffs and promoting open markets, the WTO encourages specialization and comparative advantage, leading to efficient resource allocation.
However, the WTO has faced criticism. Many argue that it favors developed countries and multinational corporations, while developing nations struggle with complex regulations. The slow progress of trade negotiations and disputes over agricultural subsidies have also limited its effectiveness. Nevertheless, the WTO remains an indispensable platform for global economic cooperation.
2. The International Monetary Fund (IMF)
2.1 Background and Objectives
The International Monetary Fund (IMF) was established in 1944 during the Bretton Woods Conference, with the main goal of ensuring global monetary stability. Headquartered in Washington D.C., the IMF’s primary mandate is to promote international monetary cooperation, facilitate balanced growth of trade, and maintain exchange rate stability.
Trade and finance are deeply interconnected. Stable exchange rates and sound macroeconomic conditions are essential for smooth global trade. Therefore, the IMF’s role in maintaining financial stability directly supports global commerce.
2.2 Key Functions of the IMF
Surveillance and Policy Advice –
The IMF monitors the global economy and the economic performance of its member countries through regular assessments called Article IV consultations. This helps identify potential risks that could affect international trade, such as inflation, fiscal imbalances, or currency instability. The IMF provides policy advice to correct these imbalances and promote stable growth.
Financial Assistance –
The IMF provides loans to countries facing balance of payments crises—situations where they cannot meet their international payment obligations. By offering temporary financial support, the IMF helps nations stabilize their economies and avoid measures that might restrict trade, such as import bans or currency devaluations.
Capacity Development –
The IMF also assists member countries in building institutional and human capacity. Through training programs, it strengthens countries’ abilities to design and implement effective fiscal and monetary policies, which are crucial for stable trade relations.
2.3 IMF’s Role in Global Trade
The IMF contributes to global trade in several ways:
Maintaining Currency Stability: Stable exchange rates make international trade predictable and reduce transaction risks.
Preventing Financial Crises: By providing early warnings and financial aid, the IMF helps prevent crises that could disrupt trade flows.
Supporting Developing Economies: The IMF’s financial support allows developing countries to stabilize their economies and continue participating in global trade.
2.4 Criticism and Challenges
While the IMF plays a vital role in stabilizing global finance, it has been criticized for imposing strict austerity measures as conditions for its loans. These policies sometimes lead to reduced public spending and social unrest in borrowing countries. Critics also argue that the IMF’s decision-making structure favors developed nations, particularly the United States and Europe, due to their larger voting shares.
Despite these challenges, the IMF remains crucial for promoting monetary stability and supporting global trade resilience during financial crises, as seen during the 2008 Global Financial Crisis and the COVID-19 pandemic.
3. The World Bank
3.1 Background and Objectives
The World Bank, also established in 1944 at Bretton Woods, was created to assist in the reconstruction of war-torn Europe and promote long-term economic development. Over time, its focus shifted toward poverty reduction, infrastructure development, and sustainable economic growth, particularly in developing countries.
The World Bank consists of two main institutions:
The International Bank for Reconstruction and Development (IBRD)
The International Development Association (IDA)
Together, they provide loans, grants, and technical assistance to support development projects worldwide.
3.2 Functions of the World Bank in Global Trade
Infrastructure Development –
The World Bank funds projects such as ports, highways, railways, and energy systems that are critical for trade. Efficient infrastructure reduces transportation costs and enhances trade competitiveness.
Trade Facilitation and Policy Reform –
The World Bank assists countries in modernizing their trade policies, improving customs systems, and reducing non-tariff barriers. It also supports reforms that make it easier for businesses to export and import goods.
Capacity Building and Knowledge Sharing –
The World Bank provides technical expertise and training to help countries strengthen institutions, adopt digital trade systems, and integrate into global value chains.
Financing for Development Projects –
Through long-term, low-interest loans, the World Bank helps developing countries finance projects that enhance productivity, such as education, technology, and agriculture — all of which indirectly boost trade competitiveness.
3.3 World Bank’s Impact on Global Trade
The World Bank’s initiatives have enabled many developing economies to become more competitive in the global market. For instance, its investments in infrastructure across Asia and Africa have reduced trade costs and improved access to markets. Additionally, the World Bank promotes sustainable trade by supporting environmentally friendly and inclusive growth.
However, like the IMF, the World Bank has faced criticism. Some argue that its projects have led to environmental degradation or displacement of local communities. Others believe it often promotes a one-size-fits-all economic model influenced by Western ideologies. Despite these concerns, the World Bank remains an essential engine for trade-driven development.
4. Interconnection Between WTO, IMF, and World Bank
Although these three institutions have distinct mandates, they work interdependently to support the global trading system.
The WTO establishes the rules of international trade.
The IMF ensures monetary stability, providing the financial foundation for trade.
The World Bank finances development projects that enhance countries’ capacity to trade.
For instance, a developing country seeking to expand exports may rely on the World Bank for infrastructure funding, the IMF for macroeconomic stabilization, and the WTO for market access through fair trade rules.
In 1996, these institutions signed an agreement to enhance cooperation and information sharing, ensuring that their policies complement each other in promoting global growth.
5. Challenges and Future Outlook
The global trading landscape is rapidly evolving due to factors such as technological change, climate change, geopolitical tensions, and protectionism. Institutions like the WTO, IMF, and World Bank face growing pressure to adapt.
The WTO needs to reform its dispute settlement system and address new issues such as digital trade, e-commerce, and intellectual property.
The IMF must strengthen its support for low-income countries and incorporate climate-related risks into its financial assessments.
The World Bank should enhance its role in financing green infrastructure and ensuring that development benefits are equitably distributed.
In the future, stronger cooperation among these institutions will be crucial for addressing global inequalities and promoting sustainable trade.
Conclusion
The WTO, IMF, and World Bank together form the institutional framework that underpins the global trading system. The WTO establishes and enforces trade rules, ensuring fairness and predictability. The IMF provides financial stability by managing exchange rates and supporting economies during crises. The World Bank focuses on long-term development, financing the infrastructure and reforms necessary for countries to engage effectively in global trade.
While each institution faces criticism and operational challenges, their combined efforts have been instrumental in expanding international trade, fostering economic growth, and reducing poverty. As the world continues to navigate challenges such as digital transformation, climate change, and inequality, the coordinated efforts of these institutions will remain essential to maintaining a stable, fair, and prosperous global trading environment.
G7 and G20 in the World Market: A Comprehensive OverviewIntroduction
In the ever-evolving landscape of the global economy, two powerful international groups — the Group of Seven (G7) and the Group of Twenty (G20) — play a pivotal role in shaping global financial policies, trade frameworks, and market stability. These organizations consist of the world’s most influential economies, both advanced and emerging, that come together to coordinate policy responses to global challenges.
Their influence extends across economic growth, climate action, trade regulations, technology, and geopolitical stability — all of which have profound effects on the world market. This essay explores the formation, structure, objectives, and economic impact of the G7 and G20, while also examining their comparative roles in global governance and market coordination.
1. The G7: Origins and Evolution
1.1 Historical Background
The Group of Seven (G7) was formed in 1975 amid the oil crisis and global financial instability of the 1970s. The initial members were the United States, United Kingdom, France, Germany, Italy, and Japan, with Canada joining in 1976, making it seven nations. The European Union (EU) later became a participant in G7 meetings but not a full member.
Initially, the G7 served as an informal forum for leaders of advanced economies to discuss economic coordination and policy responses to inflation, exchange rates, and oil shocks. Over time, the agenda expanded to include trade liberalization, development aid, climate change, digital innovation, and global security.
1.2 Composition and Characteristics
The G7 countries collectively represent:
Around 45% of global GDP (as of 2025),
Approximately 10% of the global population, and
A major share of global trade, technology, and financial capital.
These nations are highly industrialized, democratic, and share values of free-market capitalism, human rights, and rule-based governance.
The G7 does not have a formal secretariat or permanent institution. Instead, it operates through annual summits hosted by member nations on a rotating basis. Decisions are not legally binding but carry immense political and economic weight due to the influence of its members.
1.3 Core Objectives
The main objectives of the G7 are to:
Promote global economic stability and sustainable growth.
Coordinate monetary and fiscal policies among advanced economies.
Support developing nations through aid and debt relief.
Strengthen free trade and oppose protectionism.
Address climate change and energy transitions.
Manage global crises such as pandemics, conflicts, and financial shocks.
1.4 G7’s Role in the Global Market
The G7 shapes the global market primarily through policy influence rather than direct control. Its discussions often set the tone for international financial institutions like the IMF, World Bank, and WTO.
For instance:
Monetary coordination: Central banks of G7 nations often align on interest rate policies and inflation control.
Trade frameworks: The G7 promotes rules-based trade and opposes protectionist barriers.
Climate finance: Members pledge billions to help developing countries transition to clean energy.
Crisis management: The G7 coordinated the global financial response to the 2008 crisis and the 2020 pandemic.
Because these economies dominate global financial systems — with the U.S. dollar, euro, pound, and yen as key reserve currencies — their decisions have direct impacts on currency markets, investment flows, and commodity prices.
2. The G20: Formation and Global Reach
2.1 Background and Formation
While the G7 represents advanced industrial economies, the G20 (Group of Twenty) was created in 1999 to bring emerging and developing economies into global decision-making. The Asian financial crisis of 1997–1998 exposed the need for a broader, more inclusive framework that could address interconnected global risks.
The G20 includes 19 countries plus the European Union, representing both advanced and emerging economies such as China, India, Brazil, South Africa, Mexico, Indonesia, Saudi Arabia, and others. Together, G20 members account for:
Over 85% of global GDP,
Around 75% of global trade, and
About two-thirds of the world’s population.
2.2 Structure and Operation
Like the G7, the G20 has no permanent secretariat. It functions through:
Annual Leaders’ Summits,
Finance Ministers and Central Bank Governors’ Meetings, and
Working groups on topics like climate, digital economy, health, and labor.
The presidency rotates annually, with the host nation setting the year’s agenda. For example:
India (2023) focused on “One Earth, One Family, One Future.”
Brazil (2024) emphasized sustainable growth and inclusive development.
2.3 Objectives of the G20
The G20’s mission is broader and more inclusive than the G7’s. Its key objectives include:
Promoting global economic stability and growth.
Ensuring financial market regulation to prevent crises.
Encouraging international trade and investment.
Addressing climate change and sustainable development.
Reducing global inequality and supporting low-income nations.
Enhancing digitalization and innovation in the global economy.
The G20’s broader membership allows it to address issues that affect both developed and developing nations, making it more representative of global interests.
3. The G7 and G20’s Influence on the World Market
3.1 Monetary and Fiscal Coordination
Both the G7 and G20 play a crucial role in coordinating monetary and fiscal policies. During crises like the 2008 Global Financial Crisis, the G20 facilitated coordinated stimulus packages that prevented a deeper recession. Similarly, during the COVID-19 pandemic, both groups supported liquidity programs and vaccine funding initiatives.
Such coordination stabilizes global capital markets, reduces exchange rate volatility, and boosts investor confidence.
3.2 Trade and Investment
The G20 has become the key platform for promoting open and fair trade. It supports WTO reforms, encourages global value chains, and resists protectionism. Emerging economies like India, China, and Brazil have gained greater influence in shaping international trade rules.
The G7, while smaller, continues to influence trade through strategic alliances, sanctions, and technological cooperation. Their joint efforts shape policies on digital trade, semiconductor supply chains, and energy transition — all of which significantly affect global stock and commodity markets.
3.3 Global Financial Regulation
After the 2008 crisis, the G20 spearheaded reforms in global financial regulation through institutions like the Financial Stability Board (FSB). This helped improve transparency, banking supervision, and systemic risk management.
The G7, meanwhile, remains influential in setting standards for banking supervision, anti-money laundering (AML), and cross-border taxation, affecting multinational corporations and global investors.
3.4 Sustainable Development and Climate Change
Both groups have prioritized sustainable growth.
The G7 commits to achieving net-zero emissions by 2050 and financing climate initiatives in developing nations.
The G20 promotes green finance, renewable energy investment, and the phasing out of fossil fuel subsidies.
As climate-related risks increasingly affect agriculture, manufacturing, and infrastructure, these commitments influence global commodity prices, investment trends, and corporate valuations.
3.5 Technology and Digital Economy
In the digital era, both G7 and G20 discussions address issues like artificial intelligence (AI), cybersecurity, data privacy, and digital taxation. Their cooperation helps create common standards that shape global tech markets and innovation ecosystems.
For example, the G7’s Digital Trade Principles and the G20’s AI frameworks guide how countries regulate cross-border data and digital platforms — crucial in a world where tech firms dominate market capitalization.
3.6 Geopolitical Stability and Market Confidence
Geopolitical tensions — such as the Russia-Ukraine war or U.S.-China rivalry — have significant global market consequences. The G7 often coordinates sanctions, defense support, and diplomatic pressure, while the G20 acts as a broader dialogue platform to prevent fragmentation.
Their coordinated responses help maintain market predictability, protect energy supply chains, and influence investor sentiment.
4. Criticisms and Challenges
Despite their global importance, both G7 and G20 face criticisms:
4.1 Representation Gap
The G7 is criticized for being elitist, representing only advanced nations.
The G20, while more inclusive, still excludes many smaller developing countries.
4.2 Implementation Challenges
Decisions made in summits are not legally binding, making implementation dependent on national will.
4.3 Geopolitical Divisions
Internal divisions — such as tensions between the U.S. and China or Russia’s participation in G20 — can reduce policy effectiveness.
4.4 Climate and Inequality Gaps
Although both groups pledge climate and development aid, actual disbursement often falls short of commitments, leading to credibility issues.
5. The Future of G7 and G20 in Global Governance
As globalization evolves, the G7 and G20 are expected to adapt to new challenges:
Managing the AI-driven economy and digital finance.
Addressing supply chain resilience post-pandemic.
Coordinating on debt restructuring for developing nations.
Ensuring energy security amid green transitions.
Promoting inclusive and equitable growth to reduce inequality.
Their relevance lies in their ability to bridge the gap between advanced and developing economies and create a stable, rule-based global market that fosters sustainable progress.
Conclusion
The G7 and G20 are twin pillars of international economic governance, each with distinct strengths. The G7 provides leadership and stability through the advanced economies’ policy coordination, while the G20 ensures inclusivity and representation of emerging markets in global decision-making.
Together, they form the foundation of global cooperation — influencing trade policies, financial systems, environmental sustainability, and technological standards that shape the world market. As global interdependence deepens, their ability to collaborate and implement forward-looking policies will determine the resilience and prosperity of the international economy in the decades ahead.
Venture Capital’s Global MarketStructure, Trends, and Future Outlook.
Introduction
Venture capital (VC) represents one of the most vital pillars of the global innovation ecosystem. It is a form of private equity financing provided to early-stage, high-potential startups that demonstrate significant growth opportunities. Unlike traditional bank loans or public funding, venture capitalists invest in companies with innovative ideas, disruptive technologies, or scalable business models, taking on high risk in exchange for potentially high returns. Over the past few decades, the global venture capital market has evolved from a niche segment concentrated in Silicon Valley to a worldwide force shaping technology, entrepreneurship, and job creation.
Concept and Characteristics of Venture Capital
Venture capital involves professional investors or investment firms providing funding to startups and small businesses that lack access to capital markets. The typical VC investment model follows several stages of financing:
Seed Stage – The initial capital used for research, product development, or prototype creation.
Early Stage (Series A/B) – Investment to commercialize the product, expand teams, and begin scaling operations.
Growth Stage (Series C and beyond) – Large funding rounds to accelerate market expansion, often preceding IPOs or acquisitions.
Exit Stage – The investor realizes returns through Initial Public Offerings (IPOs), mergers, or acquisitions.
Key Characteristics
High Risk, High Reward: Most startups fail, but the few that succeed can deliver exponential returns.
Equity Participation: Venture capitalists receive ownership shares in the company, aligning their success with the startup’s performance.
Active Involvement: Investors provide not just capital but also mentorship, strategic guidance, and access to networks.
Long-Term Horizon: Investments typically take 5–10 years to mature before exit.
Innovation Focus: VC funding often targets technology, biotechnology, fintech, clean energy, and AI sectors.
Historical Background of Venture Capital
The origins of venture capital can be traced to post–World War II America. The first modern VC firm, American Research and Development Corporation (ARDC), was founded in 1946 by Georges Doriot, who invested in emerging technology companies. The concept gained momentum in the 1970s and 1980s with the growth of Silicon Valley, where early investments in companies like Apple, Intel, and Genentech yielded massive returns.
By the 1990s, the venture capital model had become central to the rise of the dot-com boom, fueling startups such as Amazon, Google, and Yahoo. Despite the 2000 dot-com crash, VC continued to evolve globally, with increased participation from institutional investors, sovereign wealth funds, and corporate venture arms.
In the 2010s and 2020s, VC funding surged across the world due to the digital revolution, mobile technology, cloud computing, and artificial intelligence. Today, venture capital is not just an American phenomenon — it’s a global investment engine, driving innovation from Silicon Valley to Singapore.
Global Market Overview
Market Size and Growth
As of 2025, the global venture capital market is estimated to be worth over USD 450 billion, with annual investments spread across thousands of startups worldwide. The U.S. remains the largest market, followed by China, India, the United Kingdom, Germany, and Israel. Emerging markets such as Southeast Asia, Africa, and Latin America are also gaining traction as venture ecosystems mature.
Regional Breakdown
1. North America
The United States dominates the global VC landscape, accounting for nearly 45–50% of global deal volume. Silicon Valley, New York, and Boston remain the top hubs. U.S. venture capital firms like Sequoia Capital, Andreessen Horowitz, Accel, and Kleiner Perkins have invested in global tech giants such as Meta, Airbnb, and Stripe. The U.S. ecosystem benefits from deep capital markets, strong intellectual property laws, and a culture of entrepreneurship.
2. Europe
Europe’s VC market has grown steadily, particularly in London, Berlin, Paris, and Stockholm. The continent’s focus on sustainability, fintech, and deep tech has attracted large institutional investors. The EU’s supportive regulatory framework and cross-border funding programs like Horizon Europe have accelerated innovation.
3. Asia-Pacific
Asia has emerged as a powerful VC hub, led by China and India.
China boasts a vibrant ecosystem with giants like Tencent, Alibaba, and ByteDance born from VC funding.
India has become one of the world’s fastest-growing VC destinations, with firms like SoftBank, Tiger Global, and Nexus Venture Partners backing unicorns such as Flipkart, Zomato, and Ola.
Southeast Asia, particularly Singapore and Indonesia, has seen rapid digitalization and strong startup activity in fintech and e-commerce.
4. Middle East and Africa
These regions are witnessing rising VC activity due to government initiatives like Saudi Arabia’s Vision 2030 and UAE’s innovation hubs. In Africa, fintech startups such as Flutterwave and Chipper Cash have attracted global investors, signaling the continent’s increasing integration into global venture markets.
5. Latin America
Latin America’s VC market is driven by growth in fintech, e-commerce, and logistics. Countries like Brazil, Mexico, and Colombia are hotspots, with startups like Nubank and Rappi becoming unicorns through strong VC backing.
Major Sectors Attracting Venture Capital
Technology and Software – Cloud computing, cybersecurity, and SaaS models dominate global VC investment.
Fintech – Mobile banking, digital wallets, blockchain, and decentralized finance (DeFi) attract billions in funding annually.
Healthcare and Biotech – The COVID-19 pandemic accelerated investment in telemedicine, genomics, and digital health.
Artificial Intelligence and Machine Learning – AI-driven startups receive major backing for automation, analytics, and robotics solutions.
Clean Energy and Sustainability – Green tech and ESG-focused startups are gaining VC attention amid climate change concerns.
Consumer Internet and E-commerce – Platforms that improve digital lifestyles, logistics, and online retail remain favorites.
EdTech and AgriTech – Education and agriculture technology are expanding rapidly in emerging markets like India and Africa.
Key Players in the Global VC Ecosystem
Venture Capital Firms – Examples include Sequoia Capital, Andreessen Horowitz, Index Ventures, SoftBank Vision Fund, Tiger Global, and Accel.
Corporate Venture Arms – Tech giants like Google (GV), Intel Capital, Salesforce Ventures, and Microsoft Ventures invest strategically in startups aligned with their business goals.
Sovereign Wealth and Pension Funds – Entities such as Temasek, Mubadala, and SoftBank Vision Fund deploy billions in global VC markets.
Angel Investors and Syndicates – Early-stage capital often comes from high-net-worth individuals like Elon Musk or Peter Thiel, and from crowdfunding platforms such as AngelList.
Accelerators and Incubators – Organizations like Y Combinator, Techstars, and 500 Global provide seed funding and mentorship to early-stage startups.
Funding Trends and Investment Strategies
Venture capital investment strategies have evolved from traditional staged financing to more dynamic, data-driven approaches. Modern VC firms use AI-based analytics, market intelligence platforms, and network-based due diligence to identify high-potential startups faster.
Recent Global Trends
Mega-Funding Rounds: Multi-billion-dollar deals are becoming common for late-stage startups, especially in fintech and AI.
Rise of Micro VCs: Small, specialized funds are targeting niche markets such as climate tech or women-led startups.
Corporate Venture Growth: Large corporations are increasingly investing in startups to stay innovative and competitive.
Geographic Diversification: Investors are expanding into emerging markets for higher returns and untapped potential.
Decentralized Finance and Blockchain Startups: Web3 and crypto-based ventures have become new frontiers for VC investment.
ESG Integration: Environmental, social, and governance considerations are now embedded in investment decisions.
Challenges in the Global Venture Capital Market
Despite its dynamism, the VC ecosystem faces several obstacles:
Market Volatility: Global economic slowdowns, high interest rates, and inflation affect startup valuations and funding availability.
High Failure Rate: Over 70% of VC-backed startups fail to provide significant returns.
Exit Constraints: IPO markets fluctuate, and mergers or acquisitions can be delayed, limiting liquidity.
Regulatory Barriers: Varying legal frameworks across countries complicate cross-border investments.
Overvaluation and Speculation: Some markets witness inflated valuations due to excessive competition among investors.
Talent and Resource Constraints: Startups in developing economies often struggle with limited skilled labor and infrastructure.
Geopolitical Risks: Trade tensions, war, and political instability can disrupt global VC flows.
The Role of Technology in Shaping VC
Technology has fundamentally transformed how venture capital operates.
AI and Machine Learning help investors analyze startup potential through predictive modeling.
Blockchain ensures transparency in funding transactions and introduces new financing models like tokenized equity.
Big Data Analytics improves decision-making by tracking industry trends, founder success rates, and market behavior.
Digital Platforms such as Crunchbase, PitchBook, and CB Insights make VC data accessible and efficient.
Moreover, remote investing has become common since the COVID-19 pandemic, allowing global investors to fund startups without geographic barriers.
Economic and Social Impact of Venture Capital
Venture capital has played a crucial role in driving global innovation, creating jobs, and improving quality of life.
VC-backed companies such as Google, Amazon, Tesla, and Airbnb have transformed industries and generated millions of jobs.
Venture funding encourages entrepreneurship and economic diversification.
In emerging markets, VC investment has contributed to digital inclusion and financial accessibility.
According to studies, VC-backed firms contribute significantly more to GDP growth and patent creation than non-VC-backed firms. Thus, venture capital not only drives profit but also social progress and technological evolution.
Future Outlook of Global Venture Capital
Looking ahead to 2030 and beyond, the global venture capital market is expected to expand further, though with increased selectivity and strategic depth.
Emerging Themes
Sustainable and Impact Investing: Funds will prioritize green, socially responsible, and inclusive ventures.
AI-Driven Investment Decisions: Predictive analytics will dominate deal sourcing and portfolio management.
Rise of Decentralized VC (DeVC): Blockchain-based VC models will democratize startup investing.
Cross-Border Collaboration: More funds will co-invest globally to share risk and access diverse innovation hubs.
Focus on Deep Tech: Quantum computing, robotics, space technology, and biotechnology will define the next innovation wave.
Government and Institutional Support: Policies promoting innovation, like tax incentives and startup visas, will expand VC’s reach.
While short-term challenges like valuation corrections and funding slowdowns may persist, the long-term trajectory of venture capital remains positive and transformative.
Conclusion
Venture capital serves as the financial lifeblood of innovation, bridging the gap between entrepreneurial vision and market reality. From its origins in postwar America to its modern global expansion across Asia, Europe, and Africa, VC has become a defining force in shaping the future of industries. Despite inherent risks and cyclical challenges, its impact on technological progress, economic development, and global competitiveness is undeniable.
As new technologies, emerging markets, and sustainability imperatives reshape the investment landscape, the venture capital industry will continue to adapt, innovate, and lead the charge toward a more dynamic, inclusive, and interconnected global economy.

Commodity Supercycle: Concept, Causes, and Global ImpactIntroduction
Commodities—such as oil, metals, agricultural products, and minerals—are the backbone of the global economy. They serve as essential inputs for industrial production, infrastructure development, and everyday consumption. However, unlike ordinary price fluctuations driven by short-term supply and demand changes, commodities sometimes experience prolonged periods of price booms and busts. These extended phases, often lasting decades, are known as commodity supercycles.
A commodity supercycle is a long-term trend during which prices of a wide range of commodities rise significantly above their long-term average, followed by a prolonged period of decline. These cycles are usually driven by massive structural shifts in the global economy—such as industrial revolutions, urbanization waves, technological breakthroughs, or geopolitical transformations—that create sustained demand for raw materials.
This essay explores the concept, historical examples, causes, consequences, and future outlook of commodity supercycles, highlighting their importance in shaping global economic trends.
1. Understanding the Concept of a Commodity Supercycle
A commodity supercycle is different from a normal business cycle or short-term commodity price movement. While a normal price cycle might last 2–8 years, a supercycle can extend for 20 to 40 years, characterized by long periods of rising and falling prices across multiple commodities.
In a typical supercycle:
The expansion phase witnesses strong global growth, industrialization, and urbanization, leading to increased demand for raw materials.
The peak phase occurs when demand and prices hit unsustainable highs.
The contraction phase begins when supply eventually catches up, and global economic growth slows.
The trough or bottom phase marks a prolonged period of low prices before the next upturn.
Supercycles involve broad-based commodity categories—such as energy (oil, gas, coal), metals (iron, copper, aluminum), and agricultural products (wheat, soybeans, corn). They are not limited to any single market but affect the entire global commodity complex.
2. Historical Commodity Supercycles
Economic historians have identified several commodity supercycles since the 19th century. Each was tied to a major transformation in industrial or technological development.
(a) The Industrial Revolution Supercycle (Late 19th Century)
The first recognized commodity supercycle occurred during the Industrial Revolution (1850s–1910s). Massive industrialization in Europe and the United States fueled unprecedented demand for coal, steel, iron, and agricultural goods. Urbanization and rail expansion intensified consumption, causing prices to rise across many commodities. However, as global production capacity expanded and industrial growth stabilized, prices eventually corrected.
(b) Post–World War II Supercycle (1940s–1970s)
The post-WWII reconstruction era marked another commodity boom. Rebuilding Europe and Japan required huge imports of oil, steel, and cement. The United States emerged as the dominant economic power, while infrastructure development surged worldwide. The 1950s and 1960s saw strong demand growth, but the 1970s oil crises and subsequent recessions ended the boom. By the late 1970s, high prices and energy shocks led to inflation, and the supercycle transitioned into a downturn.
(c) China-Led Supercycle (1998–2014)
The most significant modern supercycle began around the late 1990s, driven primarily by China’s rapid industrialization and urbanization. China’s entry into the World Trade Organization (WTO) in 2001 opened a new era of global trade and manufacturing. Massive infrastructure investment created immense demand for copper, iron ore, coal, and oil. Commodity exporters such as Brazil, Australia, and Russia benefited greatly.
By 2008, commodity prices had surged to record highs. Even after the global financial crisis, stimulus spending by China kept demand elevated until around 2014, when slowing Chinese growth and oversupply caused prices to collapse.
(d) Potential Green Energy Supercycle (2020s–2030s)
Many economists and analysts believe the world is currently at the beginning of a new commodity supercycle, this time driven by the global energy transition. The shift toward renewable energy, electric vehicles, and green technologies has increased demand for critical minerals such as lithium, cobalt, nickel, and copper. Simultaneously, supply constraints caused by underinvestment in mining and geopolitical tensions could sustain high prices in the years ahead.
3. Key Drivers of Commodity Supercycles
Commodity supercycles do not arise from random price surges. They are shaped by long-term macroeconomic and structural factors. The main drivers include:
(a) Industrialization and Urbanization
When countries undergo rapid industrialization, they require massive amounts of steel, cement, energy, and food to build infrastructure and support urban populations. Historical examples include the U.S. in the early 20th century and China in the early 21st century. Industrialization thus plays a central role in fueling supercycles.
(b) Technological and Structural Shifts
Major technological changes—such as the rise of automobiles, electrification, and digital industries—can increase the demand for specific commodities. For example, the current green energy revolution has boosted demand for battery metals and rare earth elements.
(c) Population Growth and Income Expansion
Rising populations and improving living standards in developing countries expand global consumption of food, energy, and consumer goods, increasing demand for base commodities.
(d) Supply Constraints and Resource Depletion
Unlike manufactured goods, commodities often face long lead times for production expansion. Opening new mines, oil wells, or farms takes years. When demand surges suddenly, supply cannot adjust immediately, pushing prices higher for extended periods.
(e) Global Monetary and Fiscal Policies
Periods of economic expansion often coincide with easy monetary policies, low interest rates, and high government spending—all of which can increase liquidity in commodity markets. Conversely, tighter monetary policies can end supercycles by reducing investment and consumption.
(f) Geopolitical Events
Wars, trade restrictions, sanctions, or political instability can disrupt supply chains and reduce production, contributing to higher prices. For instance, the Russia-Ukraine conflict in 2022 led to sharp increases in oil, gas, and grain prices.
4. Economic and Financial Implications of a Supercycle
Commodity supercycles have profound effects on the global economy, influencing everything from inflation to international relations.
(a) Impact on Commodity Exporters and Importers
Exporting nations (e.g., Australia, Brazil, Russia, Saudi Arabia) experience economic booms during commodity upswings, benefiting from higher revenues, employment, and foreign investment.
Importing nations (e.g., India, Japan, European countries) face inflationary pressures, higher production costs, and trade imbalances during the same periods.
(b) Inflation and Monetary Policy
Rising commodity prices contribute to cost-push inflation, prompting central banks to raise interest rates to stabilize prices. Conversely, when a supercycle ends and prices fall, deflationary pressures may emerge.
(c) Currency Movements
Commodity booms often strengthen the currencies of exporting countries, such as the Australian Dollar or Canadian Dollar, while weakening those of importers. This can alter global trade competitiveness.
(d) Investment and Speculation
Commodity supercycles attract speculative investment in commodity futures, mining stocks, and energy companies. During the 2000s, for example, institutional investors poured billions into commodity index funds, amplifying price trends.
(e) Environmental and Social Impacts
Sustained resource extraction can lead to deforestation, pollution, and social conflict in resource-rich regions. Balancing economic growth with environmental sustainability becomes a major policy challenge during a supercycle.
5. Indicators of an Emerging Supercycle
Economists monitor several indicators to identify potential supercycles:
Broad-based price increases across multiple commodities (not just one or two).
Structural demand shifts tied to technological or demographic changes.
Persistent supply bottlenecks due to underinvestment or geopolitical issues.
Rising capital expenditure in mining and energy sectors.
Global economic expansion led by industrial and infrastructure growth.
For example, from 2020 onward, prices of copper, lithium, nickel, and aluminum surged simultaneously—signaling early signs of a possible green-energy supercycle.
6. Challenges and Limitations
Despite their transformative impact, commodity supercycles are difficult to predict and manage.
(a) Volatility and Uncertainty
Commodity markets are extremely volatile. Unexpected events such as pandemics, wars, or policy shifts can reverse price trends abruptly.
(b) Overinvestment During Booms
High prices often encourage excessive investment in new capacity, leading to oversupply when demand slows—causing sharp downturns.
(c) Dependence on Global Growth
A supercycle depends heavily on sustained global economic growth. If major economies face recessions, commodity demand weakens rapidly.
(d) Environmental Transition Risks
While the green transition may drive a new supercycle, it also risks phasing out fossil fuels—potentially creating losses for countries and companies heavily invested in oil and coal.
7. The Future Outlook: Are We in a New Supercycle?
Analysts are divided on whether the world is entering a new commodity supercycle in the 2020s. Arguments for and against include:
In Favor:
Energy transition toward renewable technologies is boosting long-term demand for metals like copper, lithium, and nickel.
Underinvestment in mining and fossil fuel production over the past decade has constrained supply.
Geopolitical fragmentation is leading to supply chain disruptions and resource nationalism.
Fiscal stimulus and infrastructure spending in the U.S., India, and developing economies are supporting commodity demand.
Against:
Slowing global growth and technological efficiency may reduce long-term demand.
Recycling and circular economy models could limit raw material consumption.
Monetary tightening and higher interest rates could reduce speculative inflows.
Nevertheless, many experts believe the green transition and geopolitical realignments will sustain elevated commodity prices for the foreseeable future, marking the beginning of a structural uptrend akin to previous supercycles.
8. Conclusion
The concept of a commodity supercycle captures one of the most powerful long-term forces shaping global economic history. From the Industrial Revolution to China’s rise and the ongoing green energy transition, supercycles reflect humanity’s evolving relationship with natural resources.
Each supercycle brings both opportunities and challenges. For resource-rich nations, it offers economic prosperity and global influence. For import-dependent economies, it poses inflationary risks and policy dilemmas. Ultimately, the sustainability of future supercycles will depend on how effectively the world balances economic growth, resource management, and environmental responsibility.
As the 21st century progresses, the next commodity supercycle—driven by the energy transition, digitalization, and global reindustrialization—may redefine the global economy once again, just as its predecessors did in centuries past.
Types of Global Trade WarIntroduction
A global trade war occurs when nations impose tariffs, quotas, or other trade barriers against each other in retaliation for perceived unfair trade practices. These conflicts often stem from disputes over trade imbalances, currency manipulation, intellectual property theft, or protectionist policies. In a world where globalization has tightly interconnected economies, trade wars can have far-reaching consequences—affecting industries, consumers, financial markets, and diplomatic relations.
Trade wars are not new. From the Smoot-Hawley Tariff Act of 1930 in the United States to the U.S.-China trade conflict that began in 2018, the concept has evolved alongside the global economy. Today’s trade wars extend beyond simple tariff disputes to include technology restrictions, digital trade barriers, and strategic economic decoupling. Understanding the types of trade wars helps explain how economic competition shapes global power dynamics.
1. Tariff-Based Trade Wars
Definition
Tariff-based trade wars occur when countries impose import duties (taxes) on foreign goods to protect domestic industries or punish other nations. These tariffs make imported goods more expensive, discouraging their purchase and promoting local alternatives.
Characteristics
Involves direct taxation on goods crossing borders.
Often used as retaliation for another nation’s tariffs.
Creates immediate effects on global prices and supply chains.
Examples
U.S.–China Trade War (2018–2020): The United States imposed tariffs on over $360 billion worth of Chinese imports, while China retaliated with tariffs on U.S. agricultural and industrial products.
EU–U.S. Steel and Aluminum Dispute (2018): The U.S. imposed tariffs of 25% on steel and 10% on aluminum imports, claiming national security reasons. The European Union retaliated with tariffs on American goods like motorcycles and whiskey.
Impact
Tariff-based wars often lead to:
Increased consumer prices.
Disrupted supply chains.
Decreased global trade volumes.
Shifts in investment and manufacturing to non-tariff countries.
2. Non-Tariff Barrier Trade Wars
Definition
A non-tariff trade war uses regulatory restrictions instead of tariffs to limit trade. These may include import quotas, licensing requirements, product standards, or environmental regulations that disadvantage foreign companies.
Characteristics
Harder to identify and measure than tariffs.
Often justified as “safety” or “environmental” measures.
Can be used strategically to block competition.
Examples
Japan vs. U.S. Auto Disputes (1980s): Japan used strict safety and emissions standards to limit American car imports.
European Union’s Agricultural Rules: The EU’s regulations on genetically modified foods and pesticide use often act as barriers against U.S. agricultural exports.
Impact
Creates uncertainty for exporters.
Increases compliance costs.
Favors domestic industries under the guise of regulation.
3. Currency Manipulation and Exchange Rate Wars
Definition
Currency wars, also known as competitive devaluation, occur when countries intentionally devalue their currencies to make exports cheaper and imports more expensive, thus improving their trade balance.
Characteristics
Typically involves central banks or monetary authorities.
May lead to inflation or financial instability.
Can escalate into broader economic and geopolitical conflict.
Examples
China’s Yuan Policy (2000s): The U.S. accused China of keeping its currency artificially low to boost exports.
Global “Currency War” of 2010: Countries like Japan and Brazil intervened in foreign exchange markets to weaken their currencies after the U.S. Federal Reserve launched quantitative easing.
Impact
Encourages retaliatory devaluations.
Destabilizes global currency markets.
Reduces investor confidence.
May trigger capital flight from emerging markets.
4. Technology and Digital Trade Wars
Definition
In the 21st century, technology trade wars have emerged as a new front in global economic competition. These involve restrictions on data, technology exports, intellectual property rights, and the dominance of tech giants.
Characteristics
Focuses on control of strategic technologies like semiconductors, AI, and 5G.
Often framed as national security or data protection issues.
Targets specific companies rather than entire industries.
Examples
U.S.–China Tech Conflict: The U.S. restricted companies like Huawei and ZTE from accessing American technologies, citing security concerns. It also banned chip exports to China for advanced computing.
EU Digital Services Act (DSA): The European Union has imposed strict digital market regulations, often seen as targeting U.S. tech firms such as Google, Meta, and Amazon.
Impact
Fragmentation of global technology supply chains.
Slower innovation due to reduced collaboration.
Strategic decoupling between the U.S. and China in the semiconductor and AI sectors.
5. Resource and Commodity Trade Wars
Definition
These wars focus on critical natural resources—such as oil, gas, rare earth metals, or food—used as economic or political leverage.
Characteristics
Resource-rich nations restrict exports to gain political influence.
Import-dependent countries seek diversification or self-sufficiency.
Often intertwined with geopolitical tensions.
Examples
OPEC Oil Embargo (1973): Arab nations cut oil exports to the U.S. and other Western countries supporting Israel, leading to a global energy crisis.
China’s Rare Earth Export Controls (2010): China restricted exports of rare earth minerals crucial for electronics, targeting Japan after a territorial dispute.
Russia–Europe Gas Conflict (2022): Following the invasion of Ukraine, Russia reduced gas supplies to Europe, triggering an energy crisis and forcing European nations to find alternatives.
Impact
Sharp commodity price fluctuations.
Inflationary pressures globally.
Strategic realignments in energy and resource supply chains.
6. Agricultural and Food Trade Wars
Definition
Agricultural trade wars arise when countries impose restrictions or subsidies on food and farm products to protect domestic farmers or retaliate against other nations’ policies.
Characteristics
Often involves perishable goods like grains, meat, and dairy.
Highly political due to its effect on farmers and food security.
Influenced by health, safety, and environmental standards.
Examples
U.S.–EU Beef Hormone Dispute: The EU banned beef treated with growth hormones, while the U.S. claimed this violated World Trade Organization (WTO) rules.
India’s Rice and Wheat Export Bans (2022–2024): India limited exports to control domestic prices, impacting global food markets.
U.S.–China Agricultural Tariffs: China imposed tariffs on U.S. soybeans during the 2018 trade war, hurting American farmers.
Impact
Global food price volatility.
Disruption of agricultural supply chains.
Rising risk of food insecurity in developing nations.
7. Sanctions and Trade Embargoes
Definition
Trade sanctions and embargoes are political tools where nations restrict trade with specific countries to pressure them into policy changes. These are often unilateral or coalition-based rather than purely economic measures.
Characteristics
Used as instruments of foreign policy.
Target sectors like defense, energy, or finance.
Can be partial (targeted sanctions) or complete (full embargo).
Examples
U.S. Sanctions on Iran: Targeted Iran’s oil exports and financial transactions to curb its nuclear program.
Western Sanctions on Russia (2022): Following the invasion of Ukraine, Western nations imposed sweeping sanctions on Russian banks, oil companies, and oligarchs.
Cuba Embargo: The U.S. trade embargo on Cuba, in place since the 1960s, remains one of the longest-running in history.
Impact
Severe economic damage to targeted countries.
Global supply chain disruptions.
Emergence of black markets and sanction evasion networks.
8. Subsidy and Dumping Wars
Definition
Subsidy wars occur when governments financially support domestic industries to make their products cheaper internationally. Dumping happens when a country exports goods at below-market prices to gain unfair advantage.
Characteristics
Violates fair trade principles under WTO rules.
Leads to retaliatory tariffs and anti-dumping duties.
Common in sectors like steel, solar panels, and agriculture.
Examples
China’s Steel and Solar Subsidies: China has been accused by the U.S. and EU of subsidizing its steel and solar industries, flooding global markets.
Boeing vs. Airbus Dispute: The U.S. and EU accused each other of illegally subsidizing their aerospace giants, leading to WTO arbitration.
Impact
Market distortions and overcapacity.
Trade tensions within global manufacturing networks.
Long-term damage to fair competition.
9. Digital and Data Sovereignty Trade Wars
Definition
Digital trade wars revolve around data localization, privacy laws, and control over digital infrastructure. Governments use these measures to assert sovereignty over cyberspace and digital economies.
Characteristics
Focuses on control of citizens’ data and digital ecosystems.
Involves laws restricting cross-border data flows.
Part of broader efforts to reduce dependency on foreign technology.
Examples
EU’s GDPR (General Data Protection Regulation): Imposes strict data rules affecting U.S. tech companies operating in Europe.
India’s Data Localization Policy: Requires foreign companies to store user data locally, creating tensions with the U.S. tech industry.
China’s Cybersecurity Law: Restricts foreign companies’ access to Chinese digital markets.
Impact
Fragmentation of the global internet (“splinternet”).
Rising compliance costs for tech companies.
Reduced cross-border digital innovation.
10. Environmental and Green Trade Wars
Definition
As nations transition toward sustainable economies, green trade wars arise when environmental policies create new trade barriers or advantages.
Characteristics
Based on carbon emissions, climate regulations, and renewable technologies.
Can penalize “dirty” industries or reward green production.
Intersects with industrial and climate policy.
Examples
EU Carbon Border Adjustment Mechanism (CBAM): Imposes tariffs on imports from countries with weaker climate regulations.
U.S. Inflation Reduction Act (2022): Offers subsidies for domestic clean energy industries, criticized by the EU as protectionist.
China’s Solar Dominance: Accusations of unfair advantages in solar manufacturing due to state subsidies.
Impact
Reshapes global energy and industrial competition.
Encourages climate-friendly innovation.
Risk of conflict between developed and developing nations over “green protectionism.”
Conclusion
Global trade wars have evolved from simple tariff disputes to multifaceted economic conflicts involving technology, digital data, energy, and environmental policy. Each type—whether tariff-based, technological, or green—reflects deeper struggles for economic dominance, national security, and strategic autonomy.
While trade wars may provide short-term domestic protection, they often harm global growth, increase inflation, and reduce consumer welfare. Modern economies are too interconnected for isolationist strategies to succeed without consequences. The challenge for policymakers lies in balancing national interests with global cooperation—ensuring that competition fosters innovation rather than conflict.
Ultimately, understanding the types of global trade wars helps policymakers, investors, and citizens grasp how economic rivalries shape the future of globalization, technology, and international relations.
Capital Flows: Concept and Characteristics1. Introduction
Capital flows are among the most dynamic and influential forces in the modern global economy. They represent the movement of money across countries in search of investment opportunities, higher returns, and economic stability. These flows link financial markets, shape exchange rates, influence domestic interest rates, and contribute significantly to global economic growth. However, they can also generate volatility and crises if not managed properly. Understanding the concept, nature, and characteristics of capital flows is therefore essential for policymakers, investors, and economists alike.
In the broadest sense, capital flows refer to the movement of financial capital — funds for investment, trade, or production — between countries. These movements can take various forms, such as foreign direct investment (FDI), portfolio investment, external loans, or banking capital. In the era of financial globalization, capital flows have become a key determinant of macroeconomic performance, affecting balance of payments, currency stability, and the pace of development in emerging economies.
2. Concept of Capital Flows
Capital flows describe the movement of money for the purpose of investment, trade, or business production between nations. These flows can either be inflows (foreign capital entering a country) or outflows (domestic capital moving abroad). The fundamental objective of capital movement is to allocate global savings efficiently, directing funds from capital-abundant economies to those with productive investment opportunities.
From a macroeconomic perspective, capital flows are part of the financial account in a country’s balance of payments (BoP). The BoP records all international financial transactions over a specific period. When foreign investors purchase domestic assets or when international institutions provide loans, it results in capital inflows. Conversely, when residents invest abroad or repay foreign debt, capital outflows occur.
In essence, capital flows bridge the gap between savings and investment at the global level. Countries with savings surpluses lend to countries with deficits, facilitating growth and smoothing consumption over time. Yet, these movements also expose economies to risks, including sudden reversals, speculative attacks, and exchange-rate volatility.
3. Types of Capital Flows
Capital flows are typically categorized based on their nature, purpose, and duration. The major types include:
a. Foreign Direct Investment (FDI)
FDI represents long-term investments by foreign entities in productive assets such as factories, infrastructure, or businesses. It often involves control or significant influence over the management of the enterprise. FDI is considered stable because it is tied to physical and organizational capital. Examples include multinational corporations establishing subsidiaries or acquiring stakes in foreign firms. FDI contributes to job creation, technology transfer, and skill development, making it a preferred form of capital flow for developing nations.
b. Foreign Portfolio Investment (FPI)
FPI involves investment in financial assets such as stocks, bonds, or mutual funds without seeking management control. These investments are more liquid and short-term in nature compared to FDI. Portfolio flows respond quickly to changes in market conditions, interest rates, or investor sentiment, making them a major source of volatility in financial markets. While they provide liquidity and deepen capital markets, sudden withdrawals can destabilize economies.
c. Other Investment Flows
This category includes cross-border bank loans, deposits, and trade credits. These flows often occur through the banking system and can be highly cyclical. During global booms, banks expand international lending, but in crises, credit tends to contract rapidly, intensifying financial distress in emerging markets.
d. Official Flows
Official capital flows involve transactions between governments or international organizations. They include development aid, loans from international financial institutions like the IMF or World Bank, and sovereign bond investments. These flows often aim to stabilize economies, finance infrastructure, or promote development goals.
4. Characteristics of Capital Flows
Capital flows possess several defining characteristics that distinguish them from other forms of international transactions. These characteristics determine their behavior, impact, and policy implications.
a. Bidirectional Nature
Capital flows are inherently bidirectional, encompassing both inflows and outflows. Inflows refer to the foreign investment entering a country, while outflows denote domestic investment abroad. The balance between the two reflects the country’s attractiveness to global investors and its economic fundamentals.
b. Volatility
One of the most notable features of capital flows, especially portfolio and short-term flows, is their volatility. Capital moves swiftly across borders in response to changes in global interest rates, risk perception, or political stability. This “hot money” behavior can cause rapid appreciation or depreciation of currencies and abrupt shifts in liquidity conditions.
c. Sensitivity to Interest Rate Differentials
Capital flows respond strongly to differences in interest rates between countries. When a nation offers higher returns, it attracts inflows as investors seek better yields. Conversely, when interest rates fall, capital tends to exit in search of more profitable opportunities elsewhere. This dynamic is closely linked to the “carry trade” phenomenon in global finance.
d. Dependence on Economic Fundamentals
Sustained capital inflows generally depend on macroeconomic fundamentals such as GDP growth, inflation control, fiscal discipline, and political stability. Investors prefer economies with sound policies, strong institutions, and transparent regulatory environments.
e. Short-Term vs. Long-Term Orientation
FDI tends to be long-term and relatively stable, reflecting confidence in a country’s future prospects. In contrast, portfolio and banking flows are often short-term and speculative, seeking quick gains. The composition of capital flows thus affects the degree of stability in a country’s financial system.
f. Role in Currency Movements
Capital inflows increase demand for the domestic currency as foreign investors convert foreign currency into local money to purchase assets. This can lead to currency appreciation. Conversely, outflows can cause depreciation pressures. Hence, managing capital flows is crucial for exchange-rate stability.
g. Impact on Domestic Liquidity
Large capital inflows can expand domestic money supply, influencing inflation and credit growth. Central banks often intervene to sterilize excessive liquidity through open-market operations. Similarly, sudden outflows can tighten liquidity and trigger financial stress.
h. Influence of Global Sentiment
Capital flows are highly influenced by global risk appetite. During periods of optimism, investors pour money into emerging markets seeking higher returns. But during crises, they retreat to “safe havens” such as U.S. Treasury bonds or gold. This cyclical behavior often amplifies boom-bust patterns in developing economies.
5. Determinants of Capital Flows
Several factors drive international capital movements:
Interest Rate Differentials: Higher returns attract investors to a country’s financial assets.
Exchange Rate Expectations: Anticipated appreciation of a currency can attract inflows, while depreciation expectations cause outflows.
Economic Growth Prospects: Strong growth signals future profitability and attracts investment.
Political and Policy Stability: Transparent governance and sound fiscal management boost investor confidence.
Financial Market Development: Deep, liquid, and efficient markets encourage both FDI and portfolio inflows.
Global Liquidity Conditions: Quantitative easing or tightening by major central banks (like the U.S. Federal Reserve) influences global capital availability.
Risk Perception and Geopolitical Events: Wars, pandemics, or trade tensions can redirect flows toward safer economies.
6. Benefits of Capital Flows
When managed effectively, capital flows bring multiple economic benefits:
a. Investment Financing
Capital inflows supplement domestic savings, allowing countries to finance large-scale infrastructure, industrial, and technological projects. This accelerates economic growth and modernization.
b. Technology and Skill Transfer
Through FDI, developing countries gain access to advanced technologies, management expertise, and global value chains, boosting productivity and competitiveness.
c. Financial Market Development
Portfolio inflows promote the development of capital markets by increasing liquidity, improving asset pricing, and diversifying investor bases.
d. Job Creation and Income Growth
FDI generates employment opportunities, enhances wages, and stimulates demand in related sectors.
e. Fiscal and Monetary Gains
Capital inflows increase tax revenues and foreign exchange reserves, strengthening fiscal and monetary stability.
7. Risks and Challenges of Capital Flows
Despite their benefits, capital flows also pose several macroeconomic and financial risks:
a. Exchange-Rate Volatility
Large and sudden inflows can appreciate the domestic currency, reducing export competitiveness — a phenomenon known as “Dutch disease.” Conversely, abrupt outflows can cause sharp depreciation and inflation.
b. Financial Instability
Short-term speculative flows can amplify asset bubbles in equity or real-estate markets. When these bubbles burst, they lead to capital flight and banking crises.
c. Policy Dilemmas
Managing capital flows involves trade-offs between maintaining exchange-rate stability, monetary independence, and free capital mobility — often referred to as the “impossible trinity” in international economics.
d. Reversal Risk
The sudden reversal of capital flows, often triggered by global shocks, can lead to balance-of-payments crises and depletion of foreign reserves, as seen during the Asian Financial Crisis (1997) and the Global Financial Crisis (2008).
8. Policy Management of Capital Flows
Governments and central banks employ various strategies to manage capital flows:
Exchange-Rate Flexibility: Allowing exchange rates to adjust helps absorb shocks from volatile flows.
Foreign-Exchange Reserves: Maintaining adequate reserves provides a buffer against sudden outflows.
Macroprudential Regulations: Measures like capital adequacy ratios, reserve requirements, and lending limits safeguard financial stability.
Capital Controls: Temporary restrictions on short-term inflows or outflows can prevent excessive volatility.
Coordination with Fiscal Policy: Prudent fiscal management complements monetary policies to maintain investor confidence.
9. Capital Flows in Emerging Economies
Emerging markets, such as India, Brazil, and Indonesia, are particularly affected by global capital movements. Their growing markets and higher returns attract inflows, but structural weaknesses make them vulnerable to reversals. For instance, U.S. monetary tightening often leads to “capital flight” from emerging economies, putting pressure on their currencies. Hence, many developing countries focus on attracting stable FDI while managing short-term speculative flows carefully.
10. Conclusion
Capital flows form the lifeblood of the global financial system, linking nations through investment, trade, and finance. They enable countries to bridge savings gaps, finance development, and integrate into global markets. However, their benefits come with challenges — volatility, policy constraints, and potential crises. The key lies in maintaining sound macroeconomic fundamentals, transparent financial systems, and prudent regulation to harness the advantages of capital mobility while minimizing its risks.
In today’s interconnected world, capital flows symbolize both opportunity and vulnerability. For policymakers, the ultimate objective is not to restrict these flows but to manage them wisely — ensuring that global finance contributes to stable, inclusive, and sustainable growth.
America’s Financial Influence in the Global MarketIntroduction
The United States of America holds a dominant position in the global economy, shaping the movement of capital, trade, and investment flows worldwide. Since the end of World War II, the U.S. has been the backbone of the international financial system, influencing global markets through its currency, policies, institutions, and corporations. From Wall Street’s leadership in global finance to the U.S. dollar’s role as the world’s reserve currency, America’s financial influence touches every corner of the global economy. This dominance, however, is not without challenges—it faces competition from emerging economies, evolving geopolitical dynamics, and changing monetary systems.
Historical Roots of U.S. Financial Dominance
America’s financial supremacy was not built overnight. The foundation was laid after World War II, when the U.S. emerged as the strongest economy. The Bretton Woods Agreement of 1944 established a new international financial system centered around the U.S. dollar, which was pegged to gold at $35 per ounce. Other currencies were tied to the dollar, effectively making it the world’s reference currency.
This system gave the U.S. enormous power over global finance. Institutions like the International Monetary Fund (IMF) and the World Bank, both headquartered in Washington D.C., were established under American leadership. The U.S. dollar became not only the medium of trade but also the standard for reserves, loans, and pricing of commodities such as oil and gold.
Even after the collapse of the Bretton Woods system in 1971, when President Richard Nixon ended the gold standard, the dollar retained its dominance due to America’s large economy, political stability, and deep capital markets. Since then, global trade and finance have revolved around U.S. financial instruments and policies.
The U.S. Dollar: The Core of Global Finance
The U.S. dollar is the single most important instrument of American financial influence. It serves as the global reserve currency, held by central banks worldwide to stabilize their own currencies and facilitate international trade. Around 60% of global foreign exchange reserves are denominated in dollars, and nearly 90% of foreign exchange transactions involve the dollar on one side.
This dominance provides the U.S. with “exorbitant privilege,” a term coined by French Finance Minister Valéry Giscard d’Estaing. It allows America to borrow cheaply from the rest of the world because global investors view U.S. Treasury securities as the safest assets available. This means the U.S. can run large trade deficits without facing immediate financial crises.
Moreover, commodities such as oil, gold, and wheat are priced in dollars, forcing countries to maintain dollar reserves for trade. This mechanism strengthens demand for the currency and, by extension, America’s global influence. The “petrodollar system,” established in the 1970s with Saudi Arabia and other OPEC countries, reinforced this dynamic by ensuring that oil transactions were conducted in U.S. dollars.
Wall Street and the Power of Financial Markets
America’s financial power is concentrated in Wall Street, the heart of the global capital market. The New York Stock Exchange (NYSE) and NASDAQ are the two largest stock exchanges in the world, accounting for more than half of global equity market capitalization. U.S. investment banks such as Goldman Sachs, JPMorgan Chase, and Morgan Stanley play key roles in global mergers, acquisitions, and financial advisory services.
American asset managers like BlackRock, Vanguard, and Fidelity collectively manage trillions of dollars in global investments. These institutions influence corporate governance, environmental standards, and financial practices across borders. Their investment decisions can shift the direction of global markets and affect national economies.
The depth and liquidity of U.S. capital markets make them attractive to investors worldwide. Foreign governments, corporations, and individuals invest heavily in U.S. assets because of their transparency, reliability, and high returns. This constant inflow of global capital strengthens the dollar and allows the U.S. to finance its federal debt efficiently.
U.S. Monetary Policy and Its Global Impact
Another powerful instrument of America’s financial influence is the U.S. Federal Reserve (the Fed). Its decisions on interest rates, quantitative easing, and liquidity injections directly affect global markets. When the Fed raises rates, global capital tends to flow into the U.S., strengthening the dollar and pressuring emerging markets. Conversely, when it lowers rates, liquidity floods into global markets, boosting investments in riskier assets worldwide.
For instance, during the 2008 financial crisis, the Fed’s policies of near-zero interest rates and quantitative easing stabilized the U.S. economy but also influenced global liquidity and asset prices. Similarly, during the COVID-19 pandemic, the Fed’s massive stimulus programs provided relief not only to the U.S. economy but also to global markets, which depend heavily on dollar funding.
This global spillover effect of U.S. monetary policy highlights how dependent the world remains on the American financial system. Central banks across Asia, Europe, and Latin America closely monitor the Fed’s moves because they directly influence exchange rates, capital flows, and inflation in their own economies.
Global Institutions Under U.S. Influence
The U.S. exerts significant control over global financial institutions. It remains the largest shareholder in the International Monetary Fund (IMF) and the World Bank, giving it substantial voting power. These institutions often follow policy directions aligned with U.S. economic philosophy—promoting free markets, privatization, and fiscal discipline.
Through its influence, the U.S. has been able to shape global development and crisis management. For example, during the Asian Financial Crisis of 1997, IMF rescue packages reflected Washington’s preferences for structural reforms and market liberalization. While some countries viewed this as necessary stabilization, others criticized it as U.S.-driven economic control.
Moreover, the U.S. Department of Treasury and Office of Foreign Assets Control (OFAC) play powerful roles in imposing financial sanctions. By cutting off countries or individuals from the U.S. financial system and SWIFT network, the U.S. can exert non-military pressure on adversaries like Iran, Russia, or North Korea. This ability to use finance as a foreign policy weapon demonstrates the reach of America’s economic influence.
Technological and Corporate Financial Power
America’s dominance is also reflected through its multinational corporations and technology giants that command enormous financial power. Companies such as Apple, Microsoft, Amazon, Google, and Meta hold massive global market shares and influence digital commerce, cloud infrastructure, and financial technology.
The rise of FinTech and digital payment systems such as PayPal, Visa, and Mastercard—headquartered in the U.S.—further extends America’s financial reach. These platforms are integrated into global payment networks, giving the U.S. indirect control over financial transactions worldwide.
Moreover, American financial innovation—from derivatives trading to venture capital financing—sets the standards for global markets. Silicon Valley’s venture ecosystem funds startups globally, while U.S. investment laws and regulations shape how international firms list or raise capital.
Soft Power Through Finance and Economics
Beyond hard economic power, the U.S. exerts soft financial influence through education, culture, and ideas. American universities such as Harvard, MIT, and Stanford train thousands of global leaders in finance, economics, and business. These individuals often return to their home countries carrying U.S. economic principles—reinforcing the American model of capitalism and market-driven growth.
The dominance of the English language in finance, and the widespread use of U.S. accounting standards (GAAP) and credit rating systems (Moody’s, S&P, Fitch), reflect the deep-rooted soft power of American financial culture. These systems define global creditworthiness and influence borrowing costs for countries and corporations.
Challenges to U.S. Financial Dominance
Despite its enormous influence, America’s financial supremacy faces growing challenges. The rise of China as an economic powerhouse has led to efforts to internationalize the Chinese yuan (renminbi) and develop alternatives to the dollar-dominated system. Initiatives such as the Belt and Road Initiative (BRI) and Asian Infrastructure Investment Bank (AIIB) aim to provide financial independence for developing nations.
The European Union also promotes the euro as a stable reserve currency, while emerging economies explore digital currencies and Central Bank Digital Currencies (CBDCs) to bypass dollar-based trade systems. Additionally, geopolitical tensions—such as U.S. sanctions on Russia—have encouraged countries to diversify away from the dollar to protect their economies.
Another internal challenge is America’s rising national debt, which exceeds $35 trillion. Persistent fiscal deficits raise questions about long-term sustainability and global confidence in U.S. financial management. Yet, paradoxically, in times of crisis, investors still turn to the dollar as a safe haven, reaffirming its central role.
Global Repercussions of U.S. Financial Crises
The interconnected nature of the global economy means that financial shocks in the U.S. ripple worldwide. The 2008 Global Financial Crisis, triggered by the collapse of Lehman Brothers, exposed how deeply global markets were tied to U.S. mortgage and banking systems. Similarly, shifts in U.S. interest rates or policies can cause volatility in emerging markets, leading to currency devaluation and capital flight.
However, the same interconnectedness allows the U.S. to lead recovery efforts. American stimulus programs, capital market resilience, and innovation often guide the global economy out of downturns. The COVID-19 pandemic again demonstrated this dynamic—while the U.S. initially suffered economic contraction, its rapid fiscal response and vaccine rollout helped stabilize global trade and investment confidence.
The Future of U.S. Financial Influence
Looking ahead, America’s financial leadership will likely remain strong but evolve in response to digitalization and multipolar competition. The emergence of digital assets, cryptocurrencies, and CBDCs could reshape how money flows internationally. The U.S. government and Federal Reserve are exploring digital dollar initiatives to maintain dominance in a changing financial landscape.
Moreover, sustainability and climate finance are becoming central to global policy. The U.S., through its financial institutions and corporations, is increasingly promoting ESG (Environmental, Social, and Governance) standards, which influence investment decisions globally.
While challenges from China, the EU, and decentralized finance systems may dilute its influence over time, the depth of America’s capital markets, the trust in its institutions, and the global dependence on the dollar ensure that the U.S. will remain a central pillar of global finance for decades.
Conclusion
America’s financial influence in the global market is the result of decades of economic strength, institutional leadership, and monetary power. From the U.S. dollar’s role as the global reserve currency to Wall Street’s leadership in finance and technology, the American system remains deeply embedded in the global economy. However, this dominance also carries responsibilities—to maintain stability, fairness, and innovation in a rapidly changing world.
Even as new players emerge and the global financial system becomes more multipolar, the United States remains the heartbeat of global finance. Its currency, markets, and policies continue to shape the world’s economic destiny—demonstrating that, in the modern age, financial power is as influential as military might.

3 Common Trading Mistakes Traders Should AvoidTraders of all levels, from beginners to experienced professionals, can fall prey to psychological mistakes that can lead to poor trading decisions and ultimately, losses. Understanding and avoiding these common mistakes is crucial for developing a sound trading strategy and achieving consistent success in the markets.
Here are three of the most prevalent trading mistakes traders should strive to avoid:
FOMO (Fear of Missing Out): FOMO is a pervasive emotion that can cloud traders' judgment and lead them to make impulsive decisions based on the fear of missing out on potential profits. This often involves chasing trends or entering trades without proper analysis, increasing the risk of losses.
To combat FOMO, traders should adhere to their trading plan, prioritize discipline, and focus on identifying high-probability trading opportunities rather than reacting to market movements out of fear.
Revenge Trading: Revenge trading is the emotional urge to recoup losses from previous trades by making hasty and ill-advised decisions. This often stems from a desire to prove one's rightness or regain a sense of control over the market.
To avoid revenge trading, traders should cultivate emotional detachment, accept losses as a natural part of trading, and avoid the temptation to let emotions dictate their trading decisions.
Gambler's Fallacy: The gambler's fallacy is the mistaken belief that past events influence the outcome of future events, leading to an assumption that trends will continue indefinitely or that random events can be predicted.
To overcome the gambler's fallacy, traders should recognize that each trade is an independent event with its own unique probabilities, and past performance is not a guarantee of future results. They should rely on sound trading analysis and risk management techniques rather than relying on hunches or superstitions.
By avoiding these common psychological mistakes, traders can develop a more disciplined and rational approach to trading, increasing their chances of achieving long-term success in the markets.
Does the MAG7 Really Rule the S&P 500?
I have heard people say things like:
"Without the mag 7, SPY would go nowhere" and
"Apple IS the market" and
"Tech is what the market is built on".
Various things to that effect. I have heard this more with the quite obvious AI bubble going on, where the extreme bullishness and propping of the market is being attributed to the heavily weighted mag 7 stocks, such as NVDA, META, MSFT, AAPL etc. etc.
But I wondered to myself, how true is this? And what happens when and/or if the bubble pops? What stocks are really carrying the S&P and is it true that all that matters is tech?
So, being the quant based math person I am, I decided to answer this question in the best way I knew how. Math and coding.
The questions I want to answer are:
What are the top 10 weighted stocks of the S&P?
What are the top 20 stocks over the last 5 years that have gained the most returns? Is it all tech?
What happens if the AI bubble were to pop and tech were to become a drain on the S&P?
Question #1: Is tech disproportionately weighted on the S&P?
So, let's get into the process. The first thing to do was to analyze actually how heavily tech is weighed on the S&P. This is simple enough, I can accomplish this by pulling ETF holdings from Alpha Vantage and getting their corresponding weight. Using Alpha Vantage's API, I pulled the top 10 highly weighted stocks of the S&P and here are the results:
So.. yeah, SPY heavily favours tech in terms of weighing.
Question #2: Does tech actually carry the S&P and is it the only reason the S&P sees the gains it does?
To answer this question, we need to find out, over the last 5 years, which stocks had the highest average annual return? I isolated the top 20 stocks with the highest average returns and also calculated the number of bullish vs bearish years over the 5 year period, here are the results:
You should already be seeing something interesting. While there is indeed some tech in here, there are a substantial amount of non-tech tickers. For example, NYSE:BLDR is a construction based ticker, NASDAQ:HOOD is finance, NYSE:PWR , NYSE:EME and NYSE:VST are utility based/power/electric based tickers.
You also don't see such tickers as NASDAQ:META or NASDAQ:MSFT leading the gains.
So already we have invalidated the thesis that "tech runs the market", as only 6 of these top 20 tickers are tech based, the rest vary from utilities, to finance to construction.
Another interesting thing to note is that utilities tend to be resistant to negative returns/draw downs. If you notice, NYSE:PWR , NYSE:EME , and NYSE:VST have had 0 bearish years in the past 5 years, vs the rest having some draw downs. Interesting, no?
We can't draw conclusions about the stability or returns of tech stocks from this, but we can draw conclusions about the importance of diversification. We can opine that tech sees more swings and is more prone to volatility than say stable utility based tickers. But it doesn't mean that the actual cumulative returns over 5 years wouldn't outweigh a stable stock that maybe has less returns.
So now that our findings raise this question, let's compare what our returns would be if we had bought some of these top performers 5 years ago.
Let's start with NASDAQ:NVDA
If you bought NASDAQ:NVDA October 20th, 2020, you would have bought at 13.65 per share (bearing in mind there was a split between this timeframe). Current price is 182.64, making your 5 year return 1238.46%.
Now NYSE:BLDR
If you bought NYSE:BLDR on October 20th of 2020, you would have bought it for 33.66 per share, with the current price being 122.46 being a 263.76% return on your investment.
Next NASDAQ:AVGO
If you bought AVGO on October 20th of 2020, you would have paid 37.7$ per share, with a current price of 349.24, making your return over 5 years 826.39%. Not bad.
What about NYSE:PWR
Ah, NYSE:PWR , a stable stock with 0 bearish years over the last 5 years. Had we purchased NYSE:PWR October 20th, 2020, we would currently be up 599.14%.
And what about NYSE:VST ?
Had we bought VST 5 years ago, October 20th, 2020, we would be up 912.72%. Second rank to $NVDA! Nuts right?
What about some tickers that are not on the list?
Assuming the same, you bought October 20th, 2020, here is what you would be up on various stocks:
NASDAQ:MSFT = 140.75%
NASDAQ:META = 173.65%
NASDAQ:AAPL = 123.16%
NASDAQ:NFLX = 135.73%
NASDAQ:IRDM = -34.28%
NASDAQ:GSAT = 768.78%
NYSE:VZ = -28.73%
NASDAQ:PLTR = 1858.9%
NYSE:LMT = 35.92%
NYSE:BA = 29.65%
Interesting? Probably!
In fact, this actually helps us answer our question more concretely. We can see that tech returns, while admirable, are not really all that ridiculously inflated. I mean 123% return on your investment over 5 years is pretty good, but its not 900%.
Thus, we can say that it can't be true that tech fully drives the S&P, at least not entirely.
That's all fine and dandy, but what is critical is our next question, what happens if the tech bubble (AKA AI bubble) pops? How will the weight impact the S&P?
Question #3: What happens if AI bubble pops?
Well, this is the most interesting question. And we can actually begin to answer this question, not so mathematically by simply looking at charts during the dotcom bust. We can see in 1999 at the peak of the bust, SPY lost about 50%:
Of we look at, say, NYSE:PWR and NYSE:EME during that time:
NYSE:EME lost about 36%
NYSE:PWR just over 50% but quickly rebounded while AMEX:SPY continued to tank.
So this doesn't bode well for AMEX:SPY being able to offset such a heavy weighing of tech. But let's approach this mathmatically.
Since we have the actual weight of the Mag 7.
For clarity, the Mag 7 are said to be NASDAQ:AAPL , NASDAQ:MSFT , NASDAQ:NVDA , NASDAQ:AMZN , NASDAQ:META , NASDAQ:GOOG , $TSLA.
If we take the weighing of these 7 companies and calculate the actual dollar amount this weight translates to, it translates to exactly 141.57$ USD, comprising a total weight of 31.46%.
What this means is if you were to buy $1,000 worth of SPY, approximately 315$ of your money would be allocated just to those 7 tickers, or 1,000 x 0.315 = 314.6$.
Running a simulation in R based on the weight of 31.46%, assuming that all 7 of these tickers were to drop 50%, that would equate to a loss of -15.73% on SPY. That is assuming that other companies did not, in sympathy of the bubble pop, also not come down with $SPY.
We know this to obviously be false from experience, even NYSE:PWR tanked at first during the dotcom bust and same with NYSE:EME despite them having absolutely nothing to do with dotcom nonsense.
But, in a perfect world, if only the mag7 were impacted, we would see about a -10 to -15% decline in AMEX:SPY on a bubble pop, assuming of course these companies tanked 50%.
So now what?
So I have answered my questions, I could just leave it there. But perhaps it may be more advantageous to talk about what this actually means for an investor.
We can draw some initial speculations, unfortunately we don't have enough data to draw concrete conclusions.
The first assessment we can draw is, does it even make sense to invest in AMEX:SPY ?
The 5 year return on SPY, if we bought in 2020-10-20, would be 95.5%. Had we invested in NASDAQ:AAPL or any of the other tickers I mentioned above, specifically tech, our return would have been slightly better.
It begs the quesiton, what's the point? If AMEX:SPY is so exposed to tech, its actually hindering your returns when you can just invest in the raw tech ticker itself, and diversify more fully in other tickers such as NYSE:PWR and NASDAQ:EXE to offset the drawdawns.
Overall, your returns would be better than just investing simply in the ETF SPY.
If you look at it more concretely, the R:R may theoretically be worse. If you are a savvy investor and you are up over 100% on your investment, the logical thing to do is to set a profit stop (this is something I do in my investment account). This can shield your returns from bubble pops and other financial hardship while retaining a substantial portion of profit.
You can also just chose to take profit at 100% and over and then look for something else too invest in.
When you dissect annual returns of various tickers and look at the impact these tickers have on the ETF, ETFs lose their air of "safety" and "solid investments". Because in the end, you are super exposed to a handful of stocks that you would do better to just individually invest in independently. While AMEX:SPY is diversified, being super exposed to the most volatile industries in the market does not necessarily make it a safe investment nor does it make sense from an actual R:R perspective if you were to really consider the risk that the collapse of only 7 companies of the 500 would have on the ETF itself.
This isn't advice by any means, just some food for thought.
When you dissect the anatomy of the market and its components, you can get further insight into what you are actually getting into when you buy a, quote , "safe and stable ETF" like $SPY.
These are my thoughts, opinions and some objective analysis.
Hopefully you find this information helpful and use some of these principles in gauging your risk exposure.
Thanks for reading! and as always, safe trades!

AMP Futures - Continue your last replay seamlessly.In this idea we will demonstrate how to use the new saved bar replay feature using TradingView.

How to Generate More Profits During Earnings SeasonWho is in control of Price on the Day of the Earnings season CEO reports requires studying the stock chart 2-4 weeks ahead of the estimated date of the report.
Smaller Funds activity will disrupt runs intraday.
Professional Trading Companies are very active.
HFTs AI are making huge errors causing whipsaw action.
Buy Side has slowed and paused its accumulation in many stocks.

Something worth learning If you connect the dots together you'll see it matches trendlines and zones and also having multiple confluence in trading will give you an edge in the market
So many ways and strategies out there.
Break and retest is one of them it's simple and effective
I use Break and retest and others like RSI
The blck lines represent zones and if you check my entry and exit you'll see zones
Also on the RSI the exit is below 30% while the entry if above 70%
Note: sometimes RSI can be above 70% and below 30% for a long time doesn't it will reverse
That's why you use other confluences like strong zone or trendline
Don't just trade with OVERBOUGHT AND OVERSOLD
If this was helpful
Drop a like and comment 👍
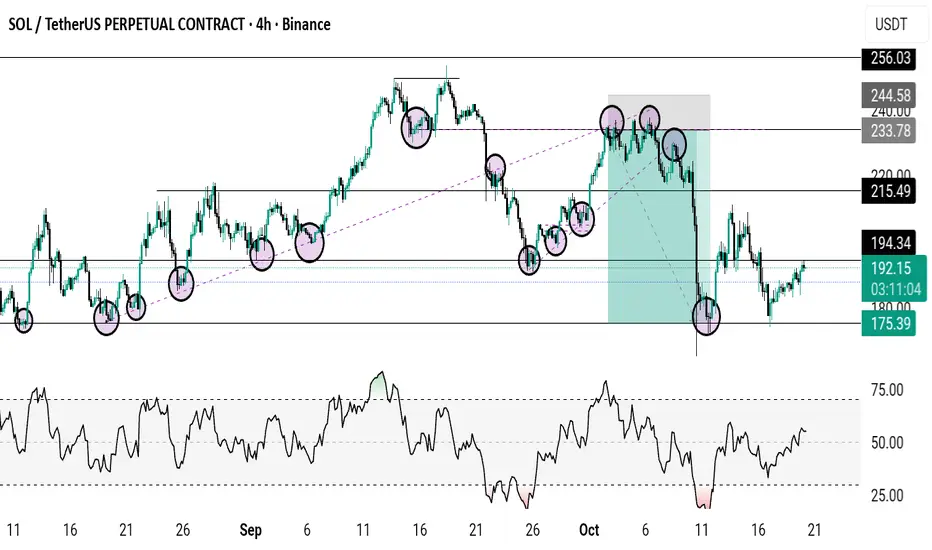
Turning $1,000 Into $10K (and Sometimes $0): The Leverage LessonEvery trader remembers their first brush with leverage — that magical moment when a modest account suddenly feels like a hedge fund.
You deposit $1,000, pop open TradingView, find your broker of choice , and boom — your buying power jumps to $30,000. You feel unstoppable as you imagine all the profits waiting for you out there.
And for a few moments, it works. A 1% move in your favor turns into a 30% gain. You start browsing for a new watch and a place in downtown Lisbon. But as every bruised and battered trader learns, leverage giveth and leverage obliterateth . That same 1% move against you? Game over.
Leverage is the financial equivalent of a sports car: thrilling, powerful, and incredibly dangerous in the wrong hands. Which, let’s be honest, most of us have been at some point.
If you take away anything from this piece, let it be this: if you wipe out 50% of your account, say, go from $1,000 to $500, it will take a 100% gain for you to get back even.
🧨 The Math That Makes (and Breaks) You
What exactly is leverage and what does it do? Leverage simply means you’re borrowing money to amplify your position size. A 1:10 ratio gives you control over $10,000 with just $1,000 of your own capital. The catch? You’re still responsible for all of it — the profits and the losses.
Here’s a general example:
• $1,000 with 1:10 leverage = $10,000 position.
• The market moves +1% = $100 profit. Nice.
• The market moves -1% = $100 loss. Manageable.
• The market moves -10%? That’s your entire $1,000 gone. Margin call city.
The higher your leverage, the narrower your margin for error. One bad candle, one unexpected news release , one mistimed coffee break when you’ve just loaded up ( during earnings , for example) and your performance can become a case study in volatility.
🧠 The Psychology of “More”
Here’s where it gets interesting: most traders don’t blow up their accounts because they misunderstand leverage — they blow up because they only think about the upside, how much they can make.
Leverage feeds every dangerous trading instinct: impatience, overconfidence, revenge trading, FOMO. “Next time we go bigger. Double down. We can make it back.” It makes rational risk management feel boring — and boredom, especially for a new trader, is unbearable.
Successful traders learn to see leverage for what it is: a tool, not a ticket. They understand that doubling down rarely doubles results, and that a steady pace — not speed — is the name of the game.
💡 The Smart Way to Use Leverage
So how do you wield this double-edged sword without losing a hand?
• Start small . New traders shouldn’t touch anything above 1:10 until they’ve mastered consistency.
Even pros rarely use their full leverage. And in the rare instances where they do, it usually ends up with a blowup. If you’d like to read up on the topic, Archegos Capital and LTCM are a good place to start.
• Use stop-losses religiously . A good stop-loss isn’t weakness; it’s insurance.
• Don’t equate margin with opportunity . Just because you can open a $50,000 position doesn’t mean you should.
• Think in percentages, not dollars . Most experienced traders aim to risk no more than 1–3% of their total equity per trade.
• Treat leverage like caffeine . A little sharpens focus. Too much and your hands start shaking and you lose sleep.
Leverage done right is a powerful tool that can help you get to your goals faster, smarter, and with fewer trades. But it can turn against you if you let it.
🪞 The Moral of the Margin Story
Leverage doesn’t make you a better trader. It makes your habits louder. If you trade emotionally, it amplifies your mistakes. If you trade methodically, it amplifies your discipline.
So yes, leverage can turn $1,000 into $10K — or into an expensive lesson in risk management. The deciding factor isn’t the multiplier on your screen; it’s the mindset behind your mouse.
In the end, trading is less about flexing your buying power and more about staying long enough to use it wisely.
Stay sharp, stay humble.
Off to you : What leverage do you usually use? Do you prefer to go 1:30 into forex or 1:10 into equities? Share your approach in the comments!
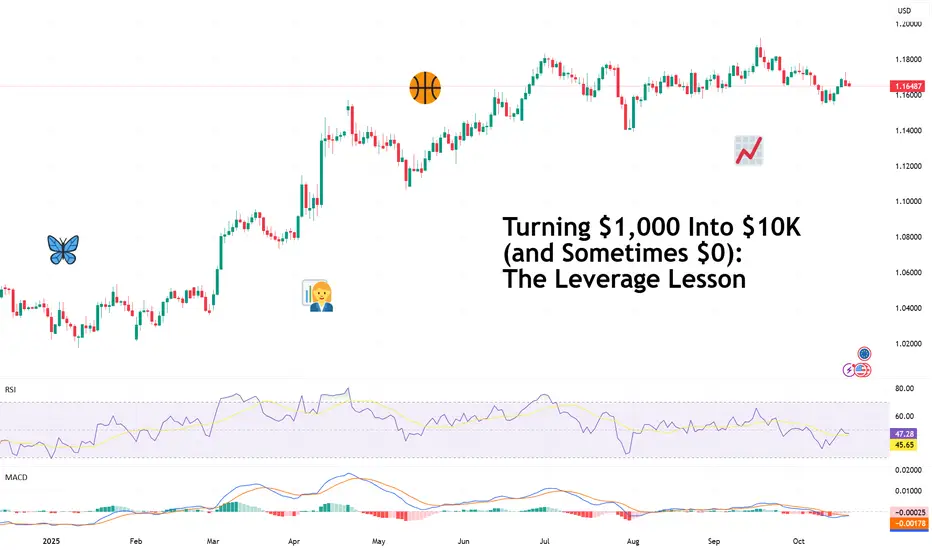
Discipline vs. Motivation: The Trader’s Real Edge1. Introduction
Most traders wait to “feel motivated” before they act. They look for that burst of excitement to drive their next session.
But motivation is unreliable. It fades after a few losses, a bad week, or a missed setup.
The traders who last aren’t driven by motivation. They’re driven by discipline, the quiet consistency that shows up even when excitement disappears.
2. Why Motivation Fails
Motivation is emotional. It peaks after a win and collapses after a setback.
When you rely on it, your behavior becomes inconsistent.
Examples:
– You skip journaling when tired.
– You overtrade after a loss.
– You hesitate until you “feel ready.”
Motivation starts the journey. Discipline finishes it.
The traders who survive long term are those who act from process, not mood.
3. The Power of Routine
Discipline isn’t about willpower. It’s about structure.
A simple daily routine removes emotional decision-making and replaces it with clarity.
One example framework:
Pre-market: Review levels and define risk.
During trading: Execute only setups that fit your plan.
Post-session: Journal outcomes and walk away.
Done consistently, this becomes second nature. You’ll trade correctly even when you don’t “feel like it.”
4. When Discipline Feels Boring
Discipline is not exciting. It’s repetitive, quiet, and often dull — but that’s why it works.
The more boring your process, the more consistent your results.
Amateurs seek excitement. Professionals seek predictability.
5. The Real Lesson
Motivation fades. Discipline compounds.
Every time you follow your rules — even on a losing day — you strengthen the foundation of a professional mindset.
The market rewards consistency, not emotion.

HOW-TO: Trade-o-Scope Plot Custom Data v2This is a short HOW-TO on using the Trade-o-Scope "Plot Custom Data v2" indicator

The Next Crypto Winter or Just a Cold PauseThe past few months in the crypto market feel strangely quiet.
Volatility has slowed down, emotions are swinging between fear and confusion, and trading volume has dropped noticeably.
But is this just a calm pause before the next bull runor the early whisper of another crypto winter?
Hello✌️
Spend 2 minutes ⏰ reading this educational material.
🎯 Analytical Insight on Ethereum:
Ethereum is testing the lower boundary of its bullish channel and key daily support 📉.
If this level holds, a potential 13% upside could target $4,400$🚀.
Now , let's dive into the educational section,
❄️ What Does “Crypto Winter” Really Mean?
A Crypto Winter is not just a price drop. It’s a long period when market excitement fades, liquidity dries up, and investors lose confidence.
During this phase, traders turn cautious, smaller projects disappear, and overall volume falls sharply.
We’ve seen this before most notably in 2018 and 2022 when Bitcoin crashed from all-time highs and stayed frozen for months.
📉 Current Signals: Are the Cold Nights Coming Back?
Recent data shows patterns that can’t be ignored.
Massive leveraged positions have been liquidated, exchange volumes are shrinking, and activity in DeFi projects is fading.
Many traders complain about the lack of momentum. In short, the engine of the market seems to be cooling down.
🧠 Market Psychology: When Fear Overpowers Greed
The Fear & Greed Index is once again leaning toward “Extreme Fear.”
This is when inexperienced traders panic and pull out their funds—while the smart money starts to accumulate quietly.
In these phases, separating logic from emotion becomes the trader’s greatest skill.
Fear blinds, but data reveals opportunity.
🧭 Educational Section: Using TradingView Tools to Spot Market Winters
If you want to visualize this on your charts, TradingView offers everything you need.
Start with the Volume Profile Visible Range indicator—it helps identify zones where the most trading activity occurred, showing where “smart money” might be hiding.
Next, try the Fear & Greed Index Indicator by searching it in the Indicators tab.
Then add the Moving Average Ribbon; when multiple averages compress or align downward on higher timeframes like Daily or Weekly, it’s often a sign of market exhaustion.
Finally, keep an eye on RSI (Relative Strength Index). If RSI stays below 40 for an extended period, buyers are losing control.
Combining these tools gives a realistic view of whether the market is cooling down.
Traders who master these indicators can stay objective and confident while others are led by noise—exactly the kind of analysis TradingView editors love to highlight.
🔍 Do the Data Confirm a Real Winter?
According to sources like Fool, CoinTracker, and BankRate, the signs are cautious but not final.
Bitcoin remains above key support levels in some timeframes, and on-chain data doesn’t show a complete capitulation of long-term holders.
So right now, we’re standing at a crossroads—one that could lead to either a deeper freeze or a quiet recovery.
💡 Final Advice for Traders
In times like this, your most powerful tools aren’t indicators or news—they’re your mindset and risk control.
If the market feels cold, slow down your trading, tighten your stops, and keep your liquidity flexible.
Sometimes, a winter is not a punishment—it’s an invitation to rest, learn, and prepare for the next move.
🪶 Summary
The crypto market is balancing on a fine line.
The cold signs are visible, yet hope still breathes beneath the surface.
Focus on data, emotion control, and TradingView tools to stay ahead of the crowd.
Don’t fear the frost sometimes, opportunity is hidden in the ice.
💡golden recommendations
Always define your exit and stop loss before entering.
Enter trades only when your mind is calm, not emotional.
✨ Need a little love!
We pour love into every post your support keeps us inspired! 💛 Don’t be shy, we’d love to hear from you on comments. Big thanks, Mad Whale 🐋
📜Please make sure to do your own research before investing, and review the disclaimer provided at the end of each post.
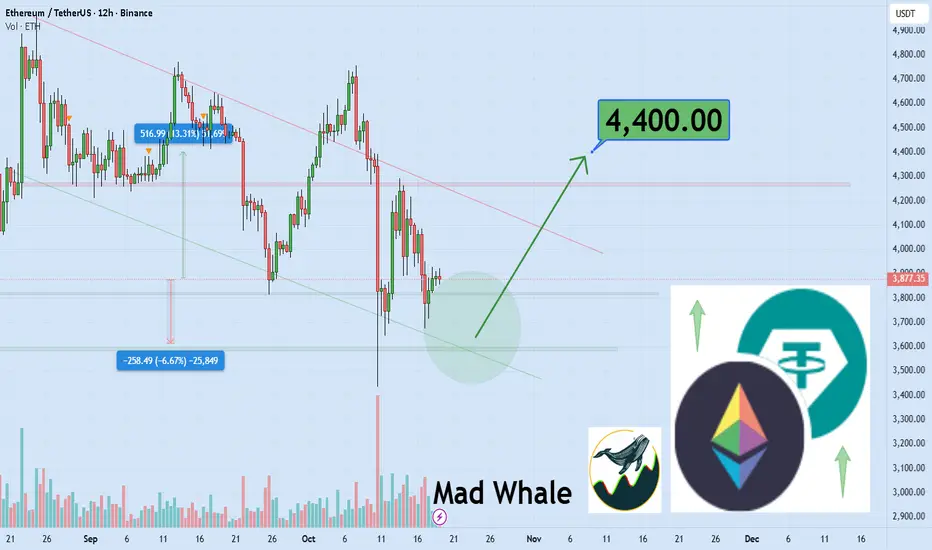
Reserve Currency Dominance: Mechanisms, History, and Future OutlIntroduction
In the complex fabric of the global economy, the concept of reserve currency dominance plays a crucial role in shaping international trade, finance, and geopolitical power. A reserve currency is a foreign currency that central banks and major financial institutions hold in large quantities for international transactions, investments, and to stabilize their own currencies. Dominance in reserve currency status means that one currency—historically the U.S. dollar—acts as the world’s primary medium of exchange, store of value, and unit of account in the global financial system.
Reserve currency dominance is not merely a matter of economics; it embodies political influence, military strength, and institutional trust. Over time, it has dictated global trade patterns, shaped capital flows, and influenced monetary policy decisions across nations. This essay explores the evolution, mechanisms, and implications of reserve currency dominance, with particular focus on the U.S. dollar’s supremacy and emerging challenges in a multipolar world.
Historical Evolution of Reserve Currency Dominance
The concept of a reserve currency is centuries old. Historically, the dominant reserve currency has always been associated with the world’s leading economic and military power. During different eras, currencies such as the Venetian ducat, Spanish silver real, Dutch guilder, and British pound sterling held global reserve status. Each period of dominance reflected the geopolitical and economic influence of the issuing nation.
1. The British Pound Era (19th to early 20th century)
During the 19th century, the British Empire’s global reach made the pound sterling the leading reserve currency. London emerged as the world’s financial capital, and the gold standard provided monetary stability. Nations held pounds because they trusted Britain’s financial institutions and its vast trade networks. The sterling system symbolized confidence, liquidity, and convertibility into gold.
2. Transition to the U.S. Dollar (Post-World War II)
World War II shifted the economic balance of power. The United States emerged as the world’s industrial powerhouse, holding the majority of global gold reserves. The Bretton Woods Agreement (1944) institutionalized the U.S. dollar as the world’s primary reserve currency, pegged to gold at $35 per ounce. Other currencies were pegged to the dollar, effectively making it the world’s anchor currency.
3. Post-Bretton Woods and Dollar Supremacy
In 1971, President Richard Nixon ended the dollar’s convertibility to gold, marking the collapse of Bretton Woods. Yet, the dollar retained its dominance due to the Petrodollar system, in which oil prices were denominated in dollars, and the global reliance on U.S. financial markets. The U.S. economy’s depth, liquidity, and stability continued to attract foreign reserves, even without a gold peg.
Mechanisms Sustaining Reserve Currency Dominance
For a currency to dominate global reserves, several interlinked mechanisms must operate effectively:
1. Economic Scale and Stability
A dominant reserve currency is typically issued by the world’s largest and most stable economy. The United States accounts for a significant share of global GDP and trade, providing the dollar with a vast network of transactions. Economic scale ensures that the currency is widely used and trusted.
2. Deep and Liquid Financial Markets
Reserve currencies require large, stable, and liquid financial markets. The U.S. Treasury market, for example, is the most liquid in the world, allowing investors and central banks to buy and sell assets without major price fluctuations. The reliability of these markets gives central banks confidence in holding dollar-denominated assets.
3. Institutional Trust and Rule of Law
The credibility of the issuing nation’s institutions—its central bank, judiciary, and regulatory bodies—is vital. The U.S. Federal Reserve and the country’s legal system offer transparency, predictability, and strong investor protections. This institutional trust is a cornerstone of reserve currency dominance.
4. Network Effects
Once a currency becomes dominant, it benefits from self-reinforcing network effects. Global trade, finance, and commodities become priced in that currency, making it more convenient and efficient for countries to hold it as reserves. The more it is used, the more valuable it becomes for global participants.
5. Geopolitical and Military Influence
Reserve currency dominance often parallels military and political power. The U.S., through its global alliances and defense capabilities, has maintained a secure international environment that underpins confidence in its currency. Countries tend to hold the currency of a politically stable superpower rather than that of a regional or unstable state.
The Dollar’s Global Dominance
The U.S. dollar remains the world’s undisputed reserve currency, despite growing talk of diversification and de-dollarization. According to the International Monetary Fund (IMF), roughly 58% of global foreign exchange reserves are held in U.S. dollars (as of 2025). The euro follows with around 20%, while other currencies such as the Japanese yen, British pound, and Chinese yuan make up smaller portions.
1. Role in Global Trade
Approximately 80% of global trade transactions are invoiced in U.S. dollars. Even countries not directly trading with the U.S. use the dollar as a reference currency. This global acceptance simplifies pricing, invoicing, and payment settlements.
2. Dollar in Financial Markets
Global commodities—including oil, gold, and agricultural products—are predominantly priced in dollars. Additionally, international debt issuance and cross-border banking rely heavily on dollar-denominated assets, reinforcing the greenback’s global reach.
3. U.S. Treasury Securities
Central banks hold U.S. Treasury bonds as a primary form of reserves due to their safety and liquidity. During times of crisis, investors typically rush to U.S. assets, further strengthening the dollar’s position—a phenomenon known as the “flight to safety.”
Benefits of Reserve Currency Dominance
For the United States, reserve currency dominance brings numerous advantages that few other nations enjoy:
1. Lower Borrowing Costs
Because global demand for U.S. Treasury securities remains strong, the U.S. government can borrow at lower interest rates. This allows America to finance large fiscal deficits with relative ease—a phenomenon referred to as the “exorbitant privilege.”
2. Global Influence
The dollar’s dominance gives the U.S. substantial geopolitical leverage. Economic sanctions, trade restrictions, and financial controls imposed through the dollar-based system can effectively isolate nations from global finance.
3. Economic Stability
Global demand for dollars helps stabilize the U.S. economy by attracting continuous capital inflows. The dollar’s safe-haven status often cushions the U.S. from financial turbulence affecting other economies.
Costs and Risks of Dominance
While reserve currency dominance offers power and privilege, it also entails structural challenges:
1. Trade Deficits
To supply the world with dollars, the U.S. must run persistent current account deficits. This structural imbalance, known as the Triffin Dilemma, means that the U.S. must provide global liquidity even at the cost of domestic imbalances.
2. Policy Constraints
Because of the global demand for dollars, U.S. monetary policy has international consequences. Interest rate hikes or cuts by the Federal Reserve can trigger capital flows, currency fluctuations, and inflationary pressures across emerging markets.
3. Financial Overdependence
Excessive global reliance on the dollar creates vulnerabilities. Any disruption in the U.S. financial system—such as the 2008 crisis—spreads rapidly worldwide. The dollar’s centrality amplifies systemic risks.
Challenges to Dollar Dominance
Although the dollar remains unrivaled, several forces are gradually reshaping the reserve currency landscape.
1. Rise of the Euro
The euro, since its introduction in 1999, has become the second most held reserve currency. The European Union’s large economy and integrated financial systems support its use, though political fragmentation and lack of a unified fiscal policy limit its potential to dethrone the dollar.
2. The Chinese Yuan (Renminbi)
China’s yuan has been gaining recognition, particularly after its inclusion in the IMF’s Special Drawing Rights (SDR) basket in 2016. The Belt and Road Initiative (BRI), expansion of the Cross-Border Interbank Payment System (CIPS), and increasing yuan-denominated trade have supported China’s long-term ambitions for currency internationalization. However, capital controls and limited market transparency remain major obstacles.
3. Digital Currencies and CBDCs
The emergence of Central Bank Digital Currencies (CBDCs) and blockchain-based payment systems presents potential alternatives to traditional reserve systems. China’s digital yuan, for example, aims to reduce dependency on the dollar-dominated SWIFT system. Similarly, discussions of a BRICS currency or digital gold-backed instruments indicate growing interest in multipolar monetary frameworks.
4. De-dollarization Trends
In recent years, several nations have diversified their reserves away from the dollar. Russia, China, and members of the BRICS alliance have increased holdings of gold and other currencies. Moreover, countries are exploring bilateral trade in local currencies, particularly in energy and defense sectors.
Future Outlook: Multipolar Currency Order
The global financial architecture is gradually shifting from unipolar to multipolar. While the dollar’s dominance will likely continue in the medium term, structural trends suggest a slow diversification of global reserves.
Short-term outlook (2025–2035):
The dollar will remain dominant due to trust, liquidity, and institutional strength. Alternative systems may gain traction but won’t replace the dollar outright.
Medium-term outlook (2035–2050):
A multipolar system may emerge with the euro, yuan, and possibly digital assets sharing reserve functions. The share of the dollar could decline to around 40–45%.
Long-term outlook:
Global reserve systems may evolve into digital or commodity-backed models, reducing dependence on any single national currency. The rise of blockchain-based settlement systems may redefine monetary sovereignty and financial autonomy.
Conclusion
Reserve currency dominance has always been a reflection of global power structures—economic, political, and institutional. The U.S. dollar’s supremacy, forged after World War II, remains the cornerstone of the modern financial system. Its strength lies in America’s vast economic capacity, transparent markets, and geopolitical influence. Yet, this dominance is not guaranteed forever.
As the world transitions toward multipolarity—with the rise of China, the European Union’s consolidation, and the emergence of digital currencies—the foundations of the dollar-based order are being tested. While no alternative yet offers the same combination of trust, liquidity, and stability, the long-term trajectory suggests a gradual diversification of global reserves.
Ultimately, the future of reserve currency dominance will depend not only on economic fundamentals but also on technological innovation, geopolitical cooperation, and the resilience of global financial institutions. The dollar’s reign may persist, but the seeds of a new, more balanced monetary order are already being sown.

Competitive Currency War: An In-Depth AnalysisIntroduction
A competitive currency war, often termed a currency devaluation war, refers to a situation where countries deliberately devalue their currencies to gain a trade advantage over others. In essence, nations engage in a race to weaken their currencies to make exports cheaper and imports costlier, thereby stimulating domestic production and employment. However, while it may provide short-term gains to an individual nation, a widespread currency war can destabilize the global economy, heighten financial volatility, and strain international relations.
The term “currency war” became popular after Brazil’s finance minister Guido Mantega used it in 2010 to describe the growing wave of monetary interventions by major economies after the global financial crisis. Since then, the world has witnessed multiple instances of competitive devaluations, especially during times of economic stress—such as the 2008 crisis, the U.S.–China trade war, and the post-COVID recovery phase.
This essay explores the origins, mechanisms, historical examples, implications, and future trajectory of currency wars in an increasingly globalized and digital financial environment.
1. The Concept and Mechanics of Currency War
A currency war typically arises when multiple countries attempt to depreciate their currencies simultaneously to gain a competitive edge. The underlying mechanism involves monetary policy tools, foreign exchange interventions, and fiscal adjustments.
1.1 Key Mechanisms
Monetary Easing:
Central banks reduce interest rates or adopt quantitative easing (QE) to increase liquidity. Lower interest rates tend to weaken the currency, making exports cheaper.
Foreign Exchange Intervention:
Governments or central banks directly buy foreign currencies (like the U.S. dollar) while selling their own currency to suppress its value in the forex market.
Capital Controls:
Some nations impose restrictions on foreign capital inflows to prevent their currency from appreciating excessively.
Fiscal Expansion:
By increasing government spending or subsidies on export sectors, governments can indirectly stimulate output and trade competitiveness.
1.2 The Economic Logic
The basic idea is simple: if a country’s currency is cheaper relative to others, its exports become more competitive globally, while imports become more expensive. This can improve the trade balance, boost GDP, and create employment. However, this logic fails when every nation follows the same strategy — leading to global instability and inflationary pressures.
2. Historical Background of Currency Wars
Currency wars are not a new phenomenon. They have shaped the global economic order for more than a century, reflecting the interplay between national interests and international stability.
2.1 The Interwar Period (1920s–1930s)
Following World War I, countries abandoned the gold standard to devalue their currencies and support domestic recovery. The United Kingdom’s decision to leave the gold standard in 1931 triggered a wave of competitive devaluations, with nations like the U.S. and France soon following. The result was chaotic: trade collapsed, global demand shrank, and the Great Depression deepened.
2.2 The Bretton Woods System (1944–1971)
In response to interwar chaos, the Bretton Woods Agreement established a system of fixed exchange rates anchored to the U.S. dollar, which itself was convertible to gold. This arrangement aimed to stabilize exchange rates and prevent competitive devaluations. However, by the late 1960s, U.S. fiscal imbalances (due to the Vietnam War and social spending) eroded confidence in the dollar, leading President Richard Nixon to end gold convertibility in 1971 — effectively collapsing the system.
2.3 The 1980s: The Dollar and the Plaza Accord
During the early 1980s, the U.S. dollar surged due to tight monetary policy under Paul Volcker and Reagan-era fiscal expansion. This appreciation hurt U.S. exports and created large trade deficits, prompting the 1985 Plaza Accord. Under this agreement, major economies — the U.S., Japan, West Germany, France, and the U.K. — coordinated to weaken the dollar through joint interventions. This is one of the most successful examples of coordinated currency management in modern history.
2.4 The 2008 Global Financial Crisis and Modern Currency Wars
After 2008, central banks worldwide adopted ultra-loose monetary policies, driving down interest rates and flooding markets with liquidity. The U.S. Federal Reserve’s quantitative easing was followed by similar measures in Europe and Japan. Emerging markets, especially Brazil and China, accused developed nations of starting a “currency war” by artificially suppressing exchange rates through excessive money printing.
2.5 The 2010s: U.S.–China Currency Tensions
China was often accused of manipulating its currency, the yuan, to maintain export competitiveness. The U.S. claimed that China’s undervalued yuan hurt American manufacturing. Although China gradually allowed more flexibility in its exchange rate, tensions resurfaced during the Trump administration, when tariffs and currency rhetoric became central tools in the trade war.
3. The Economic Consequences of Currency Wars
While currency devaluation may offer short-term benefits, its long-term consequences are often counterproductive for both domestic and global economies.
3.1 Short-Term Gains
Boost in Exports:
A weaker currency makes exports more affordable in global markets, improving trade balances.
Inflation Control (in Deflationary Contexts):
Devaluation can prevent deflation by raising import prices, stimulating spending and investment.
3.2 Long-Term Costs
Imported Inflation:
Weaker currencies make imports more expensive, leading to rising prices for essential goods such as energy, food, and technology.
Erosion of Investor Confidence:
Persistent devaluation discourages foreign investment, as investors fear currency losses.
Retaliatory Policies:
Competing nations may also devalue their currencies, neutralizing any advantage and sparking global instability.
Debt Burden Escalation:
Countries with high levels of foreign-denominated debt face higher repayment costs when their currencies fall.
Global Imbalances:
Uncoordinated devaluations can distort trade flows and fuel protectionism, undermining international cooperation.
4. Modern Dynamics: Currency Wars in the Digital Era
In the 21st century, currency wars have become more complex, influenced by technological innovation, digital finance, and geopolitical realignments.
4.1 Central Bank Digital Currencies (CBDCs)
The rise of CBDCs — digital forms of fiat currency issued by central banks — could transform how nations compete monetarily. For instance, China’s digital yuan (e-CNY) aims to internationalize its currency and reduce dependence on the U.S. dollar-dominated SWIFT system. This digital shift introduces new dimensions of currency competition based on technological infrastructure and cross-border payment dominance.
4.2 Artificial Intelligence and Algorithmic Trading
AI-driven trading systems now play a significant role in foreign exchange markets, amplifying the speed and scale of currency adjustments. Automated capital flows can accelerate devaluations or appreciations beyond the control of policymakers, increasing market volatility.
4.3 The De-Dollarization Movement
Many emerging economies are actively seeking to reduce dependence on the U.S. dollar for international trade. BRICS nations — Brazil, Russia, India, China, and South Africa — have proposed alternative payment mechanisms and a potential shared currency. This shift poses a strategic challenge to U.S. monetary dominance and adds a new layer to currency competition.
4.4 Geopolitical Dimensions
Currency strategies increasingly intersect with geopolitics. Sanctions, trade restrictions, and financial exclusion (as seen with Russia post-Ukraine conflict) have turned monetary tools into instruments of geopolitical power. As countries seek to protect their financial sovereignty, competitive currency strategies are becoming more politically motivated.
5. Case Studies of Recent Currency Conflicts
5.1 Japan’s Abenomics (2013–2020)
Under former Prime Minister Shinzo Abe, Japan implemented aggressive monetary easing to fight deflation and revive growth. The Bank of Japan’s asset purchases significantly weakened the yen, boosting exports but drawing criticism from trade partners who viewed it as a form of currency manipulation.
5.2 U.S.–China Trade and Currency Tensions
In 2019, the U.S. Treasury officially labeled China a “currency manipulator” after the yuan fell past the symbolic 7-per-dollar level. Although the label was later removed, it highlighted the deep-rooted suspicions surrounding exchange rate practices and the link between trade policy and currency valuation.
5.3 Emerging Market Vulnerabilities
Countries like Argentina and Turkey have repeatedly used currency depreciation as a policy tool, often resulting in runaway inflation and capital flight. These cases illustrate how uncoordinated devaluations can spiral into economic crises if not supported by structural reforms.
6. Policy Responses and Global Coordination
To mitigate the risks of currency wars, international coordination is essential. Several mechanisms have evolved to maintain monetary stability:
International Monetary Fund (IMF):
The IMF monitors exchange rate policies and provides financial assistance to stabilize economies under currency pressure.
G7 and G20 Frameworks:
These platforms promote policy coordination among major economies to prevent destructive currency competition.
Regional Arrangements:
Asian and European monetary frameworks (like the European Monetary System) have been developed to ensure exchange rate stability within regions.
Transparency and Communication:
Clear communication from central banks regarding policy objectives can help reduce market misinterpretation and speculative attacks.
However, in practice, such coordination is often difficult to sustain, as nations prioritize domestic growth over global harmony.
7. The Future of Currency Wars
The future of competitive currency strategies will depend on several evolving trends:
Digitalization of Money:
CBDCs and blockchain-based financial systems could shift competitive dynamics from traditional exchange rate manipulation to digital payment dominance.
De-Dollarization and Multipolarity:
The gradual emergence of alternative global currencies — like the yuan, euro, and rupee — could weaken the dollar’s monopoly, creating a more fragmented but competitive global system.
Climate and Economic Resilience:
Currency policies may increasingly align with sustainability objectives, as nations consider the long-term environmental implications of growth-driven devaluations.
AI-Driven Monetary Forecasting:
Artificial intelligence may enable more precise, data-driven currency management — reducing human error but possibly intensifying algorithmic competition.
Conclusion
The competitive currency war embodies the tension between national economic goals and global financial stability. While currency devaluation can temporarily stimulate exports and growth, it often triggers retaliation, inflation, and uncertainty — eroding trust in international systems. History shows that no country truly “wins” a currency war; all participants eventually bear the costs through reduced global trade, volatility, and weakened economic cooperation.
In the modern era, with digital currencies, AI-driven finance, and shifting geopolitical alliances, currency competition is evolving beyond traditional devaluation. The challenge for policymakers lies in balancing national interest with collective responsibility. Only through transparent policies, cooperative frameworks, and digital innovation can the world avoid sliding into another era of destructive monetary rivalry.
De-Dollarization and the Emerging Global Currency WarIntroduction
For over seven decades, the U.S. dollar has been the backbone of the global financial system. It serves as the world’s dominant reserve currency, the primary medium of exchange in international trade, and the benchmark for commodities such as oil and gold. However, in recent years, a powerful shift has been gaining momentum—de-dollarization, a global trend in which nations seek to reduce their reliance on the U.S. dollar in favor of alternative currencies or mechanisms of trade. This movement is not merely economic; it carries profound geopolitical implications, signaling a potential currency war that could reshape the global monetary order.
De-dollarization has been driven by a combination of strategic, economic, and political motivations—ranging from the desire for financial sovereignty and protection from U.S. sanctions to the ambition of rising powers like China and Russia to challenge the dollar’s hegemony. As this shift accelerates, global markets, trade systems, and geopolitical alliances are being redefined.
Historical Background: How the Dollar Became Dominant
The dollar’s supremacy began after World War II, when the Bretton Woods Agreement (1944) established the U.S. dollar as the anchor of the international monetary system. Under this system, the dollar was pegged to gold at $35 per ounce, and other currencies were tied to the dollar. This arrangement created a foundation for global trade stability and positioned the U.S. as the world’s economic leader.
After the collapse of the Bretton Woods system in 1971, when President Richard Nixon ended the dollar’s convertibility to gold, the world transitioned to a fiat currency system. Despite this, the dollar retained its dominance due to several factors:
The U.S. economy’s size and stability.
The depth and liquidity of U.S. financial markets.
The role of the dollar in global trade, particularly in oil transactions (the "petrodollar system").
The trust in U.S. institutions and political stability.
These elements allowed the U.S. to maintain what many economists call an “exorbitant privilege”—the ability to print the world’s reserve currency, borrow cheaply, and influence global financial flows.
The Roots of De-Dollarization
The movement toward de-dollarization did not happen overnight. It is the result of cumulative tensions and global transformations over the past two decades. Several major developments have fueled this shift:
1. U.S. Sanctions and Financial Weaponization
The United States has frequently used its control over the global financial system as a tool of foreign policy. Countries like Russia, Iran, Venezuela, and China have faced economic sanctions that restrict their access to dollar-based systems such as SWIFT (the Society for Worldwide Interbank Financial Telecommunication). This has motivated these nations to develop alternative payment systems and trade arrangements that bypass the dollar.
2. The Rise of Multipolar Geopolitics
The post-Cold War era saw the U.S. as the sole superpower. However, the 21st century has ushered in a multipolar world, with China, Russia, India, and regional alliances (like BRICS and ASEAN) asserting greater influence. These nations aim to diversify their reserves and promote the use of their own currencies in international trade, challenging U.S. financial dominance.
3. The Decline of Trust in U.S. Fiscal Policy
Massive U.S. debt levels, persistent fiscal deficits, and the use of the dollar as a domestic political tool have raised concerns among global investors. The dollar’s long-term stability has been questioned as the U.S. continues to issue trillions in debt, leading to fears of inflation and currency depreciation.
4. Technological and Financial Innovations
The rise of digital currencies, blockchain technology, and central bank digital currencies (CBDCs) offers nations new tools to settle international transactions without relying on the U.S. dollar. China, for example, has launched the digital yuan (e-CNY), which could become a key instrument in cross-border trade within the Belt and Road Initiative.
Key Players in the De-Dollarization Movement
1. China
China is the leading force behind de-dollarization. Its goals are twofold: reduce dependence on the U.S. financial system and elevate the renminbi (yuan) as a global currency.
China has signed bilateral currency swap agreements with over 40 countries.
The Petro-yuan—China’s push to settle oil contracts in yuan—has gained traction, particularly with Russia, Iran, and Saudi Arabia.
The Belt and Road Initiative (BRI) also promotes trade in local currencies.
The launch of Cross-Border Interbank Payment System (CIPS) serves as an alternative to SWIFT.
2. Russia
Since facing Western sanctions after the annexation of Crimea in 2014—and more aggressively after the 2022 invasion of Ukraine—Russia has led efforts to abandon the dollar in trade and reserves.
Moscow now settles most of its energy exports with China and India in yuan, rubles, or rupees.
Russia’s central bank has drastically reduced its dollar holdings, replacing them with gold and Chinese currency.
The Kremlin has been actively promoting BRICS financial cooperation to build a non-dollar-based monetary framework.
3. BRICS Bloc
The BRICS alliance (Brazil, Russia, India, China, and South Africa)—expanded in 2024 to include nations like Saudi Arabia, Iran, and the UAE—is exploring the creation of a common reserve currency or digital settlement unit. This currency, backed by a basket of commodities or national currencies, could eventually rival the dollar in trade among emerging economies.
4. Middle East and Africa
Oil producers in the Gulf Cooperation Council (GCC), notably Saudi Arabia, have begun accepting non-dollar payments for oil exports. The Saudi-China oil settlement in yuan marks a historic break from the petrodollar era. Similarly, African nations are exploring local currency trade mechanisms to reduce dollar dependency.
Mechanisms of De-Dollarization
De-dollarization is taking place through multiple channels, including:
Bilateral trade settlements using local currencies (e.g., India-Russia trade in rupees and rubles).
Reserve diversification by central banks—reducing U.S. Treasury holdings and increasing gold or other currency reserves.
Alternative payment systems, such as China’s CIPS, Russia’s SPFS, and regional financial networks.
Commodity pricing reforms, particularly in energy markets, moving away from the dollar standard.
Use of CBDCs and digital assets for cross-border transactions.
The Emerging Currency War
The term “currency war” refers to the competition among nations to devalue or manipulate their currencies for trade advantages or to gain influence in global finance. In the modern context, it has evolved into a geostrategic battle for monetary dominance—a conflict over who controls the mechanisms of trade and capital flow.
1. U.S. Response
The U.S. continues to leverage its financial institutions, global alliances, and sanctions power to maintain dollar dominance. Washington’s focus remains on safeguarding the dollar’s role as the world’s reserve currency, but growing deficits and domestic political polarization may weaken its position.
2. China’s Monetary Strategy
China’s approach is subtle but strategic. It does not aim to immediately dethrone the dollar but rather build parallel systems that gradually erode the dollar’s centrality. Through regional trade blocs, the Asian Infrastructure Investment Bank (AIIB), and digital yuan experiments, Beijing is laying the groundwork for a multipolar financial order.
3. BRICS Common Currency Proposal
If BRICS successfully introduces a shared settlement currency, backed by commodities like gold or oil, it could serve as a credible alternative for trade among emerging markets. This would mark the first real institutional challenge to the dollar since the creation of the euro.
4. U.S.-China Economic Rivalry
The de-dollarization trend is tightly intertwined with the broader U.S.-China geopolitical rivalry. Both nations are competing for technological supremacy, trade dominance, and control over digital financial infrastructure. The outcome of this rivalry will likely define the contours of the 21st-century monetary order.
Economic Implications of De-Dollarization
1. For the United States
Reduced global demand for U.S. Treasuries could push up borrowing costs and weaken fiscal flexibility.
The loss of seigniorage benefits (profits from issuing currency used globally) would strain U.S. finances.
Dollar depreciation could occur if confidence erodes significantly.
However, the U.S. still maintains strong institutional and market trust, which makes a sudden collapse unlikely.
2. For Emerging Economies
De-dollarization could enhance monetary sovereignty and reduce vulnerability to U.S. interest rate policies.
It may stabilize trade between developing nations through local currency settlements.
However, the lack of liquidity and convertibility of alternative currencies poses short-term challenges.
Coordination issues among BRICS members could also limit effectiveness.
3. For Global Trade and Investment
A multipolar currency system could reduce systemic risk by diversifying reserve holdings.
It might complicate global transactions, as exchange rate volatility increases.
Gold and digital assets could become more prominent as neutral reserve assets.
The Role of Digital Currencies and Blockchain
Central bank digital currencies (CBDCs) represent the next frontier in the currency war.
China’s digital yuan has already been used in pilot cross-border settlements.
The BRICS Pay system aims to facilitate digital settlements without SWIFT.
The U.S. Federal Reserve is cautiously exploring a digital dollar, wary of losing financial privacy and control.
Blockchain-based payment networks could fundamentally alter international finance by reducing transaction costs, bypassing sanctions, and enhancing transparency.
Challenges and Limitations of De-Dollarization
While the movement is accelerating, full de-dollarization faces structural barriers:
The dollar still accounts for around 58–60% of global reserves (as of 2025).
Most global trade contracts and commodity pricing remain dollar-based.
Financial markets in other currencies lack the liquidity and trust of U.S. assets.
The network effect of the dollar—its widespread use reinforcing its dominance—is difficult to dismantle quickly.
Hence, while de-dollarization is real, it is more of a gradual rebalancing than an abrupt replacement.
Future Outlook
In the coming decade, the global monetary system is likely to evolve into a hybrid multipolar model rather than a unipolar one. The dollar will remain dominant but with reduced influence, sharing space with the yuan, euro, and possibly a BRICS-linked currency. The race will depend on:
The technological adoption of digital currencies,
The economic strength of emerging markets, and
The geopolitical realignments of global trade networks.
If current trends continue, by 2035, global reserves could become more evenly distributed among major currencies, diminishing U.S. leverage in economic diplomacy.
Conclusion
De-dollarization and the ensuing currency war represent one of the most significant shifts in global economics since the fall of Bretton Woods. The world is witnessing the gradual decline of U.S. monetary hegemony and the rise of a multipolar financial ecosystem. While the dollar’s dominance is unlikely to vanish overnight, its uncontested status is being eroded by strategic alliances, technological innovation, and geopolitical transformation.
Ultimately, the outcome will depend not only on economic policies but also on trust—the most valuable currency of all. Whether nations continue to trust the U.S. dollar or pivot toward a diversified basket of currencies will shape the architecture of the 21st-century global economy.

What is the CPI and how is it measuredUnderstanding the Consumer Price Index (CPI)
The Consumer Price Index (CPI) is one of the most important economic indicators used globally to measure inflation, the cost of living, and the general price level of goods and services over time. It serves as a key tool for policymakers, economists, researchers, businesses, and the public to understand how prices are changing and how those changes affect households and the economy.
In simple terms, the CPI measures the average change over time in the prices paid by consumers for a basket of goods and services. This basket represents typical consumption patterns of households and includes items such as food, clothing, housing, transportation, medical care, education, recreation, and other essentials. By tracking changes in the cost of this basket, the CPI gives an indication of how much prices have risen or fallen, which is crucial for assessing inflation and purchasing power.
Why CPI is Important
Indicator of Inflation:
Inflation reflects the rate at which the general level of prices for goods and services is rising. CPI is the most widely used measure of inflation because it directly reflects consumer experiences. Rising CPI indicates higher inflation, meaning the cost of living is increasing, while a falling CPI may suggest deflation.
Policy Formulation:
Governments and central banks, such as the Reserve Bank of India or the Federal Reserve in the U.S., rely on CPI to set monetary policy. For example, if CPI shows high inflation, a central bank may raise interest rates to reduce money supply and control inflation. Conversely, low CPI or deflation may prompt the central bank to lower interest rates.
Adjusting Income and Wages:
CPI is used to adjust wages, pensions, and social security payments to maintain purchasing power. For instance, if inflation is 5%, wages might be increased by a similar percentage to ensure that people can maintain their standard of living.
Economic Analysis:
Economists use CPI to compare price levels over time, analyze trends in consumer spending, and study the health of the economy. It is also used to deflate nominal values in economic statistics, such as GDP, to account for the effect of price changes.
How CPI is Measured
The process of measuring CPI is rigorous and involves several steps. Although methodologies may vary slightly from country to country, the core principles remain consistent.
Step 1: Defining the Basket of Goods and Services
The first step in calculating CPI is to determine what goods and services are included. These items are selected based on household consumption patterns, which are determined through surveys such as the Consumer Expenditure Survey (CES). These surveys collect data on how households spend their income across different categories.
The basket typically includes categories like:
Food and beverages: Rice, wheat, fruits, vegetables, dairy products, meat, beverages.
Housing: Rent, utilities, maintenance.
Clothing and footwear: Apparel for men, women, and children.
Transportation: Public transport, fuel, vehicles.
Healthcare: Medicines, medical services, hospital charges.
Education: School fees, books, and supplies.
Recreation and entertainment: Movies, hobbies, sporting activities.
Miscellaneous goods and services: Personal care, insurance, and other everyday expenses.
Each item in the basket is assigned a weight that represents its relative importance in household expenditure. For example, in countries where households spend a significant portion of income on food, the weight of food in the CPI basket will be higher. These weights are essential because they ensure that changes in prices of commonly purchased items have a bigger impact on the CPI than items that are rarely bought.
Step 2: Collecting Price Data
Once the basket is defined, the next step is to collect price data. Prices are collected periodically (usually monthly) from a range of retail outlets, service providers, online platforms, and markets to reflect real consumer spending. Data collectors ensure the information represents different regions, urban and rural areas, and various types of stores.
Price collection is meticulous and considers factors such as:
Product quality and specifications: Prices for the same product should be comparable over time.
Availability: Prices are collected from multiple sources to account for variation.
Regional differences: CPI may include regional price indices if consumption patterns differ widely between areas.
Types of CPI
Many countries compute multiple types of CPI to cater to different analytical purposes:
CPI for All Urban Consumers (CPI-U): Measures prices for urban households.
CPI for Rural Consumers (CPI-R): Measures prices in rural areas.
Core CPI: Excludes volatile items such as food and energy to give a clearer picture of underlying inflation trends.
CPI-W: For wage earners, often used to adjust social security benefits.
Each type helps policymakers understand how inflation affects different groups in society.
Challenges in Measuring CPI
While CPI is widely used, it is not without challenges:
Substitution Bias: Consumers may switch to cheaper alternatives when prices rise, but traditional CPI assumes a fixed basket.
Quality Changes: Improvements or deterioration in product quality can affect prices but are difficult to adjust for accurately.
New Products: Rapid technological changes introduce new goods that may not be immediately included in the CPI basket.
Regional Differences: Prices can vary widely across regions, making national CPI an approximation.
Housing Costs: Different methods, such as rent or owner-equivalent rent, can influence CPI calculations.
Applications of CPI
Economic Policy: Governments monitor CPI for monetary and fiscal decisions.
Cost-of-Living Adjustments (COLAs): CPI ensures wages, pensions, and contracts keep up with inflation.
Business Decisions: Companies use CPI trends for pricing strategies, forecasting, and budgeting.
Investments: Investors analyze CPI to make decisions on stocks, bonds, and commodities, as inflation affects returns.
Conclusion
The Consumer Price Index is a critical economic tool that quantifies changes in the cost of living and provides a window into the inflationary trends of an economy. Its meticulous calculation—from selecting a representative basket of goods to weighting, pricing, and aggregation—ensures that it reflects the everyday experiences of consumers. While it has limitations, CPI remains essential for policymakers, businesses, researchers, and households to make informed decisions, maintain purchasing power, and understand the dynamics of an economy.
By understanding CPI, one can not only track the rise or fall in prices but also comprehend broader economic trends, making it a foundational concept in economics and personal finance.