Bullish until it isn'tStructural trendline had a false breakdown and recovery, so it's bullish until it isn't. VIX also showing some bear divergences on smaller time frames.
Community ideas

DXY still bearishContinuation of down trend. A clear break of the ascending trend line would be needed before continuing to short usd pairs

ZEC 1W Update: Zooming out to learn moreZEC remains in a corrective phase on the weekly timeframe following the blow-off top toward the 700 region and the sharp rejection that followed. The key structural shift occurred with the loss of 300, which had acted as a major breakout and acceptance level. Since losing that pivot, price has continued to bleed lower and is now consolidating in the mid-200s, showing no strong impulsive bounce yet.
Momentum has clearly cooled, and the market is transitioning from expansion into redistribution or deeper correction. The current 220–240 area is attempting to act as a short-term stabilization zone, but structurally the chart does not regain strength unless ZEC can reclaim 300 on a weekly closing basis. Without that reclaim, rallies are likely to be corrective in nature.
On the downside, continued acceptance below 230 opens the door for a move into prior consolidation zones from before the breakout, which would imply a more prolonged digestion phase. That said, the larger cycle context still suggests this could be a volatile retracement following an extreme vertical move rather than a full macro reversal. The next few weekly closes are critical in determining whether ZEC builds a higher low here or continues unwinding the parabolic advance.

Just bought some more CoreWeave $CRWV as we’ve broken out of a Just bought some more CoreWeave NASDAQ:CRWV as we’ve broken out of a 4-day consolidation range.
The broader context remains constructive:
- We’ve now formed a triple bottom, reinforcing short-term support.
- Price is still consolidating within a larger bull flag, keeping the higher-timeframe structure intact.

EURUSD – Bearish Breakdown After Range Failure (H1)
EURUSD on the 1H timeframe shows a strong impulsive rally that moved inside an ascending channel, followed by a period of consolidation (range) near the highs. Price then broke down sharply from the range and dropped below the Ichimoku cloud, signaling a shift in momentum from bullish to bearish. The current structure suggests weak follow-through to the upside, with price consolidating below resistance and a potential continuation move toward the highlighted downside target zone.

BTCUSD 15M | Support Hold Aiming for 69.9K BreakoutStructure Overview:
Clear ascending channel with higher highs and higher lows.
Strong impulsive breakout toward 68.8K.
Current price consolidating above support (68.5K–68.6K zone).
Bullish continuation likely if support holds.
📈 Trade Setup:
Entry: 68,500–68,600 (support retest area)
Stop Loss: Below 68,100 (under structure support)
Target: 69,900–70,000 (upper resistance / liquidity zone)
🧠 Market Logic:
Buyers stepped in aggressively from channel support and pushed price toward local highs. The consolidation above 68.5K suggests absorption rather than rejection. As long as price holds above the support block, continuation toward 69.9K liquidity looks probable.
A breakdown below 68.1K would weaken the bullish structure and shift bias short-term bearish.

XAU/USDT — Overextension Risk After Parabolic YearGold has delivered nearly 2× in a year, following an additional +35% move before that.
For an asset traditionally viewed as a store of value, this is exceptional. Historically, gold is not highly volatile.
However, it is now actively traded on crypto exchanges — not only via tokenized gold (XAUT), but also through futures and derivatives.
Recently, it has behaved more like a high-beta asset, with corrections of 20%+ in just a few days.
This may be the first signal of a global correction.
The main argument is historical RSI overbought conditions.
In previous cycles, overbought readings alone were not enough for a full reversal — a monthly bearish divergence typically formed before major tops.
That process can take months or even a year. It’s not mandatory, but statistically more common.
Two scenarios remain on the table:
1️⃣ A final push to new highs, followed by divergence formation.
2️⃣ A reversal starting from current levels.
On the weekly timeframe, a bearish candle structure has formed.
Confirmation requires a sustained break and hold below 4800.


AlDawaa BuyPrice at lowest
Touching and consolidation at the low of descending channel
Multiple Bullish engulfings and rejections
SL-48
TP1-67-69
TP2- Hold- Historical High 100+

EURAUD | Trend Continuation Watch After Failed ReversalEarlier this week, we attempted a reversal trade on EURAUD that was stopped out on Wednesday. That scenario is now off the table.
Zooming out, EURAUD has been in a strong downtrend since mid-December, and the current structure supports a trend continuation narrative.
What we see now:
A solid break below the prior support zone
A strong pullback into that zone as new resistance
Multiple candles with upper wicks, showing rejection and inability to push higher
Early signs of seller response at resistance
One current concern:
Momentum is only around 62, which is not ideal and requires patience
What must happen next:
Momentum needs to strengthen in the direction of the trend
Volume must confirm participation
Structure must remain clean and respected
This is watchlist only until all VMS conditions align.
Same market. New context.
Now we let the market confirm.
Not financial advice. For educational purposes only.

EURUSD Analysis (A move to 1.20 ) - #1FX:EURUSD remains in a clear bullish trend, continuing the steady rise that began in July 2025, with price respecting a well-defined ascending channel. The overall structure shows consistent higher highs and higher lows, confirming sustained buyer control and healthy trend continuation.
At the start of the week, the pair printed a strong bullish Marubozu candle, signaling strong momentum and commitment from buyers. Since then, price has entered a controlled pullback phase, gradually retracing toward the EMA(21) on the daily timeframe. This level is acting as dynamic support, and as long as price holds above it, the broader bullish structure remains intact.
The primary scenario favors continuation toward the upper boundary of the rising channel, which currently sits above the 1.20 level. A sustained move in this direction would confirm ongoing bullish strength and trend continuation.
On the downside, additional support is located around the 1.1800–1.1780 zone. A break below this region would weaken the short-term bullish outlook and could trigger a deeper pullback toward the lower boundary of the channel, where buyers may step in again.
Overall, bias remains bullish while price holds above key dynamic and structural support levels.

Bitcoin bounces nicely off key supportLast Friday we saw a big rally in Bitcoin. For much of this week, we saw continued bearish price action. Today, we are seeing another rebound in BTC. This time, price is finding support from the key area shaded on the chart between 65K to 66.5K. Now it is testing another pivotal area around 69K. Can it start to climb above this level too? If so, and it if it can hold above it, this will be a clear bullish signal on the lower time frames. On the higher time frames, recall that we are in a massive technical zone. A lot can still go wrong, but these are some positive signs.
Fawad Razaqzada, market analyst with FOREX.com

Will gold hit 6k?After analysing the chart, I observe that price has formed a bull flag channel, which is a strong bullish continuation pattern with a projected target around 6000.
The remainder of the analysis is detailed directly on the chart.

AUDCAD | Uptrend Pullback Into Key Support – Structure MattersAUDCAD has been in a clear uptrend since mid-December and is now making a solid pullback into a strong support zone that has been tested twice previously.
Last Monday, we passed on a setup on this pair because the level had only one prior touch (then acting as resistance). The structure was not strong enough, so we stayed patient. That decision proved correct, as that setup would have resulted in a loss.
Now, we are seeing a different setup altogether.
Price delivered a clean break higher with strong candle structure, followed by a pullback into what is now validated support. Momentum is currently deeply negative (-69) and still pressing lower, keeping this in a wait state.
What we are watching for:
Clear rejection from the support zone
Momentum hooking back up with the higher-timeframe trend
Strong volume confirmation across multiple timeframes
This is a good example of why structure and patience matter. Same market—very different context.
No trade yet. We wait for alignment.
Not financial advice. For educational purposes only.

GoldBias: Sell
Setup: EW (correction)
Execute confirmation/Correlation:
1) SBT
2) ZE/ZM
3) BPL
4) FVG
Risk:Reward= Min 1:2

This is a review of coffee and I added other marketsFebruary 13th in this video I showed very briefly some of the patterns that I look at. I'm trying to show the tools that I use and the important patterns that I look fo so I started with coffee and then I decided to just not talk and just pull the cursor lower to look at other markets because I haven't looked at them today and I found that there are actually a couple of good setups to go along so I decided to do this keep this and would suggest that you look at this market to the end because there are two potential long trades not today but next week.

AAPL CCI system read: daily scaleBulls keep winning in the CCI system challenges. I am focusing on the upper 260s-low 270s area for entry. Target into mid-upper 300s currently.
Will play it with out of money calls due to the structure I need to maintain to stay inside my trading discipline. I use a 5% stop but the stop area (250 zone) does not fit that profile so I'll use out of money calls here with the potential downside being 5% of the lot size value I'd use if I bought the stock. That said, if the anticipated pullback which will even allow me to position long does get to the low 260s I will follow the more traditional path of buying the stock.
Do have a heavy travel schedule for the next 4 weeks, I may miss this all together

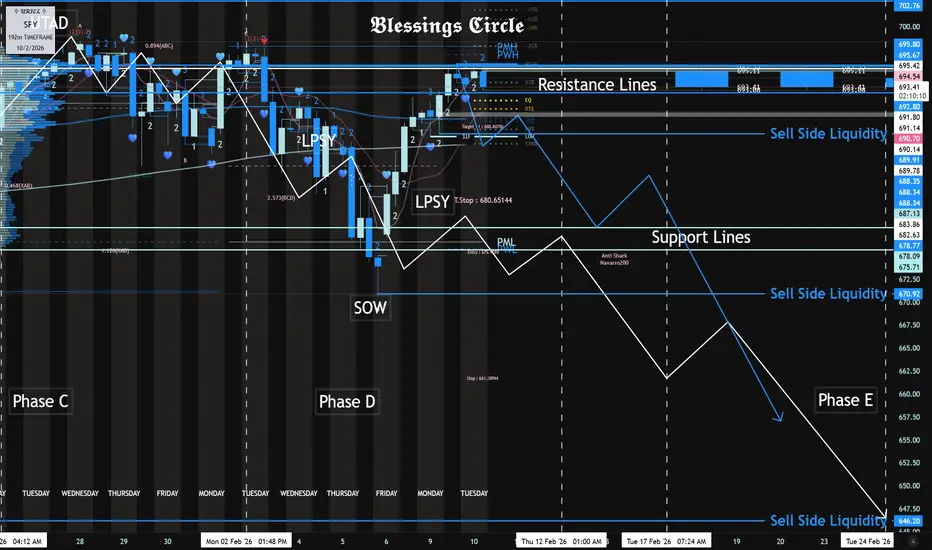
SPY Distribution Schematic Sub 650 by EOMAs Long As 695.80 - 695.67 Resistance Is Respected Today.
The Sells Targets Are As Follows:
SPY Sub 650 by Late Feb.
SPY Sub 600 by End of March.
Part Two:
NZDUSD H1 | Bullish Bounce Off Pullback SupportMomentum: Bullish
Price is currently above the ichimoku cloud.
Buy entry: 0.60488
- Pullback support
- 78.6% Fib retracement
Stop Loss: 0.60321
- Overlap support
Take Profit: 0.60742
- Swing high resistance
High Risk Investment Warning
Stratos Markets Limited (fxcm.com/uk), Stratos Europe Ltd (fxcm.com/eu):
CFDs are complex instruments and come with a high risk of losing money rapidly due to leverage. 69% of retail investor accounts lose money when trading CFDs with this provider. You should consider whether you understand how CFDs work and whether you can afford to take the high risk of losing your money.
Stratos Global LLC (fxcm.com/en): Losses can exceed deposits.
Please be advised that the information presented on TradingView is provided to FXCM (‘Company’, ‘we’) by a third-party provider (‘TFA Global Pte Ltd’). Please be reminded that you are solely responsible for the trading decisions on your account. Any information and/or content is intended entirely for research, educational and informational purposes only and does not constitute investment or consultation advice or investment strategy. The information is not tailored to the investment needs of any specific person and therefore does not involve a consideration of any of the investment objectives, financial situation or needs of any viewer that may receive it. Past performance is not a reliable indicator of future results. Actual results may differ materially from those anticipated in forward-looking or past performance statements. We assume no liability as to the accuracy or completeness of any of the information and/or content provided herein and the Company cannot be held responsible for any omission, mistake nor for any loss or damage including without limitation to any loss of profit which may arise from reliance on any information supplied by TFA Global Pte Ltd.
Stratos Trading Pty. Limited (fxcm.com/au):
Trading FX/CFDs carries significant risks. FXCM AU (AFSL 309763), please read the Financial Services Guide, Product Disclosure Statement, Target Market Determination and Terms of Business at fxcm.com/au

EURUSD H1 | Bearish Reaction Off Key ResistanceMomentum: Bearish
Price is currently below the ichimoku cloud.
Sell entry: 1.19093
- Pullback resistance
- 78.6% Fib retracement
- Fair value gap
Stop Loss: 1.19310
- Swing high resistance
Take Profit: 1.18726
- Swing low support
High Risk Investment Warning
Stratos Markets Limited (fxcm.com/uk), Stratos Europe Ltd (fxcm.com/eu):
CFDs are complex instruments and come with a high risk of losing money rapidly due to leverage. 69% of retail investor accounts lose money when trading CFDs with this provider. You should consider whether you understand how CFDs work and whether you can afford to take the high risk of losing your money.
Stratos Global LLC (fxcm.com/en): Losses can exceed deposits.
Please be advised that the information presented on TradingView is provided to FXCM (‘Company’, ‘we’) by a third-party provider (‘TFA Global Pte Ltd’). Please be reminded that you are solely responsible for the trading decisions on your account. Any information and/or content is intended entirely for research, educational and informational purposes only and does not constitute investment or consultation advice or investment strategy. The information is not tailored to the investment needs of any specific person and therefore does not involve a consideration of any of the investment objectives, financial situation or needs of any viewer that may receive it. Past performance is not a reliable indicator of future results. Actual results may differ materially from those anticipated in forward-looking or past performance statements. We assume no liability as to the accuracy or completeness of any of the information and/or content provided herein and the Company cannot be held responsible for any omission, mistake nor for any loss or damage including without limitation to any loss of profit which may arise from reliance on any information supplied by TFA Global Pte Ltd.
Stratos Trading Pty. Limited (fxcm.com/au):
Trading FX/CFDs carries significant risks. FXCM AU (AFSL 309763), please read the Financial Services Guide, Product Disclosure Statement, Target Market Determination and Terms of Business at fxcm.com/au

EurUsd short term sell ideaPair: EUR/USD
Position: Sell Now
Stoploss: 1.18900
Take Profit 1: 1.18428
Take Profit 2: 1.18300
Overall, I am still bullish on EUR/USD from the higher timeframes. However, price has broken the bullish trendline, and we are anticipating a potential break of support. Because of this shift in short-term structure, I am taking this sell setup.
CPI news is scheduled for tomorrow at 8:30 AM, so we could see increased volatility.

GBPNZD Is Very Bearish! Sell!
Here is our detailed technical review for GBPNZD.
Time Frame: 1h
Current Trend: Bearish
Sentiment: Overbought (based on 7-period RSI)
Forecast: Bearish
The market is approaching a significant resistance area 2.258.
Due to the fact that we see a positive bearish reaction from the underlined area, I strongly believe that sellers will manage to push the price all the way down to 2.251 level.
P.S
Please, note that an oversold/overbought condition can last for a long time, and therefore being oversold/overbought doesn't mean a price rally will come soon, or at all.
Like and subscribe and comment my ideas if you enjoy them!

Nvidia May Be RangeboundNvidia has gone nowhere since October, and some traders may think the AI giant is rangebound.
The first pattern on today’s chart is the December 26 high of $192.69. NVDA probed that level in late January and again this month without breaking out. That may suggest that resistance is in place.
Second is the December 17 low of $170.31. The stock fell near that level last month and bounced, which could mean it’s providing support.
Third, NVDA made a higher high yesterday before reversing and closing below the previous session’s low. That bearish outside day is a potential reversal pattern.
Fourth, the 50-day simple moving average (SMA) crossed below the 100-day SMA last month and has stayed there since. Could that signal a weaker long-term trend?
Next, stochastics are dipping from near an overbought condition.
Finally, NVDA is a highly active underlier in the options market. (Its average daily volume of 2.4 million contracts ranks first in the S&P 500, according to TradeStation data.) That could help traders take positions with calls and puts.
TradeStation has, for decades, advanced the trading industry, providing access to stocks, options and futures. If you're born to trade, we could be for you. Learn more here about TradingView’s Broker of the Year!
Past performance, whether actual or indicated by historical tests of strategies, is no guarantee of future performance or success. There is a possibility that you may sustain a loss equal to or greater than your entire investment regardless of which asset class you trade (equities, options or futures); therefore, you should not invest or risk money that you cannot afford to lose. Online trading is not suitable for all investors. View the document titled Characteristics and Risks of Standardized Options at www.TradeStation.com . Before trading any asset class, customers must read the relevant risk disclosure statements on www.TradeStation.com . System access and trade placement and execution may be delayed or fail due to market volatility and volume, quote delays, system and software errors, Internet traffic, outages and other factors.
Securities and futures trading is offered to self-directed customers by TradeStation Securities, Inc., a broker-dealer registered with the Securities and Exchange Commission and a futures commission merchant licensed with the Commodity Futures Trading Commission). TradeStation Securities is a member of the Financial Industry Regulatory Authority, the National Futures Association, and a number of exchanges.
Options trading is not suitable for all investors. Your TradeStation Securities’ account application to trade options will be considered and approved or disapproved based on all relevant factors, including your trading experience. See www.TradeStation.com . Visit www.TradeStation.com for full details on the costs and fees associated with options.
Margin trading involves risks, and it is important that you fully understand those risks before trading on margin. The Margin Disclosure Statement outlines many of those risks, including that you can lose more funds than you deposit in your margin account; your brokerage firm can force the sale of securities in your account; your brokerage firm can sell your securities without contacting you; and you are not entitled to an extension of time on a margin call. Review the Margin Disclosure Statement at www.TradeStation.com .
TradeStation Securities, Inc. and TradeStation Technologies, Inc. are each wholly owned subsidiaries of TradeStation Group, Inc., both operating, and providing products and services, under the TradeStation brand and trademark. When applying for, or purchasing, accounts, subscriptions, products and services, it is important that you know which company you will be dealing with. Visit www.TradeStation.com for further important information explaining what this means.
