#AN026: Trump, the US as a Bitcoin Superpower
In a recent speech in Miami, Donald Trump declared a radical shift in his vision for cryptocurrencies, with a strong and clear message: the United States must become the "Bitcoin Superpower" and the cryptocurrency capital of the world. Hello, I'm Andrea Russo, an independent forex trader and prop trader with $200,000 in capital under management, and I thank you in advance for your time.
This statement comes after years of political uncertainty and critical federal regulations targeting the crypto sector. Now, under Trump's leadership, the narrative seems set to change, with an embrace of the potential of Bitcoin and other cryptocurrencies.
In his speech, Trump made a bold statement: "Crypto was under siege, but with my administration, things change." The former president emphasized that global competition, particularly from China, could threaten the United States' dominant position in the cryptocurrency world. In response, he proposed a vision in which the United States not only regains control but also establishes itself as a global leader in Bitcoin.
Trump suggested that a robust crypto infrastructure could be key to maintaining the dollar's supremacy, now considered the most important global medium of exchange. "If we don't act, China will take over," he warned, referring to the Asian nation's growing influence in the blockchain and cryptocurrency sectors.
Trump's words could mark a turning point in the relationship between government and cryptocurrencies. If these statements translate into favorable policies, the United States could further strengthen its position in the crypto industry, incentivizing the adoption of blockchain-based technologies and creating a clearer regulatory environment for cryptocurrencies.
However, as with any policy statement, uncertainty remains. Trump has not provided concrete details on how he intends to achieve these goals or what type of legislation might be introduced. For investors, this means that market expectations may fluctuate, while concrete developments may be slow in coming.
Trump's vision of America as a crypto superpower could represent a new phase in the evolution of cryptocurrencies, particularly for Bitcoin, which is often at the center of global debates. However, the path to realizing this vision is unclear and could depend on various economic and political factors. Investors and traders should remain vigilant, monitoring future policy moves, which could significantly impact cryptocurrency volatility and adoption in the United States.
In conclusion, while Trump's sentiment may be positive for the crypto market in the short term, the real challenge will be the ability to translate words into concrete actions, creating an environment that fosters innovation and expansion in the crypto sector.
Community ideas

The system is engineered for you to lose!Hey @TradingView Community
I want to be real with you.
Most traders don’t lose because they are bad at trading.
They lose because the whole system is built to make them lose.
Your broker wants you to believe they are helping you.
But in reality, they make money when you lose money (The B-Book Module).
Yes of course not all the brokers, but the majority.
It’s like a casino. The house always wins.
They want you to take big risks.
They want you to use crazy leverage so they can collect faster when your trade goes wrong.
And when it does, you blame yourself instead of the system.
You keep trying harder, but the game is not made for you to win.
Here is what I want you to know:
You don’t need to trade more.
You don’t need to chase every candle.
You need a system that is built to protect you, not your broker.
So in short, you have to have a proven trading system in place and a trading plan to follow every single time you take a trade.
That is what we created, a clear trading system that helps you focus on a few strong trades every week.
No guessing, no stress, no gambling.
And don't forget WTW 4 Golden rules!
1) Do not jump in
2) Do not over risk/trade
3) Do not trade without Stop Loss
4) Never ever add to a losing position!
Take with care,
Alain M(Coach)
WTW Team
FX:XAUUSD NYSE:DOW NASDAQ:NDX SP:SPX

A Tutorial on LIQUIDITY and EFFICIENCYLike I've mentioned in the past, these are the 2 core concepts of how the market moves. When you begin to understand them, you start to understand where price HAS to go. That may sound arrogant, but I am last the person to say anything about the market with certainty unless I am actually certain. It is akin to understanding why and how the sun comes up in the morning and goes down at night. Because you understand the science behind it, you are able to say with certainty where and when it will happen. (Unless you believe some flat earther stuff like the sun is a hot air balloon ride away...
So, I hope you find this video educational. Remember, successful trading is about consistency, discipline, and hard work. It is about making profit and minimizing risk. It isn't about winning or losing, or being right or wrong.
Take care,
- R2F Trading

How to use BTC Coinbase premium index indicator on tradingview1. What is the Coinbase Premium Index?
The Coinbase Premium Index is a metric that measures the price difference between a specific cryptocurrency listed on Coinbase and the price of Bitcoin on other major exchanges (especially Binance).
⌨︎ Calculation method:
(Coinbase BTC price - Other exchange BTC price) / Other exchange BTC price * 100
Positive premium: Occurs when the Coinbase price is higher than on other exchanges.
Negative premium: Occurs when the Coinbase price is lower than on other exchanges.
📌 If this content was helpful, please show your support with a boost and comments. Your encouragement is a great motivator for creating better analysis and content.
We will continue to upload various content such as chart analysis, trading strategies, and Bitcoin short-term signals, so please follow us.
2. Causes of Coinbase Premium
✔️ The main causes of Coinbase Premium are as follows:
Institutional investor demand: Coinbase is one of the largest regulated cryptocurrency exchanges in the U.S., and many institutional investors (hedge funds, asset management firms, etc.) purchase cryptocurrencies through Coinbase.
Large-scale buy orders from institutional investors can temporarily drive up prices on Coinbase, creating a premium.
Fiat currency inflow: Coinbase primarily facilitates USD-based transactions and is the most accessible platform for U.S. investors.
When new fiat currency flows into the cryptocurrency market, a strong inflow through Coinbase can lead to a premium.
Market sentiment and liquidity: If U.S. market investor sentiment is stronger than in other regions at certain times, or if liquidity on Coinbase is temporarily low, a price difference may occur.
Restrictions on fund movement: Due to anti-money laundering (AML) regulations, there may be time and cost restrictions on fund transfers between exchanges.
This limits arbitrage opportunities and helps maintain the premium.
Network congestion and fees: During cryptocurrency network congestion, transaction speeds may slow down or fees may increase, making rapid arbitrage between exchanges difficult.
3. How to Use the Coinbase Premium Index in Trading
The Coinbase Premium Index can primarily be used to predict market trends for major cryptocurrencies like Bitcoin (BTC).
📈 Bull market signal (positive premium):
Institutional buying inflow: A consistently high positive premium may indicate sustained buying pressure from institutional investors.
This can be interpreted as a signal of an overall market uptrend.
Trend reversal: If a negative premium persists in a bear market and then suddenly turns positive or its magnitude increases, it can be seen as a signal that a trend reversal is imminent, along with the inflow of institutional investors and improved market sentiment.
Bottom buying opportunity: If the Bitcoin price is falling and the Coinbase premium starts to rise above 0%, and at the same time, the daily net inflow into ETFs like BlackRock iShares Bitcoin Trust (IBIT) or Fidelity Wise Origin Bitcoin Trust (FBTC) significantly increases, this could signal a strong buying opportunity at the bottom.
📉 Bear market signal (negative premium):
Institutional selling pressure or decreased interest: A consistently low negative premium may indicate high selling pressure from institutional investors or decreasing interest in Bitcoin.
This can be interpreted as a signal of a market downtrend.
Bearish reversal signal: If a positive premium persists in a bull market and then turns negative or its magnitude sharply increases, it could be a top signal, indicating that institutional investors are taking profits or new buying inflows are decreasing.
Overbought/Correction signal: For example, if the Bitcoin price is soaring and the Coinbase premium turns negative, and at the same time, large net outflows are observed from ETFs such as BlackRock IBIT or Fidelity FBTC, it can be judged that the market is overbought or there is a possibility of correction, and a sell position can be considered.
4. Points to Note
🚨 When using the Coinbase Premium Index, pay attention to the following:
Combination with other indicators: The Coinbase Premium Index is just one auxiliary indicator.
A comprehensive judgment should be made by analyzing other technical analysis indicators such as moving averages, RSI, MACD, trading volume, as well as on-chain data and macroeconomic indicators.
Importance of ETF inflow/outflow data: Bitcoin spot ETFs from major asset managers such as BlackRock and Fidelity are one of the most direct indicators of actual institutional investor fund flows.
Analyzing these ETF's daily net inflow/outflow data along with the Coinbase premium can provide a more accurate understanding of institutional buying/selling pressure in the market.
Short-term volatility: The premium can fluctuate rapidly due to subtle changes in the market in the short term.
It is important to observe long-term trends rather than reacting too sensitively to temporary premium changes over a short period.
Changes in market conditions: The cryptocurrency market changes very rapidly.
There is no guarantee that patterns that were valid in the past will necessarily be valid in the future.
Various factors such as regulatory environments, policy changes of major exchanges, and the emergence of new market participants can affect the premium.
Limited scope of application: The Coinbase Premium Index tends to reflect the demand of institutional investors, mainly for Bitcoin. Its influence may be limited for altcoins.
5. Using the Coinbase Premium Index in TradingView
TradingView is a popular platform that provides various technical indicators and chart analysis tools. On TradingView, there are many custom indicators that can monitor the Coinbase Premium Index in real time.
These indicators usually calculate the price difference between Coinbase and Binance spot assets (e.g., BTCUSD/BTCUSDT) and display it in a separate panel at the bottom of the chart.
📊 TradingView indicator usage tips:
Search for indicators: Click the 'Indicators' button on the TradingView chart and type keywords such as 'Coinbase premium' or 'Coinbase vs Binance' in the search bar to find relevant indicators.
Real-time monitoring: These indicators retrieve real-time Bitcoin spot price data from Coinbase and Binance, calculate the premium, and visually display it on the chart. This allows investors to instantly confirm market price differences and incorporate them into their trading strategies.
Combination with other indicators: A powerful advantage of TradingView is that multiple indicators can be overlaid on one chart.
You can add the Coinbase Premium Index indicator along with the Bitcoin price chart, and if necessary, refer to BlackRock and Fidelity ETF inflow/outflow data separately to attempt multi-faceted analysis.
Alert settings: Use TradingView's alert function to set alerts when the Coinbase premium exceeds a certain level or enters/exits a certain range.
This helps to grasp market changes in real time and respond accordingly.
In conclusion, the Coinbase Premium Index is an indicator that can offer insight into the movements of institutional investors in the U.S. market, one of the major players in the cryptocurrency space.
When combined with Bitcoin spot ETF inflow/outflow data from major asset management firms such as BlackRock and Fidelity, it can significantly help to more clearly understand the actual flow of institutional funds and to judge market strength and the possibility of trend reversals.
However, rather than blindly trusting it, it is wise to use it as a supplementary tool to enhance a comprehensive understanding of the market by utilizing it with other analysis tools.

YOUR JOB IS TO FIND CONFLUENCE - Here is how I do it.....All the information you need to find a high probability trade are in front of you on the charts so build your trading decisions on 'the facts' of the chart NOT what you think or what you want to happen or even what you heard will happen. If you have enough facts telling you to trade in a certain direction and therefore enough confluence to take a trade, then this is how you will gain consistency in you trading and build confidence. Check out my trade idea!!
www.tradingview.com

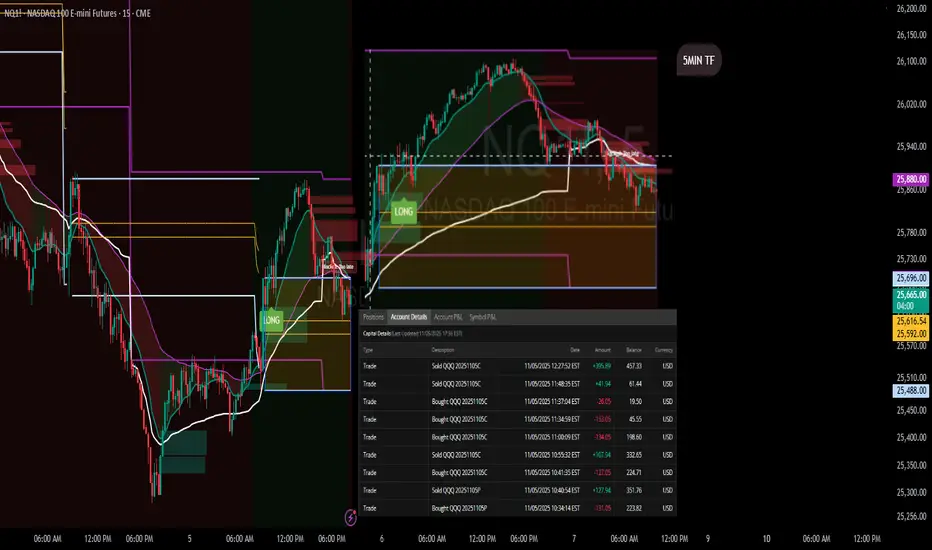
ORB Pro Signal Recap – Nov 5, 2025 | “Respect the Levels”Ticker: QQQ / NQ1! (5-min + 15-min TF)
Strategy: ORB Pro + Trendline Breakdown + Previous Day High Rejection
Focus: Signal confirmation & reaction zones
🧭 Market Context
The morning started strong, with buyers pushing off the open toward the previous day’s high (PDH) and ORB extension zone.
As price tapped the upper band, the ORB Pro system generated a clean long confirmation, aligned with the higher timeframe momentum.
But the rally quickly stalled at the PDH — a textbook reaction zone where the structure shifted.
From there, trendline breakdowns on both 5-min and 15-min charts confirmed exhaustion, and the system correctly prevented new long entries once momentum failed.
💹 Trade Breakdown
Initial Long: Taken on ORB Pro signal confirmation near the intraday retest (strong follow-through into PDH).
Profit-Take Zone: Price rejected sharply at the PDH and VWAP cluster — partials locked.
No Chasing: After the rejection, ORB Pro flagged “Blocked / Too Late,” keeping risk managed while trend flattened.
Result: Finished the day green with multiple small wins across calls — +$89.68 net on the $623C and +$15.89 on $626C.
📊 Performance Summary
Symbol Side Contracts Net Result
QQQ $623C Long 2 +$89.68
QQQ $626C Long 1 +$15.89
QQQ $622P Short hedge 1 –$3.11
Total P/L + $102.46 (Realized)
📈 Chart Recap
Price pushed through the early range with momentum but stopped exactly at the previous day’s ORB high and Fib confluence.
That rejection aligned perfectly with the HTF resistance zone on both 5-min and 15-min TFs.
The chart shows two green “LONG” entries and a clean signal fade once volume dropped —
a prime example of respecting structure over bias.
💡 Key Takeaways
PDH = Reaction Zone: Don’t ignore prior highs — they mark algorithmic defense zones.
Trust the Filters: ORB Pro prevented chasing the failed continuation after PDH rejection.
Structure First: The trendline breakdown confirmed what price was already telling us.
🧘♂️ Reflection
“The system signaled the move early, and I followed structure. PDH rejection confirmed the top, and discipline locked the profit. The goal wasn’t to predict — it was to react with control.”
Copy Trading Made Me 60% Profit… Then Destroyed EverythingHave you ever heard about copy trading — that magic button promising you can earn profits just by following someone else’s trades?
I’d heard it a hundred times, but I was skeptical. Still, I decided to test it myself — because if it really worked, it would mean there’s a shortcut to success in trading, right?
My Real Experience in the Crypto Copy Trading World
At first, I started small — just a test with a tiny amount of money.
After one week, I couldn’t believe what I saw: +60% profit.
That’s the kind of return some professional traders don’t make in an entire year.
So I added more capital. And again — more profit.
It was so consistent that for a short moment, I started thinking:
“Maybe I don’t need to trade manually anymore… maybe this is it.”
Until one random day, everything changed.
Within hours, 60% of the total capital vanished.
Not only the profits — but the entire account took a massive hit.
Why Copy Trading Fails (Even When It Works for a While)
After this happened, I started studying how professional traders approached this topic — including Ross Cameron’s own test of multiple copy-trade alert services.
The conclusion was almost identical to my experience.
1. You’re Always Late
By the time you receive the alert or your account copies the trade, the entry price has already changed. If the trade goes up, your profit is smaller. If it goes down, your loss is bigger. Latency kills consistency.
2. You Have No Control
You can’t decide the risk per trade, the stop-loss, or the position size. Someone else does — and that means you’re exposed to risks you didn’t choose.
3. Liquidity and Spread Issues
In crypto, when someone opens a large position on a low-cap coin with thin order books, the copy trades that follow open at much worse prices — higher if it’s a buy, lower if it’s a sell. In other words, their exit point becomes your entry point.
4. False Confidence and Dependence
Even if the system makes money for a while, it teaches you nothing. You’re not becoming a better trader — you’re just outsourcing your decisions. And when it stops working, you have no skills to fall back on.
5. High-Risk Behavior of “Top” Traders
Many of the accounts behind copy systems take massive risks and show extremely poor Sharpe ratios. They might look profitable short-term, but their equity curves often end the same way — a crash.
Lessons Learned
Copy trading gives you the illusion of control — the dream that someone else can do the hard work for you.
But the truth is, you’re not participating in trading — you’re observing someone else’s gamble.
The only sustainable way forward is independence:
Learn the strategy
Practice on a simulator
Understand risk
Build your own discipline
That’s how you trade with confidence — not by copying trades, but by owning your decisions.
Educational Video pt. 2 Found a couple trades and gave some good reasoning on why I would take them ..... 'like' this video

Educational video. Hit the 'LIKE' button if this helped you.This is my thought process on how to trade. If you would like me to post more recorded videos like this.. or even when I am in a trade , please feel free to 'COMMENT' below this video. This is my logic on the market and this is why my name is NASDAQNYK. You dont need 20 indicators on your charts, you dont need anything but your eyes and 3 confluences to determine your typical entry and exit. Trading is only hard when you make it hard.

How to Trade with MACD in TradingViewMaster the MACD indicator using TradingView’s charting tools in this comprehensive tutorial from Optimus Futures.
The Moving Average Convergence Divergence (MACD) is a momentum and trend-following indicator that helps traders identify shifts in market direction and momentum strength. It measures the relationship between two exponential moving averages (EMAs) to reveal when momentum may be building or fading.
What You’ll Learn:
Understanding MACD as a tool that tracks the convergence and divergence of moving averages
How the MACD line is calculated as the difference between the 12-period and 26-period EMAs
How the Signal line acts as a 9-period EMA of the MACD line and serves as a trigger for potential buy or sell signals
How the Histogram visualizes the distance between the MACD line and Signal line to show momentum strength
Recognizing bullish and bearish crossovers between the MACD and Signal lines
How to interpret the Zero Line as a momentum baseline — above zero suggests an uptrend, below zero suggests a downtrend
Identifying bullish and bearish divergences between MACD and price to anticipate potential reversals
Why crossovers and divergences should be confirmed with price action and trend structure, not used in isolation
How to add MACD to a TradingView chart via the Indicators menu
Understanding the default settings (12, 26, 9) and how adjusting them changes responsiveness
Practical examples on the E-mini S&P 500 futures chart to illustrate MACD signals in real market conditions
Applying MACD across multiple timeframes — daily, weekly, or intraday — for higher-confidence confirmations
This tutorial will benefit futures traders, swing traders, and technical analysts who want to incorporate MACD into their trading process.
The concepts covered may help you identify trend changes, momentum shifts, and potential entry or exit points across different markets and timeframes.
Learn more about futures trading with TradingView:
optimusfutures.com
Disclaimer
There is a substantial risk of loss in futures trading. Past performance is not indicative of future results. Please trade only with risk capital. We are not responsible for any third-party links, comments, or content shared on TradingView. Any opinions, links, or messages posted by users on TradingView do not represent our views or recommendations. Please exercise your own judgment and due diligence when engaging with any external content or user commentary.
This video represents the opinion of Optimus Futures and is intended for educational purposes only.
Chart interpretations are presented solely to illustrate objective technical concepts and should not be viewed as predictive of future market behavior. In our opinion, charts are analytical tools — not forecasting instruments.

You Don’t Need 100 Coins – You Need 1 Plan!b]Hello Traders!
In crypto, most traders believe the key to success is owning every new coin that launches.
They fill their portfolio with 50, 80, even 100 different tokens, hoping one of them will explode and make them rich.
But here’s the truth: you don’t need 100 coins, you just need 1 clear plan.
Because in trading and investing, confusion kills returns, and clarity creates wealth.
1. The Illusion of Diversification
Having too many coins doesn’t make you diversified, it makes you distracted.
True diversification means spreading across uncorrelated assets, not buying every token that trends on Twitter.
Most altcoins move with Bitcoin anyway, so holding 50 of them doesn’t protect you when the market drops.
Owning too much is often a sign of uncertainty, not strategy.
2. The Power of Focus
The most successful investors study deeply, not widely.
They pick a few strong assets, understand their fundamentals, and hold through noise.
You make money by conviction, not collection.
Warren Buffett once said:
“Diversification is protection against ignorance.”
In crypto, it’s often protection against not doing your homework.
3. Why You Need a Plan, Not Picks
A trading plan defines when to buy, when to sell, and how much to risk.
It removes emotion, because you already know what to do when volatility hits.
Without a plan, even 100 coins can’t save you from panic or greed.
With a plan, even one good asset can make you financially free.
The market doesn’t reward how many coins you own, it rewards how you manage them.
4. What a Simple Crypto Plan Looks Like
Step 1: Choose 3–5 coins with real use case, strong community, and consistent development.
Step 2: Define your investment horizon, 1 year, 3 years, or 5 years.
Step 3: Allocate capital based on conviction, not hype.
Step 4: Use SIP or DCA to build positions over time.
Step 5: Rebalance every 6 months to maintain focus and risk control.
That’s it, simple, structured, and powerful.
Rahul’s Tip:
If you ever feel overwhelmed by too many coins, step back and simplify.
The more complicated your portfolio looks, the more uncertain your thinking is.
Remember, wealth doesn’t come from chasing everything. It comes from mastering something.
Conclusion:
The biggest trap in crypto is believing more coins mean more chances.
But true success belongs to those who build systems, not collections.
You don’t need 100 coins, you just need 1 plan that you actually follow.
If this post helped you rethink your strategy, like it, share your thoughts in comments, and follow for more clear and practical crypto insights!

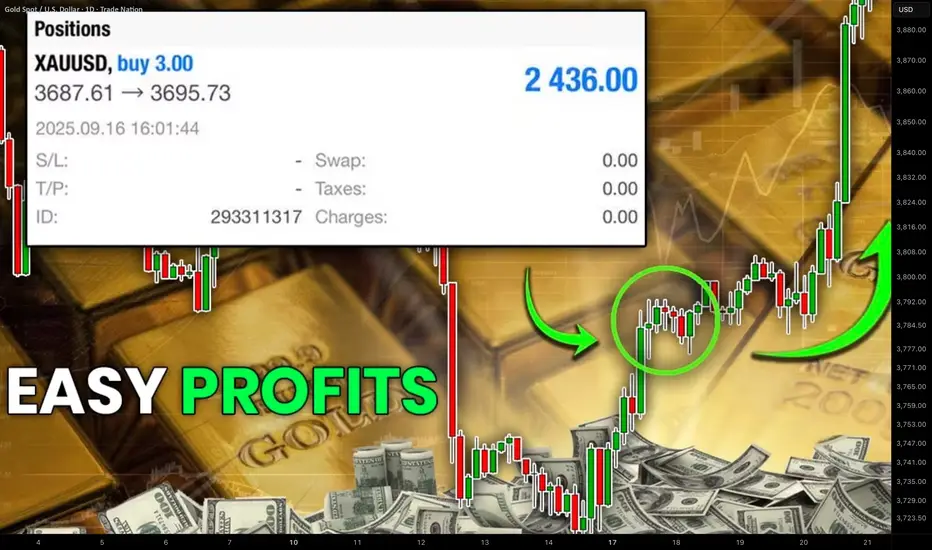
Profitable Gold XAUUSD Indicator Trading Strategy Explained
To profitably trade a massive bullish rally on Gold , you don't need a complicated system.
In this article, I will teach you an easy indicator strategy for trend-following trading XAUUSD.
It is based on 2 default technical indicators that are available on any trading platform: Mt4, Mt5, TradingView, etc.
You will get a complete trading plan:
exact entry signal,
smart stop loss placement,
trade management rules.
The first indicator that you will need to trade this strategy is Moving Average.
We will use a combination of 2 Moving Averages: Exponential Moving Average EMA with 20 length and a Simple Moving Average SMA with 9 length.
Our entry signal will be a crossover of 2 MA's on a 4H time frame.
SMA and EMA should meet first.
SMA should break through EMA to the upside to confirm a bullish signal.
With a high probability, Gold price will rise significantly then.
The main nuance of this strategy is to wait for a confirmed crossover and avoid the traps.
Patiently wait for a touch of 2 moving averages first.
After that, you will need to wait for a close of one more 4H candle to make sure that SMA stays above EMA.
You can see that though 2 Moving Averages met, SMA failed to break through EMA.
That is how a valid buy signal looks: SMA stays above EMA after a close of the next 4H candle.
After you identified a valid crossover, it is your signal to open BUY trade on Gold .
Your entry should be exactly after a close of a 4H candle.
Stop loss will be based on another popular free indicator - Average True Range ATR with default 14 length settings.
Your safe stop loss should be 2 ATR from the entry.
In our example, ATR is 145 pips.
2 ATR will be 190 pips.
That will be our stop loss.
With this trading strategy, we will not use a fixed Take Profit TP and use trailing stop loss instead.
It will help us to catch extended bullish waves on Gold.
Once the market starts rising, updating the highs, trail your stop loss based on EMA and keep it 1 ATR below that.
Make sure that you move your stop loss only when EMA and Gold price are rising . Once Gold price or EMA start moving in sideways or go down, do not lower your stop loss.
Using this strategy consistently, you will be able to catch significant bullish waves.
In Autumn trading season of 2025, this strategy provided, 3100+ pips entry signal.
What I like about this strategy is that being very simple, you can easily backtest that and measure its objective trading performance.
Easy entry, confirmation, and trade management rules make this strategy appropriate for beginners in Gold trading and will help to not miss a current extraordinary trend.
❤️Please, support my work with like, thank you!❤️
I am part of Trade Nation's Influencer program and receive a monthly fee for using their TradingView charts in my analysis.
Enhancing citizen experience using chatGPT in the Tokyo metropolIn 2023 the Tokyo metropolitan government (TMG) embanked on a series of pilots looking at using chatGPT for text creation idea generations and other clerical work significantly the (TMG) ALSO release four foundation guidelines to aid staff in their approach to using genAI.with thanks to apolitical a sosial learning network for government,for writing up these finding we know the principles were
DON'T input confidential information
don't genarate that infringes copyright
always verify and validate response given by AI independtly
if you directly use response genarated by AI indicate response were created using AI
AI in Trading: Hype, Hope, and Hard Truths# TradingView Post: AI in Trading (TradingView Formatting)
"I just made a ChatGPT trading bot that's up 300% in backtests!"
I see this exact post at least 5 times a week. And every time, I know exactly how it ends—blown account, confused trader, and another person convinced that "AI doesn't work in trading."
Here's the uncomfortable truth: AI absolutely works in trading. Just not the way most people think.
The problem isn't the technology—it's that everyone's obsessed with the sexiest part (predicting the next candle) while ignoring the parts that actually make money.
After building dozens of systematic strategies for clients across crypto, forex, and equities, I've learned this: the hard part of trading isn't generating signals. It's managing risk, optimizing execution, and knowing when your edge has disappeared.
Let me show you where AI actually creates alpha—and why your "predictive model" probably won't.
━━━━━━━━━━━━━━━━━━━━━━
The Real Problem With AI Signal Generation
Before we get to what works, let's talk about why most AI trading bots fail:
The Data Problem:
Markets are non-stationary (the game changes constantly)
You need 10,000+ samples for reliable ML models
But market regimes shift every 200-500 bars
You're essentially training on data from a different game
The Overfitting Trap:
Your LSTM "learned" patterns that existed once and may never repeat
95% backtest accuracy? That's usually a red flag, not a green light
Walk-forward testing reveals most models have zero predictive power out-of-sample
The Competition Reality:
Renaissance Technologies has PhDs, decades of data, and billions in infrastructure
Your GPU and 2 years of OHLCV data isn't competing with that
By the time a pattern is obvious enough for simple ML to find, it's arbitraged away
Can pure signal generation work? Yes—but it's the hardest application of AI in trading, not the easiest.
━━━━━━━━━━━━━━━━━━━━━━
Where AI Actually Adds Value (The Unsexy Truth)
Here's what nobody tells you: institutional quant funds use AI heavily, just not for predicting price direction. They use it for the operational advantages that compound over thousands of trades.
1. Position Sizing & Risk Management
Traditional fixed-percentage position sizing (risk 2% per trade) ignores market reality. Sometimes 2% is too aggressive, sometimes it's leaving money on the table.
I've tested reinforcement learning models that dynamically adjust position sizes based on:
Current market volatility regime (VIX, ATR percentiles)
Correlation breakdown between portfolio assets
Recent strategy performance and drawdown depth
Portfolio heat distribution across sectors
Real result from a client system: 23% reduction in maximum drawdown vs. fixed sizing, with nearly identical total returns. The AI wasn't predicting price—it was predicting when the edge was strongest and sizing accordingly.
2. Execution Optimization
This is where prop shops and hedge funds actually deploy ML. Not for signals—for getting better fills.
What ML handles:
Predicting optimal order slicing (VWAP vs. TWAP vs. aggressive IOC)
Detecting liquidity windows in crypto markets (when to place limit orders vs. market orders)
Minimizing slippage on larger positions
Predicting short-term volatility spikes that would hurt execution
Practical example: A simple gradient boosting model analyzing order book depth, bid-ask spread, and recent volume patterns can save 5-15 basis points per trade. On a $100K position, that's $50-150 saved per execution. Over 1,000 trades per year? That's $50K-150K in improved performance.
3. Regime Detection & Strategy Allocation
Stop trying to predict the next candle. Instead, predict the type of market environment you're in.
Use unsupervised learning (K-means clustering, Hidden Markov Models, Gaussian Mixture Models) to identify:
High volatility vs. low volatility regimes
Trending vs. mean-reverting environments
Risk-on vs. risk-off sentiment periods
Correlation expansion/contraction across assets
Why this matters: A moving average crossover that prints money in trending markets will destroy your account in choppy, range-bound conditions. A mean reversion strategy that works beautifully in low volatility will get steamrolled during breakouts.
Implementation: Train an ensemble model on market features (volatility, correlation, volume patterns, momentum indicators). When it detects Regime A, allocate to Strategy Set 1. When it detects Regime B, switch to Strategy Set 2. When confidence is low, reduce exposure across the board.
4. Feature Engineering & Dynamic Signal Weighting
You have 50 technical indicators on your chart. Which ones actually matter right now ?
This changes constantly:
RSI works until the market trends hard, then it's a disaster
Volume patterns matter way more in crypto than traditional equities
Correlation indicators are useless until suddenly they're everything (crisis periods)
Different lookback periods perform differently across volatility regimes
ML solution: Use ensemble methods (Random Forests, XGBoost) to dynamically weight and combine signals based on recent regime and performance.
Instead of: "Buy when RSI < 30"
You get: "Buy when the ensemble model says momentum + volume + volatility features align, weighted by recent regime performance"
Client example: Combined 12 traditional strategies (each with proven edge) with an ML meta-strategy that allocated capital between them. The ML didn't find new edges—it figured out which existing edges to use when. Result: Sharpe ratio improved from 1.1 to 1.7 over 3 years live.
━━━━━━━━━━━━━━━━━━━━━━
The Hybrid Approach That Actually Works
After building systems that survive real markets (not just backtests), here's the architecture that works:
Layer 1 - Core Signals (Traditional Quant):
Mean reversion strategies based on statistical patterns
Momentum breakout systems with volume confirmation
Arbitrage opportunities and structural edges
These are your "alpha generators" with proven statistical edge
Layer 2 - AI Risk Management:
Reinforcement learning for dynamic position sizing
ML models for stop-loss placement and profit-taking
Volatility prediction for exposure adjustment
Layer 3 - AI Strategy Allocation:
Regime detection to switch between strategy sets
Performance-based weighting of different approaches
Correlation analysis for portfolio construction
Layer 4 - AI Execution:
Order optimization based on current liquidity
Slippage prediction and mitigation
Timing of trade execution within the day
Real system I deployed for a crypto client:
Core: 8 different mean reversion + momentum strategies (all traditionally backtested)
AI Layer: Reinforcement learning for position sizing based on volatility regime
ML Layer: Random forest classifier for regime detection (trending vs. ranging vs. high volatility)
Execution: Gradient boosting model for order placement timing
Result: Sharpe ratio improved from 1.2 to 1.8 over 3 years of live trading, max drawdown reduced by 31%
The AI didn't find magic price prediction patterns. It made better decisions about when to trade , how much to risk , and how to execute .
━━━━━━━━━━━━━━━━━━━━━━
What You Should Actually Build
If you're serious about AI in trading, here's my recommendation:
Start here (High ROI, Lower Difficulty):
Build a regime detection system first
Create position sizing rules that adapt to volatility
Optimize your execution (especially in crypto)
Test strategy allocation across different market conditions
Only then consider (High Difficulty, Questionable ROI):
Pure price prediction models
Red flags to avoid:
Any model with >90% backtest accuracy (probably overfit)
Systems that don't account for transaction costs and slippage
Strategies that haven't been walk-forward tested
Anything that can't explain why it should work
━━━━━━━━━━━━━━━━━━━━━━
The Bottom Line
If someone's selling you an AI system that "predicts market direction with 95% accuracy," run away. That's either overfitted garbage or a scam.
If someone's using AI to dynamically manage risk, optimize execution, detect regime changes, and intelligently allocate between proven strategies? That's actually how professionals use it.
The unsexy truth: The best use of AI in trading isn't prediction—it's decision-making around the edges that already exist.
Stop chasing the signal generation hype. Start thinking about the full trading pipeline. That's where the real alpha is hiding.
━━━━━━━━━━━━━━━━━━━━━━
💬 Question for the community: Are you using AI for signal generation or operational optimization? What's been your experience?
🔔 Follow for more quant reality checks—no hype, just data and systems that work in production
📩 Building systematic strategies that need to survive real markets? I specialize in risk-aware ML systems, hybrid quant approaches, and turning backtests into production-ready code. DM me to discuss your project.
━━━━━━━━━━━━━━━━━━━━━━

Intermarket Spread Trading (Part One)This tutorial goes over I use data to pick FX markets. In futures videos we will put markets together and begin spread trading them and harvesting commissions. To balance losses, we will enter into a long trade in the efficient market to offset the losses created in the inefficient market.
This video is just a brief intro into what I do to maintain a steady trading income. Currently, we are testing the results of this sort of trading because it's sensitive to broker spreads.
However, the brokers I have are more than brokers, they are my friends and we relate on wanting the best trading outcomes before increasing risk.
If you have any questions reach out!

The Double Bottom Trap That Traders Might Miss1. The Comfort Zone of Classic Patterns
Few formations attract traders’ attention like a double bottom. It’s one of those timeless chart patterns that promise hope after a long decline—a visual story of selling exhaustion followed by a bullish reversal.
But markets rarely reward what’s obvious. In futures trading, especially when examining instruments like Bitcoin Futures (BTC) and Micro Bitcoin Futures (MBT), patterns are only half the story. What truly moves price isn’t just the shape on the chart—it’s the order flow behind it.
That’s where understanding FO (Filled Orders) and UFO (UnFilled Orders) becomes essential. Both represent past and potential liquidity imbalances, and reading their relationship can transform how traders interpret “classic” setups.
2. The Bitcoin Setup: A Tale of Two Bottoms
The current BTC daily chart paints what seems like a textbook double bottom. Two price troughs form near the same horizontal area around $104,000, setting up the typical “W” shape many traders see as a bullish reversal pattern.
However, when we dig deeper into the order flow structure, the illusion begins to fade.
A FO Support level exists near $103,860, meaning that this area previously attracted enough buyers to halt a decline—but those orders have already been filled and we know this given the fact that price turned at that price level before.
The next UFO Support zone sits much lower, around $95,640. That’s where unfilled buy orders are expected to remain waiting, untouched.
This distinction matters. While FO zones mark previous turning points, UFO zones highlight potential turning points that still contain resting liquidity. In simple terms, FO areas represent “used energy,” while UFO areas represent “stored energy.”
3. FO vs. UFO – The Order Flow Reality Check
Let’s define these two concepts with precision:
FO (Filled Orders): Price zones where significant buying or selling already occurred. These levels once reversed price, but because those orders were executed, fewer remain to defend the level again.
UFO (UnFilled Orders): Price zones containing pending buy or sell orders not yet triggered. They represent areas of fresh imbalance and therefore carry a higher probability of influencing future price moves.
In our Bitcoin case, the FO Support around $103,860 has done its job already—it stopped price before. But now, the unfilled buying interest lies lower, implying that the market may need to travel down to reach fresh demand at $95,640.
On the other side, UFO Resistance hovers near $112,410, enveloping the top of the double bottom structure. Should the price rebound toward that level, sellers waiting there could re-enter the scene, potentially capping any bullish recovery.
The conclusion? This pattern isn’t as bullish as it looks.
4. When Bullish Shapes Hide Bearish Probabilities
Most traders spot the double bottom and immediately think “trend reversal.” Yet, the distance between FO and UFO levels tells a more subtle story.
Since FO Support levels carry reduced strength after being tested, they’re more likely to break than hold. In this context, the probability favors a downside continuation rather than an immediate bounce.
If price breaches $103,860, the next probable destination becomes the UFO Support at $95,640. Only then, after reaching that pocket of unfilled demand, might a significant rebound have higher odds.
It’s a reminder that technical patterns, while valuable, must always be filtered through liquidity context. A pattern without order flow validation is like reading the market’s outline without its story.
5. Quantitative Insight: A Probabilistic Lens
Think of this in probabilistic terms:
When FO zones sit above UFO zones, the market often continues toward the unfilled liquidity.
When UFO zones lie closer to current price, reversals occur faster because demand (or supply) is still waiting to be executed.
In our example, BTC shows a larger gap between FO and UFO support levels, signaling lower immediate reversal odds. The chart may appear bullish, but the underlying order flow distribution points to weakness first, strength later.
This is not a prediction—it’s an observation of potential. It allows traders to structure their expectations based on where fresh participation is more likely to emerge.
6. Risk Management: Navigating the Trap
For traders considering setups around this structure, risk management is crucial.
Entry awareness: Avoid entering long positions purely because a double bottom “looks bullish.” Consider waiting for evidence of unfilled demand being triggered (confirmation at or near UFO Support).
Stop-loss placement: Stops below FO Support can easily be hunted in liquidity sweeps; better to align risk control with genuine unfilled demand areas.
Reward-to-risk thinking: A test of the UFO Support near $95,640 could later offer a more favorable upside-to-downside ratio than buying prematurely at $104,000.
Remember, pattern-based entries without liquidity confirmation often carry poor asymmetry—small upside with large downside risk.
7. Futures Structure and Margin Awareness
Both BTC and MBT represent Bitcoin exposure via futures contracts, but their sizing differs dramatically.
BTC equals 5 Bitcoin per contract, making it suitable for larger, institutional players. (1 Tick = 5 = $25. Required Margin = $132,500)
MBT, the Micro Bitcoin Futures, equals 0.1 Bitcoin per contract, offering flexibility for smaller accounts and finer position scaling. (1 Tick = 5 = $0.50. Required Margin = $2,600)
Understanding margin requirements is essential—these products are leveraged instruments, and small price changes can result in large percentage gains or losses.
8. Key Takeaway: The Hidden Lesson
This entire setup illustrates a powerful educational point:
Chart patterns may draw the eye, but order flow tells the truth.
The double bottom may invite buyers, but the imbalance between FO and UFO zones exposes an underlying weakness. Traders who rely solely on visual patterns may walk straight into a trap. Those who align patterns with liquidity insights, however, read the market at a deeper level.
In the current context, BTC and MBT might need to visit lower support levels before finding true stability. Watching how price behaves around these unfilled order zones will reveal whether this double bottom turns into a lasting floor—or just another false start.
When charting futures, the data provided could be delayed. Traders working with the ticker symbols discussed in this idea may prefer to use CME Group real-time data plan on TradingView: www.tradingview.com - This consideration is particularly important for shorter-term traders, whereas it may be less critical for those focused on longer-term trading strategies.
General Disclaimer:
The trade ideas presented herein are solely for illustrative purposes forming a part of a case study intended to demonstrate key principles in risk management within the context of the specific market scenarios discussed. These ideas are not to be interpreted as investment recommendations or financial advice. They do not endorse or promote any specific trading strategies, financial products, or services. The information provided is based on data believed to be reliable; however, its accuracy or completeness cannot be guaranteed. Trading in financial markets involves risks, including the potential loss of principal. Each individual should conduct their own research and consult with professional financial advisors before making any investment decisions. The author or publisher of this content bears no responsibility for any actions taken based on the information provided or for any resultant financial or other losses.

Educational BTC Analysis: Decoding BTC's Wave (C) DownHello Friends, Welcome to RK_Chaarts.
Today we are going to understand Elliott Wave Teaching Points from the BTCUSD Daily Chart,
This chart sequence perfectly illustrates the difference between motive (impulse) and corrective waves, as well as the important structures and rules of a larger correction.
1. The Structure of a Corrective Pattern (A-B-C)The Big Picture: The overall movement, labeled Intermediate Wave (A), (B), and (C) (Blue), is a three-wave corrective pattern. This type of pattern moves against the trend of one larger degree (which have been an uptrend). The three-wave (A-B-C) structure is the classic way markets move in a counter-trend. Wave (A): The initial counter-trend move.Wave (B): A bounce or retracement that moves back in the direction of the previous trend, but fails to reach the start of Wave (A).Wave (C): The final, and often most powerful, leg of the correction, which is designed to complete the retracement. This wave is always structured as a five-wave impulse.
2. The Rule of Subdivisions: Corrective Waves are Internally Motive, Wave (C) is an Impulse: The report states that Intermediate Wave (C) is expected to unfold as a five-wave impulse sequence of a Minor Degree (Red) (Minor Wave 1, 2, 3, 4, 5).
Learning Point: This highlights a fundamental Elliott Wave rule: the C-wave of an A-B-C correction is a motive wave (it has a five-wave internal structure) because its purpose is to create strong directional progress and complete the larger correction. This is commonly known as a Zigzag correction (which has a 5-3-5 internal count for A-B-C).
3. Identifying the Strongest Move (Wave 3)
The Current Phase: The market is currently in Minor Wave 3 (Red) downwards.
Learning Point: In Elliott Wave theory, Wave 3 is typically the longest and never the shortest of the three motive waves (Waves 1, 3, and 5). This means the analysis anticipates the current move to be the most directional, high-momentum, and volatile part of the entire Intermediate Wave (C) correction. This is the "sweet spot" for trend traders.
4. The Principle of Alternation (Predicting Wave 4)
Upcoming Wave: The analysis projects a shallow Minor Wave 4 (Red) rebound.
Learning Point: While the chart doesn't show Wave 4 yet, this prediction is often guided by the Principle of Alternation. If the preceding corrective wave (Minor Wave 2) was a sharp, deep correction, the next corrective wave of the same degree (Minor Wave 4) is expected to be a sideways, shallow, or complex correction (like a flat or triangle). The prediction of a "shallow" wave 4 suggests Minor Wave 2 was likely a deeper, sharper retracement.
5. The Critical Invalidation Rule
The Invalidation Level: The report sets the critical invalidation price at 74,223, which represents the low or starting point of wave ((1)).
Learning Point: Wave ((2)) can never retrace more than 100% of Wave ((1)). By identifying a specific price level, we can assume that our study says price should not broke below that particular level, it provides traders with clear risk management parameters.
I. Current Wave Count Status
The analysis indicates that the previous upward corrective structure, designated as Intermediate Degree Wave (A) and Wave (B) (Blue), is complete. The market is now engaged in a significant downward movement within the larger Intermediate Degree Wave (C) (Blue).
This Intermediate Wave (C) is expected to unfold as a five-wave impulse sequence of a Minor Degree (Red) to the downside, fulfilling the final leg of the overall corrective cycle.
II. Detailed Downward Projection
The Minor Degree five-wave structure within Intermediate Wave (C) is currently positioned as follows:
Minor Wave 1 and Minor Wave 2 (Red): These waves are identified as complete.
Current Phase: The market is now unfolding Minor Wave 3 (Red) downwards, indicating the strongest portion of the bearish move is in progress.
Anticipated Completion: Following the completion of Minor Wave 3, the analysis projects a shallow Minor Wave 4 (Red) rebound, followed by the final impulse move, Minor Wave 5 (Red), to complete the entire Intermediate Wave (C) correction.
The ultimate completion of Intermediate Wave (C) will signal the end of the larger-degree correction (labeled as a corrective wave (2)).
III. Critical Invalidation Level
The integrity of this bearish wave count is contingent upon the price action respecting a critical support level.
Invalidation Price: 74,223
Significance: This price point represents the extreme low or starting point of wave ((1)), so Wave ((2)) correction Should not breach this level as per wave principles, if it makes lower low below 74,223 on the lower side, the current Elliott Wave analysis would be invalidated, requiring a revision of the entire wave structure and market outlook.
I am not Sebi registered analyst.
My studies are for educational purpose only.
Please Consult your financial advisor before trading or investing.
I am not responsible for any kinds of your profits and your losses.
Most investors treat trading as a hobby because they have a full-time job doing something else.
However, If you treat trading like a business, it will pay you like a business.
If you treat like a hobby, hobbies don't pay, they cost you...!
Hope this post is helpful to community
Thanks
RK💕
Disclaimer and Risk Warning.
The analysis and discussion provided on in.tradingview.com is intended for educational purposes only and should not be relied upon for trading decisions. RK_Chaarts is not an investment adviser and the information provided here should not be taken as professional investment advice. Before buying or selling any investments, securities, or precious metals, it is recommended that you conduct your own due diligence. RK_Chaarts does not share in your profits and will not take responsibility for any losses you may incur. So Please Consult your financial advisor before trading or investing.

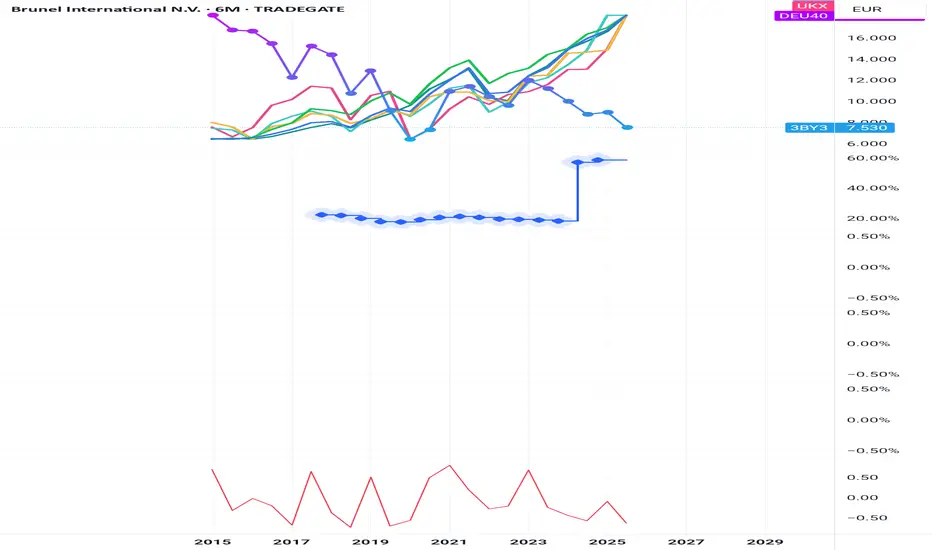
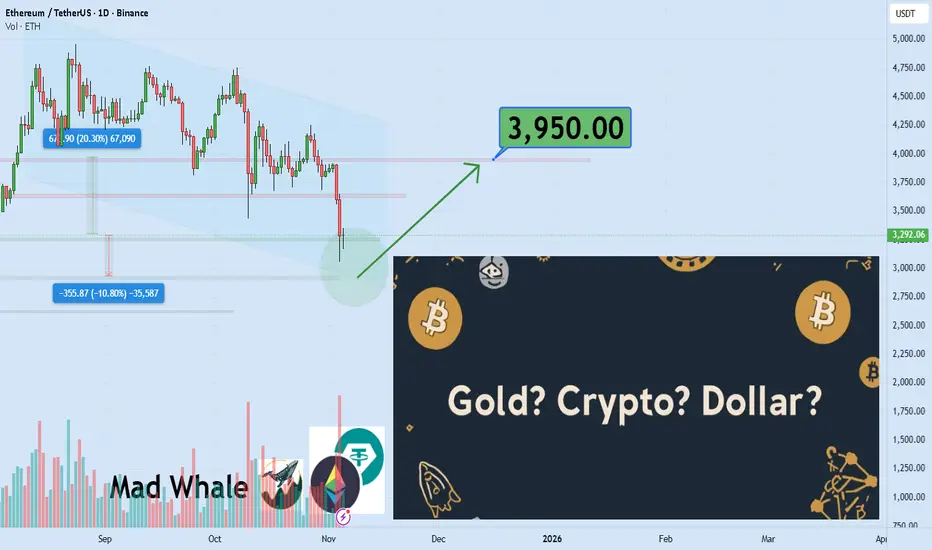
Gold, Dollar, or Bitcoin? The Great Wealth BattleWhen markets are turbulent, where does your capital stay? Do the old assets still shine, or is the new digital generation taking over? The answer lies not in prediction, but in intelligent asset management
Hello✌️
Spend 2 minutes ⏰ reading this educational material.
🎯 Analytical Insight on Ethereum:
Ethereum is testing the lower boundary of it descending channel and key daily support 📉.
If this level holds, a potential 20% upside could target $3950🚀.
Now , let's dive into the educational section,
🌍 Global Asset Map
Understanding the relationship between these three giants is the first step. Usually, a strong dollar puts pressure on the prices of gold and Bitcoin. But during periods of high inflation, all three can move in the same direction.
🧘 Track Market Psychology
Professional traders master their emotions. When greed becomes widespread, they intelligently exit the market, and when fear dominates, they gradually buy in.
⚖️ Capital Allocation Strategy
Never concentrate all your capital in one asset. A simple model suggests allocating part of your portfolio to gold as a safe haven, part to Bitcoin for growth, and part to cash for future opportunities.
🛡️ Smart Risk Management
Setting a stop loss for each asset is essential. This is like fastening your seatbelt while driving. Use the platform's tools to set automatic take-profit and stop-loss orders so emotions don't influence your decisions.
📊 Golden Tools on TradingView
Compare Feature
This feature allows you to bring different symbols onto one chart. You can view Bitcoin, gold, and the dollar index side by side and understand their correlation.
Power of Advanced Indicators
Indicators like Supertrend help you identify the trend direction. Additionally, using the ADX shows you the strength of the trend.
Identifying Divergence with RSI
When the price reaches a new high but the RSI forms a lower high, this is a serious warning. This signal can indicate a significant turning point.
💡Final Tips to Navigate the Chaos
First, focus on preserving your capital above chasing large profits. Second, always trust the data and charts, not rumors or emotional news. Third, never go against a strong trend use analytical tools to gauge the trend's strength.
💎 Final Word
Success in the market doesn't depend on choosing one champion, but on having a balanced strategy and managing your emotions. Use tools to make better decisions and stick to your trading plan.
✨ Need a little love!
We pour love into every post your support keeps us inspired! 💛 Don’t be shy, we’d love to hear from you on comments. Big thanks, Mad Whale 🐋
📜Please make sure to do your own research before investing, and review the disclaimer provided at the end of each post.
Emotional Trading AreaBehavior Analysis combined with your price-action trading skills can help tremendously in making your trading decisions. I believe that candlestick wicks (shadow) show us where traders will act emotionally before executing their trades. These wicks indicate earlier price rejection and create and area where emotions take over before execution. Decision time.

Types of Trading in the World Market1. Equity Trading (Stock Market Trading)
Overview
Equity trading refers to buying and selling shares of publicly listed companies. It’s one of the oldest and most popular forms of trading, conducted through stock exchanges like the New York Stock Exchange (NYSE), NASDAQ, London Stock Exchange (LSE), Tokyo Stock Exchange (TSE), and National Stock Exchange (NSE) in India.
Types of Equity Trading
Intraday Trading:
Traders buy and sell shares within the same trading day, aiming to profit from short-term price movements. Positions are squared off before market close.
Swing Trading:
Traders hold stocks for a few days or weeks, capitalizing on short- to medium-term price swings based on technical indicators and market structure.
Positional Trading:
This involves holding positions for several months based on long-term trends, earnings growth, or macroeconomic shifts.
Algorithmic & Quantitative Trading:
Computer-driven strategies execute trades based on mathematical models, speed, and efficiency, minimizing human error.
Why It Matters
Equity trading reflects the health of corporate and economic growth. It helps companies raise capital, offers liquidity to investors, and provides traders with opportunities for profit through price fluctuations.
2. Derivatives Trading
Overview
Derivatives are financial contracts whose value is derived from an underlying asset, such as stocks, commodities, interest rates, currencies, or indices. Common derivative instruments include futures, options, swaps, and forwards.
Main Types of Derivative Trading
Futures Trading:
Futures are standardized contracts to buy or sell an asset at a predetermined price on a future date. They are widely used for speculation and hedging — e.g., crude oil futures or Nifty futures.
Options Trading:
Options give traders the right but not the obligation to buy (call) or sell (put) an asset. This flexibility attracts both hedgers and speculators who seek leveraged exposure with limited risk.
Swaps and Forwards:
Forwards are over-the-counter (OTC) contracts with customizable terms.
Swaps involve exchanging cash flows, such as interest rate swaps or currency swaps.
Why It Matters
Derivatives are vital for risk management and price discovery. For instance, airlines hedge against rising fuel costs using crude oil futures, while exporters hedge currency risks via forex options.
3. Commodity Trading
Overview
Commodities are tangible goods like gold, silver, crude oil, natural gas, wheat, or coffee. Commodity trading dates back centuries and today takes place on organized exchanges like the Chicago Mercantile Exchange (CME), London Metal Exchange (LME), and Multi Commodity Exchange (MCX) in India.
Types of Commodity Trading
Hard Commodities:
These include natural resources extracted from the earth — metals (gold, silver, copper) and energy (crude oil, gas, coal).
Soft Commodities:
Agricultural products such as wheat, coffee, sugar, cotton, and soybeans fall under this category.
Spot vs. Futures Market
In the spot market, commodities are traded for immediate delivery.
In the futures market, contracts are traded for future delivery at a pre-agreed price.
Why It Matters
Commodity markets serve as a barometer for global economic health. Prices of oil, gold, and agricultural goods affect inflation, currency values, and even geopolitical stability.
4. Foreign Exchange (Forex) Trading
Overview
The foreign exchange market (Forex or FX) is the world’s largest and most liquid financial market, with daily trading volumes exceeding $7 trillion. It involves trading currency pairs such as EUR/USD, USD/JPY, GBP/INR, and USD/INR.
Types of Forex Trading
Spot Forex:
Currencies are exchanged instantly at the current market rate.
Forward Forex:
Agreements to buy/sell a currency at a future date at a fixed rate.
Currency Futures and Options:
Exchange-traded derivatives based on currency pairs.
Carry Trade:
Traders borrow in low-interest-rate currencies (e.g., JPY) and invest in higher-yielding currencies (e.g., AUD), profiting from the interest rate differential.
Why It Matters
Forex trading impacts global trade, tourism, and investment flows. Central banks, corporations, and investors use it to hedge currency exposure and speculate on macroeconomic trends.
5. Fixed Income (Bond) Trading
Overview
Bond trading involves buying and selling debt securities issued by governments, corporations, or financial institutions. Bonds provide fixed interest income and are considered relatively stable compared to equities.
Types of Bonds Traded
Government Bonds (Sovereign Debt): Issued by national governments (e.g., U.S. Treasuries, Indian G-Secs).
Corporate Bonds: Issued by companies to raise capital.
Municipal Bonds: Issued by local bodies for infrastructure projects.
Bond Market Trading Styles
Primary Market: New bonds are issued and sold directly to investors.
Secondary Market: Existing bonds are traded among investors.
Why It Matters
Bond trading plays a crucial role in interest rate transmission, fiscal policy management, and capital market stability. Institutional investors often rely on bonds for predictable income and risk diversification.
6. Cryptocurrency Trading
Overview
A modern addition to global markets, cryptocurrency trading involves digital assets like Bitcoin (BTC), Ethereum (ETH), and Solana (SOL). These assets trade on decentralized exchanges (DEXs) and centralized platforms (like Binance, Coinbase, or WazirX).
Forms of Crypto Trading
Spot Trading:
Direct buying/selling of cryptocurrencies for immediate settlement.
Margin Trading:
Borrowed funds are used to trade larger positions, amplifying potential gains (and losses).
Futures & Options on Crypto:
Derivative products for hedging or speculation based on future prices of digital assets.
DeFi & Staking:
Traders earn yields by locking assets in decentralized finance protocols.
Why It Matters
Crypto trading represents a new frontier of global finance — decentralized, transparent, and accessible 24/7. Despite volatility, it’s reshaping how traders and institutions view digital value and monetary systems.
7. Exchange-Traded Fund (ETF) Trading
Overview
ETFs are investment funds that track indices, commodities, or sectors and are traded like stocks. Examples include S&P 500 ETFs, Gold ETFs, and sectoral ETFs (like technology or healthcare).
Types of ETF Trading
Index ETFs: Track market indices such as NASDAQ-100 or Nifty 50.
Commodity ETFs: Represent commodities like gold or oil.
Bond ETFs: Mirror fixed income portfolios.
Thematic/Leveraged ETFs: Focus on emerging themes like AI, clean energy, or innovation.
Why It Matters
ETFs combine diversification and liquidity, enabling traders to gain exposure to broad markets or specific themes with minimal effort and cost.
8. Index Trading
Overview
Instead of trading individual stocks, traders can trade indices that represent a group of stocks, such as S&P 500, Dow Jones, FTSE 100, Nikkei 225, or Nifty 50.
Forms of Index Trading
Index Futures: Contracts based on the future value of an index.
Index Options: Options to speculate or hedge based on index movements.
CFDs (Contracts for Difference): Instruments to speculate on index price changes without owning underlying stocks.
Why It Matters
Index trading reflects the broader market trend and is a key tool for institutional investors managing portfolios or hedging systemic risk.
9. Real Estate Investment Trust (REIT) Trading
Overview
REITs are companies that own and operate income-generating real estate — such as office buildings, malls, or warehouses. They are listed and traded like stocks.
Types of REITs
Equity REITs: Own properties and generate rental income.
Mortgage REITs: Invest in real estate debt and earn interest income.
Hybrid REITs: Combine both models.
Why It Matters
REIT trading provides investors access to the real estate market with liquidity and lower capital requirements compared to buying property directly.
10. Environmental and Carbon Credit Trading
Overview
A relatively new type of market, carbon trading involves the buying and selling of carbon credits, which represent the right to emit a certain amount of carbon dioxide.
How It Works
Companies with excess carbon allowances sell them to those exceeding emission limits. Platforms like the EU Emissions Trading System (EU ETS) facilitate this trade.
Why It Matters
Carbon trading incentivizes sustainability and helps nations meet global climate goals, linking environmental policy with financial markets.
11. Proprietary and Institutional Trading
Overview
Beyond retail participation, large financial institutions and hedge funds engage in proprietary trading (prop trading) — using their own capital to generate profits — and institutional trading, which involves massive volumes handled by fund managers.
Key Strategies
Arbitrage: Exploiting price differences across markets.
High-Frequency Trading (HFT): Leveraging algorithms for microsecond trade execution.
Market Making: Providing liquidity by quoting buy/sell prices.
Why It Matters
Institutional trading ensures liquidity and efficiency, while prop trading adds depth and innovation to global markets.
12. Over-the-Counter (OTC) Trading
Overview
OTC trading occurs directly between two parties, outside of formal exchanges. It’s common in currencies, bonds, derivatives, and unlisted equities.
Why It Matters
OTC markets offer flexibility and customization but carry higher counterparty risk due to the lack of centralized regulation.
Conclusion: The Interconnected Trading Ecosystem
The global trading landscape is a dynamic network where every segment — from equities to crypto — contributes to market efficiency and liquidity.
Equity and ETF trading attract retail and institutional investors.
Derivatives and Forex markets manage global risks and currency exposures.
Commodity and carbon trading influence inflation and sustainability.
Crypto and DeFi trading symbolize the digital transformation of finance.
Ultimately, the types of trading in the world market form an integrated system that channels capital, manages risk, and reflects economic sentiment worldwide.
The future of trading lies in data-driven strategies, AI automation, cross-border integration, and sustainable finance, all of which will redefine how participants interact in this ever-evolving global marketplace.
What Rising Indices Mean for Global Investors1. Understanding Market Indices
A stock market index represents the performance of a group of selected stocks. These stocks are often chosen based on their market capitalization, sector, or regional importance. For example:
S&P 500 (U.S.) tracks 500 large American companies.
Nikkei 225 (Japan) represents 225 top companies listed on the Tokyo Stock Exchange.
FTSE 100 (U.K.) measures the top 100 companies listed on the London Stock Exchange.
When these indices rise, it usually indicates that the collective value of their constituent companies’ stocks is increasing. This upward trend is often interpreted as a sign of economic strength and investor confidence.
2. A Reflection of Economic Growth
Rising indices are generally viewed as a positive indicator of economic growth. Companies listed on major indices tend to perform well when the economy expands. Increased consumer spending, strong corporate earnings, and stable employment levels all contribute to higher profits, which in turn push stock prices higher.
For instance, during periods of economic recovery—such as after a recession or global crisis—indices tend to climb as investors anticipate future growth. This optimism encourages further investment, creating a feedback loop of confidence and capital inflows.
3. Investor Sentiment and Confidence
Stock indices also serve as a psychological measure of investor confidence. When indices are on an upward trend, it signals that investors believe in the long-term stability of the economy. Positive sentiment often leads to increased demand for equities, pushing prices higher.
Conversely, rising indices can also attract new participants who don’t want to “miss out” on market gains. This phenomenon, known as “herd behavior,” can drive short-term rallies, especially when accompanied by strong media coverage or positive macroeconomic data.
4. Attraction for Global Capital Inflows
When indices in a particular country or region rise consistently, foreign investors often take notice. A bullish stock market suggests economic stability, policy consistency, and profitable opportunities. As a result, global funds and institutional investors may increase their exposure to that market.
For example:
A rising Nifty 50 in India attracts foreign portfolio investment (FPI) due to India’s growth potential.
An uptrend in the S&P 500 may lure global investors seeking safety and steady returns in the world’s largest economy.
Such capital inflows further fuel index growth and can strengthen the host country’s currency, creating a reinforcing cycle of financial optimism.
5. Wealth Effect and Consumer Behavior
Rising indices create what economists call the “wealth effect.” As investors see the value of their portfolios grow, they feel wealthier and more confident about spending. Increased consumer spending boosts company revenues, reinforcing the positive cycle of growth and higher earnings.
This effect is particularly pronounced in countries where household wealth is significantly tied to stock ownership, such as the United States. Higher consumer confidence leads to robust retail activity, real estate investment, and broader economic expansion.
6. Portfolio Valuations and Institutional Impact
For mutual funds, pension funds, and exchange-traded funds (ETFs), rising indices directly enhance portfolio valuations. Higher index levels mean better fund performance, which attracts new investors and capital.
Institutional investors often use benchmarks like the MSCI World Index or S&P 500 to measure their own performance. When these benchmarks rise, fund managers may adjust strategies to maintain parity or outperform the market, increasing trading volumes and market liquidity.
7. Sectoral Insights and Rotations
Rising indices often conceal complex movements within sectors. For instance, while the overall market may be rising, certain industries—like technology or healthcare—may be outperforming others.
Global investors closely monitor sectoral rotations, where capital shifts from one sector to another. During times of optimism, growth sectors such as technology and consumer discretionary lead gains. In contrast, when the market matures, investors may rotate to defensive sectors like utilities or consumer staples to protect profits.
Understanding these rotations helps investors position themselves strategically within the larger trend of a rising index.
8. Currency Implications
A strong and rising stock market often leads to currency appreciation. As foreign investors pour capital into equities, demand for the local currency rises. For instance, a rally in the Japanese Nikkei could strengthen the yen if international investors buy Japanese assets.
However, there’s also a balancing act—if a country’s currency strengthens too much, its exports may become less competitive, potentially slowing corporate earnings growth in export-driven economies. Hence, central banks closely monitor these interactions to maintain economic stability.
9. Rising Indices and Inflation Expectations
While rising indices often indicate prosperity, they can also signal growing inflationary pressures. Strong corporate profits and consumer spending can lead to higher demand for goods and services, pushing up prices.
Central banks, such as the U.S. Federal Reserve or the European Central Bank, may respond by raising interest rates to control inflation. Higher interest rates, in turn, can slow down future market gains as borrowing becomes more expensive for companies and consumers.
Thus, investors must evaluate whether rising indices reflect sustainable growth or overheating markets.
10. Risk of Overvaluation
One of the main concerns during a period of sustained index growth is overvaluation. When stock prices rise faster than corporate earnings, price-to-earnings (P/E) ratios expand, suggesting that stocks may be overpriced.
Historically, overvaluation has preceded market corrections. The dot-com bubble of the late 1990s is a classic example where excessive optimism led to inflated valuations, followed by a sharp downturn.
Prudent investors monitor valuation metrics, earnings growth, and macroeconomic indicators to distinguish healthy rallies from speculative bubbles.
11. Diversification and Global Portfolio Strategy
For global investors, rising indices in one region can influence asset allocation strategies across markets. Investors may rebalance portfolios by:
Taking profits in overvalued markets.
Allocating funds to underperforming or emerging regions.
Hedging currency and geopolitical risks.
For example, if the U.S. market is surging while Asian markets are lagging, investors might diversify into Asia for potential future gains once valuation gaps narrow.
Diversification remains a key principle—no matter how promising a market appears, concentration risk can magnify losses if conditions suddenly change.
12. Long-Term vs Short-Term Interpretations
Rising indices must be viewed through different time horizons:
Short-term investors see rising indices as trading opportunities driven by momentum.
Long-term investors interpret them as reflections of structural economic progress, technological innovation, or policy stability.
Therefore, understanding the context behind index movements—earnings growth, fiscal policy, interest rates, or geopolitical developments—is essential for making informed investment decisions.
Conclusion
Rising indices symbolize confidence, economic vitality, and investor optimism in global markets. They indicate strong corporate earnings, robust demand, and capital inflows. However, they also come with risks—such as overvaluation, inflationary pressures, and the potential for sharp corrections.
For global investors, rising indices should not be seen merely as a signal to buy, but as a prompt to analyze fundamentals, monitor macroeconomic trends, and rebalance portfolios wisely. A disciplined, informed approach allows investors to harness the opportunities of a bullish market while remaining prepared for inevitable market cycles.

Inflation and Interest Rates Impact in the Global Market1. Understanding Inflation and Interest Rates
Inflation refers to the sustained increase in the general price level of goods and services over time. It reduces the purchasing power of money—meaning each unit of currency buys fewer goods than before. Moderate inflation is a sign of economic growth, while excessive inflation (hyperinflation) can destabilize economies.
Interest rates, on the other hand, represent the cost of borrowing money. They are typically set by a country's central bank, such as the U.S. Federal Reserve (Fed), the European Central Bank (ECB), or the Reserve Bank of India (RBI). When inflation rises, central banks usually raise interest rates to control it; when inflation falls, they lower rates to stimulate borrowing and investment.
2. The Relationship Between Inflation and Interest Rates
The link between inflation and interest rates is both direct and inverse:
When inflation increases, central banks raise interest rates to slow down demand and stabilize prices.
When inflation decreases, interest rates are lowered to encourage spending and investment.
This balancing act aims to maintain price stability without hurting economic growth. However, in a globally connected economy, these changes affect not just domestic markets but also cross-border trade, capital flows, and investment sentiment.
3. Impact on Global Financial Markets
a. Stock Markets
Inflation and interest rates play a major role in determining stock market trends.
High Inflation: When inflation is high, companies face higher input costs (such as raw materials and wages), which reduce profit margins. Investors may anticipate lower earnings and reduce exposure to equities, causing stock prices to fall.
Rising Interest Rates: As borrowing becomes more expensive, businesses cut down on expansion plans, and consumers reduce spending. This lowers corporate revenues and earnings, leading to a bearish market.
For example, in 2022, the U.S. Federal Reserve’s aggressive rate hikes to curb inflation caused major global indices like the S&P 500 and NASDAQ to decline sharply. Technology and growth stocks were particularly affected due to their dependency on low borrowing costs.
b. Bond Markets
Bond prices and interest rates move in opposite directions.
When interest rates rise, the yields on newly issued bonds become more attractive, leading to a decline in the prices of existing bonds.
When rates fall, older bonds with higher yields gain value.
Global investors often shift between bonds and equities depending on the interest rate environment. For instance, when inflation is high and rates rise, investors may prefer short-term bonds or inflation-protected securities.
c. Currency Markets (Forex)
Inflation and interest rates significantly affect currency values.
A country with high interest rates often attracts foreign investors seeking higher returns, leading to currency appreciation.
Conversely, high inflation tends to devalue a currency, as its purchasing power erodes.
This dynamic can create volatility in foreign exchange markets. For example, the U.S. dollar typically strengthens when the Federal Reserve raises rates, as global investors move capital to dollar-denominated assets.
d. Commodity Markets
Commodities such as gold, oil, and agricultural products are closely tied to inflation trends.
High Inflation: Commodities often rise in price because investors use them as a hedge against inflation. Gold, for instance, tends to perform well when inflation is high or when real interest rates are negative.
Interest Rate Hikes: Higher interest rates can reduce demand for commodities by strengthening the currency and making holding physical assets less attractive.
In 2022–2023, oil and gold prices fluctuated heavily in response to inflationary pressures and central bank rate adjustments worldwide.
4. Impact on International Trade and Investment
a. Trade Balances
Inflation can affect a country's trade competitiveness. When domestic prices rise faster than those of trading partners, exports become more expensive, reducing demand from foreign buyers. Meanwhile, imports may become cheaper, worsening the trade balance.
Interest rates also influence trade. Higher rates tend to strengthen the domestic currency, making exports less competitive and imports cheaper—again, affecting trade dynamics.
b. Foreign Direct Investment (FDI)
Global investors closely monitor inflation and interest rate trends before committing capital.
Stable inflation and moderate interest rates attract long-term investment, as they indicate economic predictability.
High inflation and volatile rates discourage FDI due to uncertainty about future returns and exchange rate risks.
For example, emerging markets like India or Brazil attract foreign capital when inflation is under control and real interest rates are favorable.
5. Impact on Emerging and Developed Economies
a. Developed Economies
In advanced economies like the U.S., Japan, or the Eurozone, central banks use sophisticated tools to manage inflation and interest rates. However, global shocks—such as the COVID-19 pandemic or energy price spikes—can still cause inflationary surges that ripple through global markets.
Rising rates in these economies often lead to capital outflows from emerging markets as investors seek safer returns in stable currencies. This can cause volatility in developing countries’ stock and bond markets.
b. Emerging Markets
Emerging economies are more vulnerable to inflation and interest rate fluctuations because they rely heavily on foreign investment and imported goods. When global interest rates rise, these countries face higher borrowing costs and currency depreciation.
For instance, when the U.S. Federal Reserve increases rates, countries like India, Indonesia, or South Africa often experience currency pressure and foreign capital outflows. This impacts their stock markets and economic growth prospects.
6. Central Bank Strategies and Global Coordination
Central banks play a crucial role in managing inflation and interest rates. Major institutions such as the Federal Reserve, European Central Bank, Bank of England, and Bank of Japan use tools like:
Open market operations (buying or selling government bonds)
Reserve requirements
Policy interest rate adjustments
Global coordination among central banks is often necessary to avoid severe currency fluctuations or market shocks. For instance, during the 2008 financial crisis and the 2020 pandemic, major central banks collaborated to maintain global liquidity and stabilize financial systems.
7. Long-Term Implications for Global Markets
The long-term impact of inflation and interest rate movements includes:
Shift in Investment Strategies: Investors move between asset classes (equities, bonds, commodities) depending on rate trends.
Corporate Debt Management: Companies may restructure their debt portfolios to minimize interest burdens.
Economic Growth Patterns: Prolonged high rates may slow global growth, while ultra-low rates risk creating asset bubbles.
Policy Dilemmas: Central banks must balance fighting inflation with avoiding recession—a challenge seen frequently in recent years.
8. Conclusion
Inflation and interest rates act as the twin levers of the global economy. Their interplay determines the rhythm of economic growth, the flow of international capital, and the behavior of financial markets. While moderate inflation and balanced interest rates indicate a healthy economy, extreme conditions—either high inflation or rapid rate hikes—can trigger global instability.
For investors and policymakers, understanding this relationship is crucial. A rise in inflation signals the need for vigilance in portfolio management and monetary policy, while changing interest rates dictate shifts in market behavior across sectors and nations. In an interconnected world, the effects of these two forces transcend borders, shaping the future of trade, investment, and financial stability worldwide.

How International Payment Gateways Work1. What is an International Payment Gateway?
An international payment gateway is an online service that authorizes and processes payments between a buyer and a seller across different countries. It acts as a digital intermediary that connects the merchant’s website to the acquiring bank (merchant’s bank) and issuing bank (customer’s bank).
For instance, when a customer in India buys a product from a U.S.-based e-commerce store, the payment gateway securely transmits the payment data, verifies it, converts the currency if needed, and ensures the funds are transferred to the merchant after validation.
In simple terms, the gateway ensures that cross-border payments are fast, safe, and compliant with global financial regulations.
2. The Role of a Payment Gateway
The primary role of an international payment gateway is to:
Authorize transactions between buyers and sellers.
Encrypt sensitive financial data to prevent fraud.
Convert currencies based on real-time exchange rates.
Integrate with multiple payment methods like credit/debit cards, digital wallets, and bank transfers.
Comply with regional financial laws such as PCI DSS (Payment Card Industry Data Security Standard) and anti-money laundering (AML) regulations.
3. How the Process Works – Step-by-Step
The process behind international payment gateways might seem complex, but it typically follows these major steps:
Step 1: Customer Initiates Payment
A buyer chooses a product or service on an online platform and proceeds to checkout. At this point, they select a payment method — credit/debit card, PayPal, or other options supported by the merchant’s gateway.
Step 2: Encryption and Data Transmission
When the buyer submits payment information, the gateway encrypts sensitive details (like card numbers and CVV codes) using SSL (Secure Socket Layer) or TLS (Transport Layer Security) technology. This ensures that data remains confidential during transmission.
Step 3: Authorization Request
The gateway sends the encrypted data to the acquiring bank (the merchant’s bank), which then forwards it to the card network (Visa, Mastercard, etc.) and ultimately to the issuing bank (the customer’s bank).
Step 4: Verification and Approval
The issuing bank checks whether the customer has sufficient balance and whether the transaction looks legitimate. Based on this assessment, the bank either approves or declines the transaction.
Step 5: Authorization Response
The approval or decline message is sent back through the same route — from the issuing bank to the card network, then to the acquiring bank, and finally to the payment gateway, which updates the merchant’s website.
Step 6: Settlement
If approved, the funds are debited from the customer’s account and transferred to the merchant’s account (after deducting applicable fees). Currency conversion happens here if it’s an international transaction.
Step 7: Confirmation
The customer receives a confirmation message that the payment has been successful, and the merchant can now proceed to deliver the goods or services.
This entire process usually happens within a few seconds — showcasing how efficient modern financial technology has become.
4. Key Technologies Behind Payment Gateways
International payment gateways rely on several core technologies to ensure seamless operations:
Encryption: Protects sensitive payment data from hackers.
Tokenization: Converts card details into a unique token that can be reused safely without storing real card data.
Fraud Detection Systems: Uses AI and machine learning algorithms to identify suspicious transactions.
3D Secure Authentication: Adds an extra layer of protection for online card payments (e.g., “Verified by Visa” or “Mastercard SecureCode”).
APIs (Application Programming Interfaces): Allow integration between merchant websites and payment processors.
Blockchain (Emerging Trend): Some gateways use blockchain for transparent and faster cross-border settlements.
5. Currency Conversion and Exchange Rates
One of the biggest challenges in international payments is currency conversion. Payment gateways automatically convert the transaction amount from the customer’s currency to the merchant’s preferred currency using real-time foreign exchange rates.
However, they also charge a foreign transaction fee or FX markup, which varies depending on the gateway provider and bank partnerships.
For example:
If a customer in Europe buys a $100 item from a U.S. store, the payment gateway converts euros to dollars based on the current exchange rate, then processes the transaction accordingly.
6. Security and Compliance
Security is the cornerstone of international payment gateways. Since they handle sensitive financial data, they must comply with strict global standards:
PCI DSS Compliance: Mandates secure storage and transmission of card data.
KYC (Know Your Customer): Ensures that businesses and users are verified to prevent fraud.
AML (Anti-Money Laundering) Regulations: Prevents illicit financial activities.
GDPR (General Data Protection Regulation): Protects data privacy for European users.
Additionally, many gateways employ multi-factor authentication (MFA) and real-time fraud monitoring systems to safeguard users.
7. Examples of International Payment Gateways
Some leading international payment gateways include:
PayPal: One of the oldest and most trusted gateways supporting 200+ countries.
Stripe: Popular among developers for its flexible APIs and multi-currency support.
Razorpay & PayU (India): Offer international transaction capabilities with local compliance.
2Checkout (now Verifone): Handles global payments with multiple currency options.
Amazon Pay & Apple Pay: Focus on convenience and mobile payment integration.
Each gateway differs in transaction fees, integration options, and supported currencies.
8. Challenges in International Payments
Despite technological advances, international payment gateways face several challenges:
Currency Fluctuations: Exchange rate volatility affects transaction costs.
Regulatory Barriers: Each country has unique financial laws.
High Transaction Fees: Cross-border payments can be expensive for small businesses.
Payment Fraud and Chargebacks: Increased risk due to international nature of transactions.
Integration Complexity: Businesses must ensure compatibility with multiple payment systems.
9. The Future of International Payment Gateways
The future of global payment gateways is being shaped by innovation and digital transformation. Some emerging trends include:
Blockchain-based Payments: Faster and cheaper cross-border transactions.
AI-Powered Fraud Detection: Real-time identification of anomalies.
CBDCs (Central Bank Digital Currencies): Government-backed digital currencies will integrate into gateways.
Embedded Finance: Payment solutions built directly into apps and online stores.
Seamless Multi-Currency Wallets: Allowing users to hold, convert, and pay in different currencies easily.
10. Conclusion
International payment gateways are the backbone of global digital commerce. They simplify complex financial processes, connect different banking systems, and ensure that transactions happen securely and efficiently across borders. From a customer’s click on “Pay Now” to the merchant receiving funds, gateways manage countless tasks — encryption, verification, conversion, and compliance — in just seconds.
As e-commerce continues to expand globally, these gateways will become even more critical, evolving with technology and regulation to create a truly borderless financial ecosystem where anyone, anywhere, can transact confidently.