PSO - Short Term Round bottom formationPSO is developing a well-defined rounded bottom on the 1H chart, with price now approaching the major neckline at 480. A decisive breakout above this zone would confirm the reversal pattern and open the door for continuation toward higher resistance levels. Bullish structure remains intact while holding above 450–455
Pakistan

PAEL - Technical Outlook PAEL is showing a potential breakout above a long-term descending resistance trendline, supported by increased volume and a firm base on the ascending trendline near 52. A sustained move above 54 could signal a strong bullish continuation with clearly defined targets:
• TP1: 56.03
• TP2: 57.82
• TP3: 60.20
• TP4: 62.63
Stop-loss is recommended at 51.30 to protect against false breakouts. Momentum indicators support a cautiously optimistic outlook.

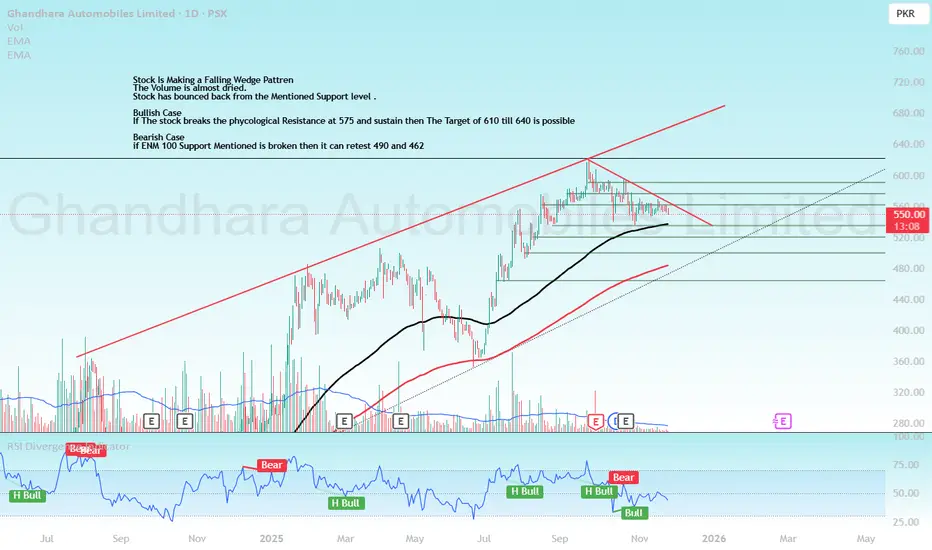
GAL Technical Analysis PSX , PakistanStock Is Making a Falling Wedge Pattren
The Volume is almost dried.
Stock has bounced back from the Mentioned Support level .
Bullish Case
If The stock breaks the phycological Resistance at 575 and sustain then The Target of 610 till 640 is possible
Bearish Case
if ENM 100 Support Mentioned is broken then it can retest 490 and 462
PSOPSO has bounced strongly from the 430–440 support with RSI turning upward, signalling renewed momentum. On the weekly timeframe, the structure has formed a classic Cup & Handle, adding confluence to the bullish bias.
Upside Targets: 494, 522, 560, 614
Bias remains bullish as long as price holds above 435–440.

TRG Pakistan Limited – Breakout and Technical OutlookTRG Pakistan Limited (PSX: TRG) has been consolidating within a multi-year descending channel and is now approaching a critical technical juncture.
Technical Structure
Downtrend Resistance: The stock has remained under a long-term declining trendline since early 2021, consistently making lower highs.
Support Base: Strong demand has been observed in the 44–50 PKR zone, which has acted as a multi-touch support level.
Immediate Resistance:
68.66 PKR – near-term breakout level.
80.51 PKR – mid-term resistance.
93.73 PKR and 100.76 PKR – long-term upside targets upon a sustained breakout.
Price Outlook
A close above 68.66 PKR would indicate a potential structural shift, opening room toward the 80–100 PKR range.
Sustained price action above the descending trendline would confirm a long-term reversal and potentially attract institutional participation.
Conversely, failure to hold above current levels could lead to a retest of the 50–44 PKR demand zone.
Strategic View
TRG remains in a neutral-to-bullish posture in the short term. A confirmed breakout above resistance levels will improve risk-reward dynamics for medium- to long-term investors, while the downside remains capped by a well-defined support base.

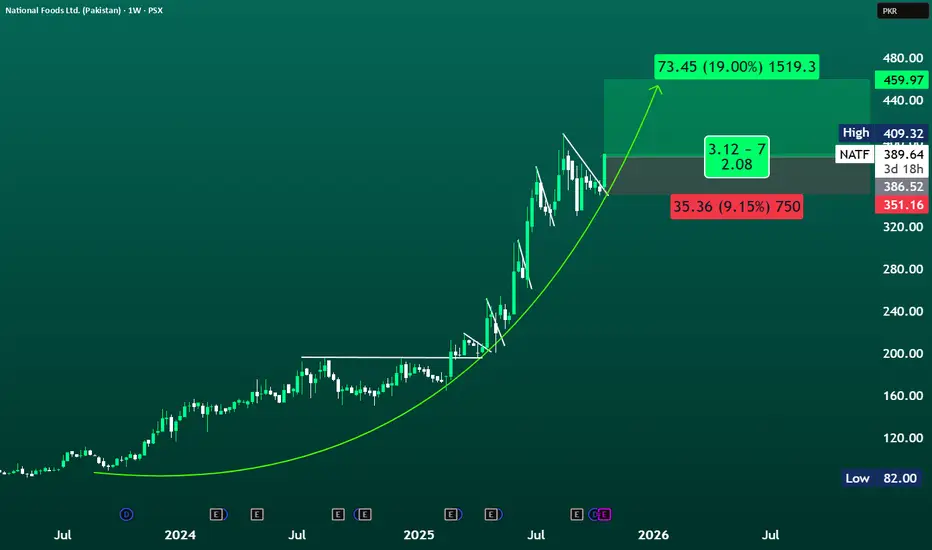
NATF Breakout Daily & Weekly; Potential UpsideNATF – Weekly Breakout Setup
CMP: 389.64
Pattern: Curved base breakout continuation
Momentum: Strong +10% weekly move with volume surge
Buy Range: 385 – 395
Stop Loss: 351
Target Zone: 440 – 460
Upside Potential: ~19%
Risk: ~9%
NATF has resumed its long-term uptrend after retesting support from the curved base structure.
The breakout from the consolidation zone signals trend continuation with potential upside toward PKR 459–460, backed by strong volume and momentum.
Holding above 386 keeps the bullish bias intact.
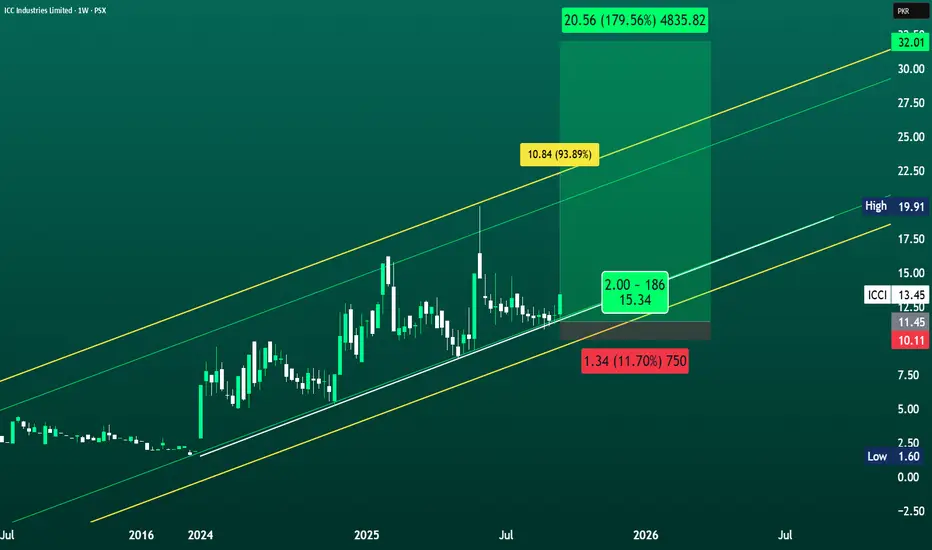
ICCI TRADING IN UPWARD CHANNEL; TG 20 - 30ICCI is trading inside a long-term upward channel and recently bounced off key trendline support. Strong green candles with rising volumes point to accumulation. Sustaining above 12.00 keeps the bullish trend intact. A breakout above 15–16 could fuel momentum toward higher targets.
Primary Support: 12.00 – 12.50 (trendline + recent consolidation base)
Trade Setup – ICCI
CMP: ~13.45
Entry Zone: 12.50 – 13.50
Stop Loss: 10.10
Target 1: 16.30 – 20.50 (~+90%)
Target 2: 25.00 – 32.00 (~+180%)
Risk/Reward: ~1:6 (favorable)
⚠️ Disclaimer
This is educational analysis only and not financial advice. Trading carries risk; please do your own research and consult a licensed financial advisor before making decisions.
ICIBL - Bull Flag Breakout @ 6.70, TG 14 - 18ICIBL — Trade Setup
ICIBL recently found support near Rs. 6.00, which acted as a base after a steep correction. The stock has formed a falling wedge pattern, typically a bullish reversal signal. A breakout attempt is underway, with Fibonacci retracements highlighting key resistance levels ahead.
Trade Idea
Entry Zone: Rs. 6.2 – 6.8 (post wedge breakout confirmation)
First Hurdle: Rs. 7.2 (short-term resistance, ~+8%)
Mid Resistances: Rs. 9.0 – 10.0 (Fib levels: 38%–50%)
Major Resistance: Rs. 13.9 (prior high)
Upside Potential: If momentum sustains, the move could extend towards Fib extensions Rs. 16–18+ in medium term.
Risk Management
Stop Loss: Below Rs. 6.0 (base level)
Downside Risk: A breakdown under Rs. 6.0 opens room to revisit Rs. 5.0 and possibly Rs. 4.0.
Risk/Reward: Favorable as long as the base holds, but volatility is high.
This analysis is for educational purposes only and does not constitute financial advice or a buy/sell recommendation. Chart setups highlight probabilities, not certainties. Always do your own research (DYOR) before making investment decisions.

AGL has been riding a 2-year uptrend channel#Agritech Limited (#AGL) — Technical & Performance Outlook
AGL has been riding a 2-year uptrend channel, delivering extraordinary performance across multiple cycles. From its base near Pkr4, the stock surged over +634% into Pkr. 28 in 2023. After consolidation, it launched another +393% rally, underscoring the strength of its trend-following structure.
Currently, the stock is again respecting its long-term rising channel and has formed a Bullish Harami Cross on the weekly timeframe, a pattern that normally precedes a fresh leg higher. The ongoing #consolidation near 70–75 is acting as a mid-cycle base and a decisive breakout above 88.50 could re-ignite AGL’s historical tendency of multi-fold returns.
📈Historical Performance
Cycle 1 (2023): +634% gain from ~Pkr4.00 to 25.00
Cycle 2 (2024–25): +376% gain from 18.7 to 76.00, continuing inside the channel
Ongoing Cycle: Price building a rounded base with signs of #accumulation, potential #continuation if resistance breaks.
Risk & Outlook:
#Upside Potential: Sustained break above 88.50 may unlock another powerful rally within the channel trend.
#Downside Risk: Failure to break out, or a fall below 70–72, risks retesting 59–60; a deeper slip below this zone would negate the bullish structure.
⚠️ Disclaimer
For educational purposes only. Not financial advice. Past performance ≠ future results.

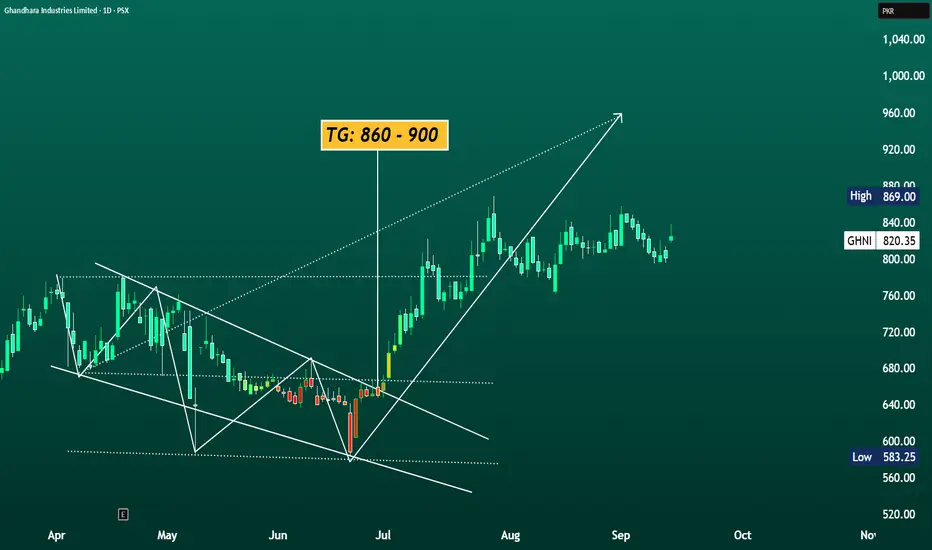
GHNI TARGETING: 900 ??#GHNI has been consolidating in a range and is now showing signs of strength with upside potential. The chart suggests a possible move towards the target zone: 860 – 900 if momentum sustains.
Chart Highlights:
✅ Current price: 821.11
✅ Consolidation breakout attempt in progress.
📌 Resistance: 841 - 869
📌 Support: 796 - 760 short-term, strong support near 745.
⚠️ Disclaimer:
This post is for educational purposes only and not financial advice. Trading/investing involves risks – always DYOR (Do Your Own Research) or consult a licensed financial advisor before making decisions.
TRG From 58 -- 75 in no time (+29%) after our call TRG From 58 -- 75in no time (+29%) after our call — breakout delivering strong gains
TRG ELITE KATCHRA💎
CMP: 58.76
From forgotten junk to potential multi-bagger 2x... 3X...4X...? will see what unfolds...
TRG is showing signs of a potential long-term reversal after a multi-year downtrend. Price action is compressing within a large falling wedge pattern, typically a bullish formation. A breakout above the upper trendline (~60–62) with volume could trigger a major upside move 110 - 120, with a long-term price target potentially reaching 153 - 200+.
Watch closely for confirmation abv 76.00 on weekly.
This analysis is for educational and informational purposes only. It does not constitute investment advice or a recommendation to buy or sell any security. Always conduct your own research or consult with a licensed financial advisor before making investment decisions. Past performance is not indicative of future results.
#kse100 #psx #tradeflow #trg #pakistan
As of 05, July 2025

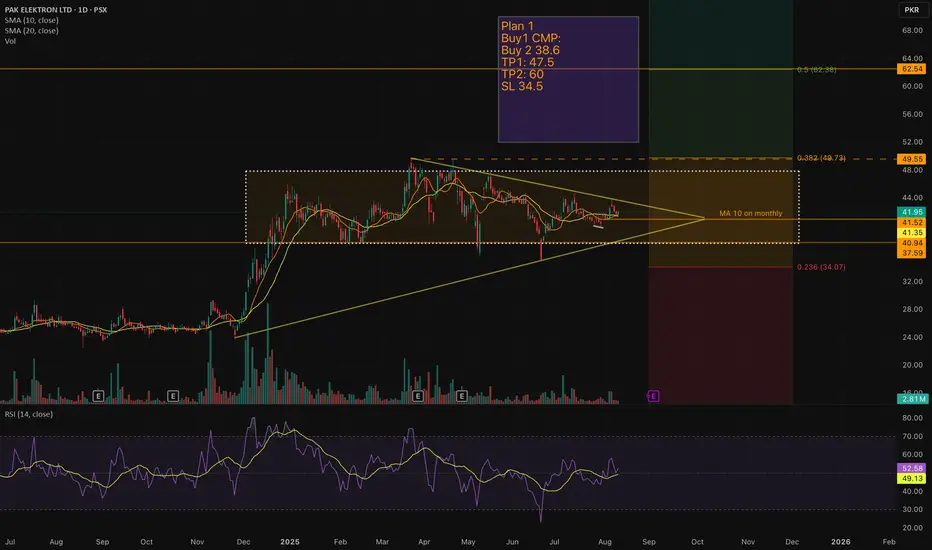
PAEL – Symmetrical Triangle Breakout Loading?PAK Elektron Ltd (PSX: PAEL) has been consolidating for months inside a symmetrical triangle, with price hugging the 10 & 20 SMA zone. The breakout could be just around the corner.
📊 Technical Outlook:
Pattern: Symmetrical triangle within a larger consolidation box.
Current CMP: 41.95
MA10 on monthly: Acting as dynamic resistance.
Volume: Noticeable spikes during upswings, showing accumulation.
RSI: Neutral zone at 52 – plenty of room for momentum in either direction.
📝 Trading Plan:
Buy 1: CMP (41.95)
Buy 2: 38.6 (on dip if retest happens)
TP1: 47.5 (near 0.382 Fib level)
TP2: 60 (major Fib retracement level 0.5)
SL: 34.5
⚡ Why Interesting?
Price has been coiling, reducing volatility – a breakout can trigger strong moves.
Weekly & Monthly structure shows alignment for a potential uptrend continuation.
Above 49.5, momentum could accelerate toward 62+.
🔍 Watch Levels:
42.50 breakout confirmation zone
38.50 retest support
49.5 major resistance
Disclaimer: This is not financial advice – just my personal trade setup based on technical analysis. Always do your own research before entering any trade.
Airlink: Wyckoff Automatic Rally in Play!#Airlink has started to show the classic signs of a Wyckoff Automatic Rally (AR) after months of persistent decline. The stock found strong demand inside the sell-side liquidity zone of 116.5–137.5, which acted as a potential Selling Climax (SC) where weak hands exited and stronger players absorbed supply. From there, the sharp bounce towards 161+ marked the Automatic Rally, signaling that supply had been absorbed and demand was strong enough to push prices higher.
The Secondary Test (ST) has already been completed within the same liquidity zone, confirming demand absorption and strengthening the accumulation structure. With ST out of the way, the stock now eyes a potential Sign of Strength (SOS), which could emerge on a breakout above 180–185.
If successful, the next upside target lies around 225 (previous high), while 200 could act as a Last Point of Support (LPS) on a retest. On the downside, a break below 116.5 would invalidate the accumulation setup and reintroduce markdown risk. Overall, #Airlink appears positioned in the early accumulation-to-markup stage of Wyckoff with a strong upside bias if the trading range holds.
#Disclaimer: This analysis is for educational purposes only and not financial advice. Trading stocks involves risk; past performance does not guarantee future results. Please do your own research before investing.

BBFL – Big Bird Foods Limited: Range Breakout SetupBBFL has been moving sideways for months, locked inside a consolidation box 🟧. Price is holding well above the key support zone and building energy for the next decisive move. A breakout above the range could open the door to strong upside momentum.
🔑 Key Levels:
CMP: 47.37
Support / Stop-loss: 44 🛡️
Range Resistance: 55.5 🚧
📌 Trading Plans:
Plan 1 (Aggressive):
Buy @CMP or on dips to 45.5
SL: 44 ❌
TP1: 52 🎯
TP2: 55 🎯
Plan 2 (Conservative):
Buy only above 55.5 on closing basis ✅
TP1: 63.7 🎯
TP2: 69.5 🎯
TP3: 77.7 🚀
⚡ BBFL is at a make-or-break zone. Holding above support keeps bulls in control, while a breakout above 55.5 could trigger the next rally.

What’s America's Real Goal in a Possible India–Pakistan War?We are nearing the end of the petro-dollar era. The power balance of the new world order will be defined not by oil, but by the strategic resources essential for AI, electric vehicles, and cutting-edge technology.
Throughout the 20th century, the U.S. maintained its global dominance by controlling access to oil. From the Middle East to Latin America and Africa, wherever oil was found, the U.S. was there.
But today, the focus has shifted to rare earth elements, lithium, copper, and other strategic minerals.
Trump’s 2025 move to buy Greenland wasn’t a diplomatic joke—it was a signal. Behind-the-scenes deals in Ukraine for rare earth deposits tell the same story: whoever controls these "white gold" assets will lead the tech-driven world.
Now enters Pakistan, with mineral-rich lands spanning over 600,000 km², nearly three times the size of the UK. Experts estimate its underground reserves to be worth $8 trillion.
In Balochistan's Rekodik field alone, there are 12 million tons of copper and 20 million ounces of gold, with a copper purity of 0.53%, well above global standards. In the north, newly discovered lithium reserves could be a game-changer for the EV revolution.
This is no longer just about resources—this is about deciding the future balance of global power.

PAEL SETUP ONCE AGAINPAEL is currently at its orderblock zone where the liquidity is resting if volumes come in at this level then we can expect a bounce again if the orderblock fails and there is no liquidity in OB then wait for downside levels and if the weekly ema 21 is broken then i see 30 level coming but still we will look into some more levels for now just focus on this orderblock
the previous supply is completed here

#ACPL is above green sky (strong bullish zone)#Acpl is now above green sky (Strong bullish zone). It is expected to cross 280 and 320 level.
Note: This is not a buy or sell call, trade at your own will. Use stop loss as per your strategy.

Psx (stock) is above green sky (strong bullish zone)Psx is now above green sky (Strong bullish zone). It is expected to cross 30 and 40 level.
Note: This is not a buy or sell call, trade at your own will. Use stop loss as per your strategy.

#Pael is above green sky (strong bullish zone)Hcar is now above green sky (Strong bullish zone). It is expected to cross 50 and 60 level.
Note: This is not a buy or sell call, trade at your own will. Use stop loss as per your strategy.

#Ssgc is above green sky (strong bullish zone)#Ssgc is now above green sky (Strong bullish zone). It is expected to cross 45 and 60 level.
Note: This is not a buy or sell call, trade at your own will. Use stop loss as per your strategy.

#CPHL is above green sky (strong bullish zone )#CPHL is now above green sky (Strong bullish zone). It is expected to cross 110 and 130 level.
Note: This is not a buy or sell call, trade at your own will. Use stop loss as per your strategy.

Glaxo is above green sky (strong bullish zone)Glaxo is now above green sky (Strong bullish zone). It is expected to cross 500 and 600 level.
Note: This is not a buy or sell call, trade at your own will. Use stop loss as per your strategy.

Hcar is above green clouds (Strong bullish zone)Hcar is now above green sky (Strong bullish zone). It is expected to cross 350 and 400 level.
Note: This is not a buy or sell call, trade at your own will. Use stop loss as per your strategy.
