Can Software Win Wars and Transform Commerce?Palantir Technologies has emerged as a dominant force in artificial intelligence, achieving explosive growth through its unique positioning at the intersection of national security and enterprise transformation. The company reported its first billion-dollar quarter with 48% year-over-year sales growth, driven by an unprecedented 93% surge in U.S. commercial revenue. This performance stems from Palantir's proprietary Ontology architecture, which solves the critical challenge of unifying disparate data sources across organizations, and its Artificial Intelligence Platform (AIP) that accelerates deployment through intensive bootcamp sessions. The company's technological moat is reinforced by strategic patent protections and a remarkable 94% Rule of 40 score, signaling exceptional operational efficiency.
Palantir's defense entrenchment provides a formidable competitive advantage and guaranteed revenue streams. The company secured a $618.9 million Army Vantage contract and deployed the Maven Smart System for the Marine Corps, positioning itself as essential infrastructure for the Pentagon's Combined Joint All-Domain Command and Control strategy. These systems enhance battlefield decision-making, with targeting officers processing 80 targets per hour versus 30 without the platform. Beyond U.S. forces, Palantir supports NATO operations, assists Ukraine, and partners with the UK Ministry of Defence, creating a global network of high-margin, long-term government contracts across democratic allies.
Despite achieving profitability with 26.8% operating margins and maintaining $6 billion in cash with virtually no debt, Palantir trades at extreme valuations of 100 times revenue and 224 times forward earnings. With 84% of analysts recommending Hold or Sell ratings, the market remains divided on whether the premium is justified. Bulls argue the valuation reflects Palantir's transformation from niche government contractor to critical AI infrastructure provider, with analysts projecting potential revenue growth from $4.2 billion to $21 billion. The company's success across nine strategic domains—from military modernization to healthcare analytics—suggests it has built an "institutionally required platform" that could justify sustained premium pricing.
The investment thesis ultimately hinges on whether Palantir's structural advantages—its proprietary data integration technology, defense entrenchment, and accelerating commercial adoption—can sustain the growth trajectory demanded by its valuation. While the platform's complexity requires heavy customization and limits immediate scalability compared to simpler competitors, the 93% commercial growth rate validates enterprise demand. Investors must balance the company's undeniable technological and strategic positioning against valuation risk, with any growth deceleration likely triggering significant multiple compression. For long-term investors willing to weather volatility, Palantir represents a bet on AI infrastructure dominance across both military and commercial domains.
Palantir

Palantir / Tesla fractal STILL "strangely accurate".What is a fractal mathmatically?
All asset charts are graphs, governed by coordinates on an x-axis and y-axis "chart". Where there exist trendlines that price action "respects". These trendlines and ratios are dictated by equations with several variables. If variables were by definition "random", then what would be the chance of 1 fractal appearing in a random assortment of buyers and sellers, in all different time zones (and countries)... all buyin in different amounts...at different times...
Regardless the fractal seems to remain intact.
Palantir (PLTR) hit a new All Time HighPalantir (PLTR) ht a new All-Time-High (ATH) at $192.83 today.
Many of my friends said, ''Rawlings, why did you sell off at ATH?''
As an investor who knows how to be content, I learned my lessons along the way.
I bought my last PLTR holdings at the rate of $158.98 and sold at $191.89.
I made $32.91 for every $158.98 that I invested = over 20% ROI.
As a technical Analyst, I see a possibility of this stock pulling back a bit if the rally continues.
My target re-entry will be $180 zone and a retest of the ascending trendline on my chart.
Trade with care.
Also remember that knowing how to TP is a skill
PALANTIR sitting on a Buy Zone. Target $220.Palantir (PLTR) has been trading within a Channel Up since early May and is currently consolidating on its bottom (Higher Lows trend-line). while holding he 1D MA50 (red trend-line). The 4H MA50 (blue trend-line) - 1D MA50 range has been technically the most optimal buy zone of this pattern.
With the 4H RSI exhibiting a Bull Flag similar to May - June, we expect the stock to aim for at least its 2.618 Fibonacci extension at $220.00. If broken, it may extend for an end-of-year rally to $255.00 completing a +80% Bullish Leg similar to the Channel's first.
-------------------------------------------------------------------------------
** Please LIKE 👍, FOLLOW ✅, SHARE 🙌 and COMMENT ✍ if you enjoy this idea! Also share your ideas and charts in the comments section below! This is best way to keep it relevant, support us, keep the content here free and allow the idea to reach as many people as possible. **
-------------------------------------------------------------------------------
💸💸💸💸💸💸
👇 👇 👇 👇 👇 👇

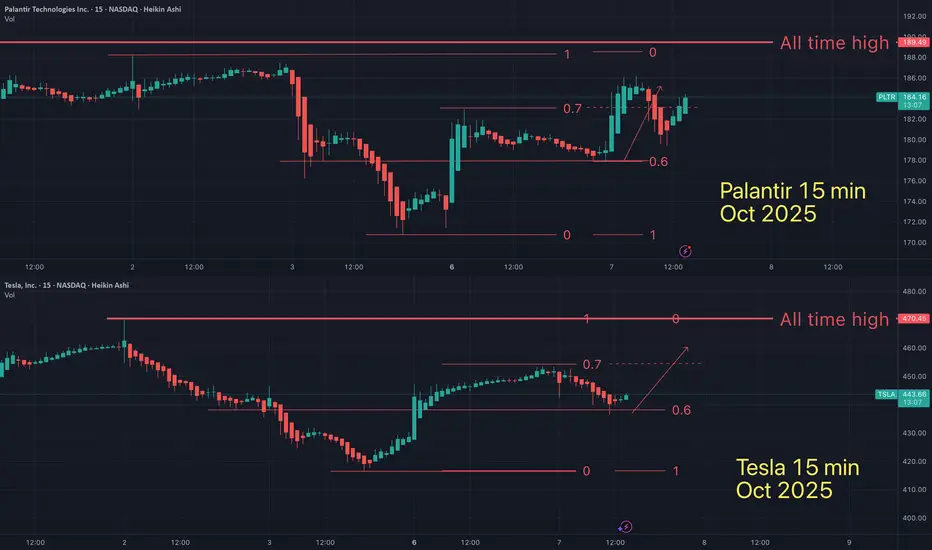
Here is the Palantir / Telsa Fractal on current 15 min timeframeFractals are a mathmatical anomaly, if you understand linear equations (and believe the market is "random"). All assets are doing the same patterns over and over, on all time frames. You just need to see it for what it is.
May the trends be with you.
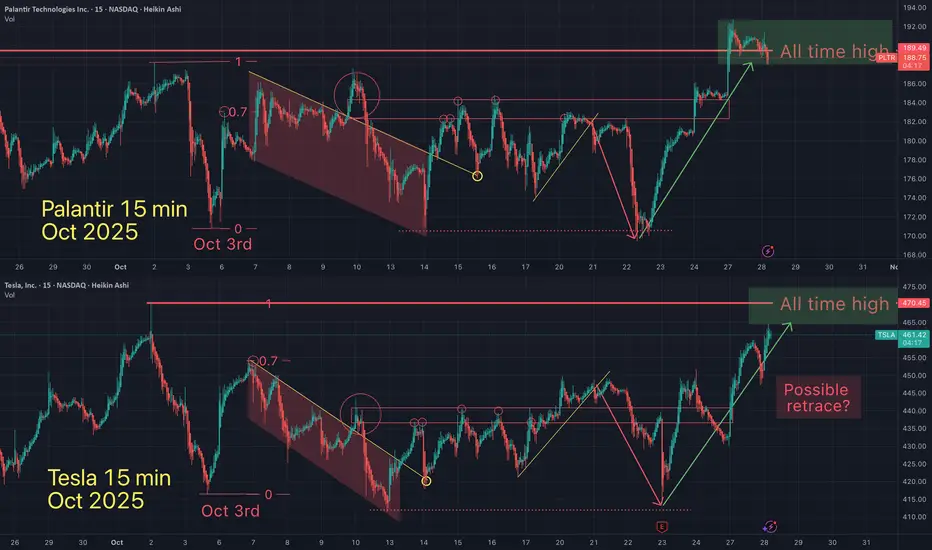
Is this Tesla / Palantir fractal showing both will hit ATH soon?Fractals are a mathmatical anomaly, if you understand linear equations (and believe the market is "random"). All assets are doing the same patterns over and over, on all time frames. You just need to see it for what it is.
May the trends be with you.

Is Palantir (PLTR) Entering a Consolidation Phase? A Technical aTechnical Analysis: Palantir Technologies (PLTR) Amid Overbought Signals and Valuation Gaps
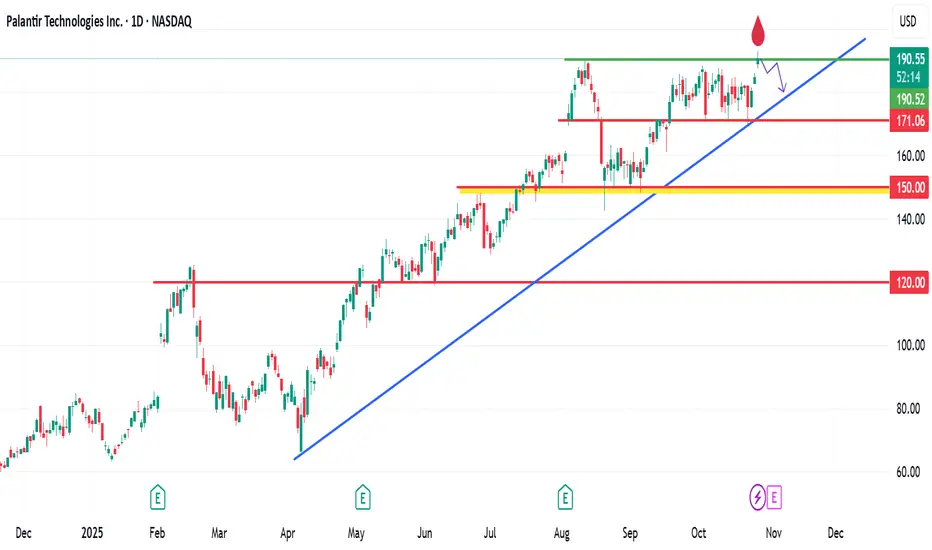
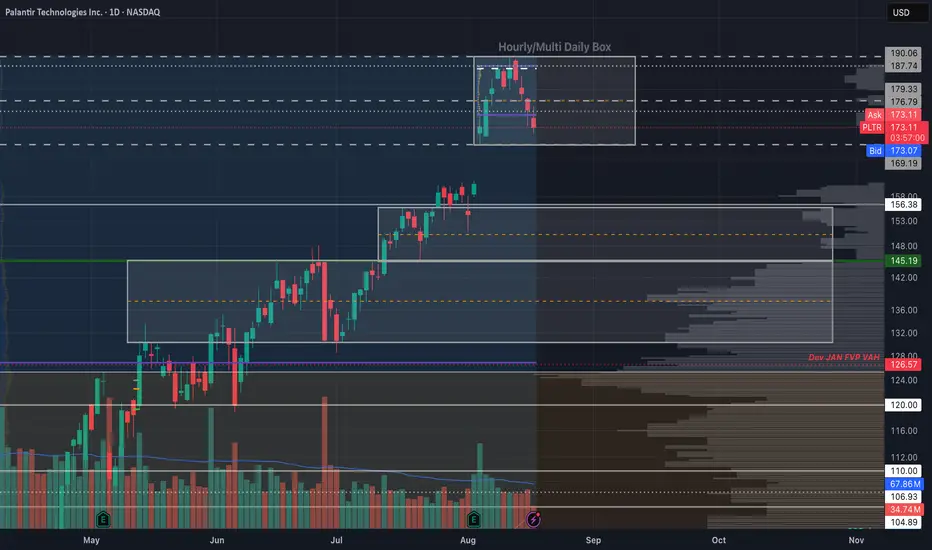
Palantir Technologies Inc. (NASDAQ: PLTR) has experienced significant volatility in recent sessions, reflecting growing uncertainty among investors regarding its valuation and technical positioning. The stock closed at $173.07, down by 7.47%, after testing its resistance area near $186. Both daily and weekly technical indicators are now suggesting that a potential short-term correction could be underway.
Weekly Chart Outlook: Approaching Resistance After a Prolonged Rally
From the weekly timeframe, NASDAQ:PLTR has been trending upward since early April, supported by consistent higher lows and strong momentum in the technology sector. The recent breakout above the $160–$165 zone confirmed bullish sentiment, but the latest candlestick formation shows rejection near $186, indicating profit-taking pressure.
The Stochastic RSI on the weekly chart is hovering in the overbought zone, signaling that the rally may be losing strength. While this does not necessarily imply an immediate reversal, it often precedes a consolidation phase or a short-term pullback. Volume patterns also show a slight decline compared to the early phase of the uptrend, reinforcing the possibility of slowing momentum.
Additionally, the price is now slightly extended from its key moving averages, suggesting that any correction toward the $160–$165 support zone would still maintain the longer-term bullish structure.
Daily Chart Confirmation: Stochastic RSI and MACD Turning Cautious
Read full analysis on my website :
darrismanresearch com

Palantir Money Heist – Breakout vs Pullback, Which Side Wins?💎🔫 PLTR Money Heist Plan – Thief Trader Edition 🚀
🎯 Asset: Palantir Technologies Inc. (PLTR)
🏦 Plan Type: Swing / Day Trade
⚡ Bias: Bullish (Pending Order Strategy)
🗺️ Thief Trader Heist Plan
Entry Zone (Breakout): 🔓 $162.00 ⚡
Pullback Entry: 🎯 $132.00 & above any price
🔔 Set TradingView alarms to catch the breakout easily — no excuses thieves!
Stop Loss (Breakout Entry): 🛑 $148.00
Stop Loss (Pullback Entry): 🛑 $120.00
📝 Stops are my thief levels — adjust based on your own strategy & risk.
Target: 💰 Escape vault before $184.00 – $188.00 resistance (Overbought + Trap Zone)
❓ Why This Plan? (Thief Logic)
Bullish Bias: Strong momentum around AI contracts & government adoption = upside fuel.
Breakout @162: Key resistance level tested multiple times → if broken, doors open for rapid move higher.
Pullback @132: Golden reload zone where buyers previously defended → sniper entry for risk/reward thieves.
Fear & Greed (75/100): Market greed creates volatility → perfect environment for quick thefts.
Macro Boost: AI sector tailwinds + gov contracts = solid catalysts.
Thief Rule: We don’t chase blindly — we wait for breakout confirmation or reload on pullback to maximize stolen pips.
📊 Palantir Stock Data Report (As of Sept 7, 2025)
Prev Close: $156.14
Day Change: -$3.03 (-1.94%)
After-Hours: $152.30 (-0.53%)
52-Week Range: $32.47 – $190.00 🎯
Market Cap: $363.23B 🏦
😱 Fear & Greed Sentiment
Retail Traders: 🟢 Bullish (70% optimism, AI hype + contracts)
Institutions: 🟡 Neutral (Valuation caution + competition risks)
Fear & Greed Score: 🔥 75/100 (Greed = volatility fuel)
💰 Fundamental Breakdown
Revenue (TTM): $3.44B
Net Income (TTM): $763.29M
Profit Margin: 22.18% ✅
P/E Ratio: 493.90 ⚠️ (Ultra high)
P/S Ratio: 112.41 (Overvalued vs peers)
Growth Drivers:
U.S. Commercial Rev ↑93% YoY 🚀
Gov Rev ↑49% YoY 🏛️
🌍 Macro & Market Drivers
🧠 AI Tailwinds: Massive global demand
🏛️ Gov Contracts: Potential expansion
⚔️ Competition: OpenAI + enterprise challengers
📊 Overall Market Score: 60/100 → Mildly Bullish 🐂
🔮 Key Takeaways (Thief Edition)
Short-Term: Expect heavy volatility (perfect for a thief’s quick grab).
Long-Term: Growth path strong but valuation = danger zone.
Watchlist: Q3 earnings (Nov 2025) + Gov contract headlines.
🔎 Related Assets to Watch
NASDAQ:META (AI sector peer)
NASDAQ:MSFT (Gov + AI contracts)
NASDAQ:NVDA (AI chip leader)
NASDAQ:TSLA (Speculative momentum)
AMEX:SPY (Macro market sentiment)
✨ “If you find value in my analysis, a 👍 and 🚀 boost is much appreciated — it helps me share more setups with the community!”
#PLTR #Palantir #AIStocks #SwingTrade #DayTrade #ThiefTrader #MoneyHeistPlan #StockMarket #TradingViewAnalysis

PALANTIR - STOCK REPORT1) Executive summary
Palantir (PLTR) showed very strong revenue growth in 2023–2025 driven by commercial expansion and adoption of its platforms (Gotham, Foundry) across government and private sectors. As of September 2025 the company is clearly profitable on a TTM basis with positive operating margins, strong cash generation (high FCF) and a sizable net cash position. However, relative valuation is extremely high (P/S, EV/Rev, P/E multiples well above peers), reflecting aggressive growth expectations and strong speculative interest.
Main risks: high sensitivity to AI sentiment, reliance on large government contracts and a concentrated commercial customer base, potential regulatory pressure and share-price volatility.
Short recommendation: Hold.
Rationale: financial strength and growth justify exposure, but valuation requires the company to deliver continued high growth and margins; new purchases should wait for a pullback or operational confirmations (stabilized growth rate and guidance). Risk-seeking/high-return investors may consider a partial position.
2) Key data and company overview
Name: Palantir Technologies Inc.
Sector: Software — Data analytics / Enterprise AI
Primary market: NYSE/NASDAQ (Class A) — Ticker: PLTR
Business brief: Software platforms for data integration, analytics and decision‑making (Gotham for governments, Foundry for enterprises, Apollo for deployment). Revenue model: software licenses, SaaS/cloud subscriptions, implementation services and multi‑year government contracts. Main geographies: USA (largest weight, both government and commercial), Europe, expanding APAC.
Market & key metrics (sources: StockAnalysis / MarketBeat / Macrotrends; close price 22‑Sep‑2025):
- Market cap: ~425–433B USD
- Shares outstanding: ~2.365B
- Float: ~2.19B
- P/E (TTM): ~560–595
- EV/EBITDA (TTM): ~700
- Last close (22‑Sep‑2025) used: 179.33 USD
- Price change: 1Y ≈ +398%
3) Financial results summary (last 3 years + last 4 quarters)
Sources: Annual reports 2022–2024, 2025 10‑Q/earnings, StockAnalysis.
TTM / annual rounded (USD millions):
- Revenue (TTM): 2.87B
- Net income (TTM): 462.19 M USD
- Operating income (TTM): 569.55 M
- Diluted EPS (TTM): 0.30
- Free cash flow (TTM): ~1,710
- Operating margin (TTM): 26.83%
- Net margin (TTM): 32.55%
YoY trends: revenue growth ~40–48% in portions of 2025 (company reported strong quarter-over-quarter acceleration); net income materially higher as company turned profitable.
Last 3 years (rounded):
- 2022 Revenue: ~1,801M
- 2023 Revenue: ~2,319M (+29% YoY)
- 2024 Revenue: ~2,866M (+24% YoY)
- 2025 TTM: ~3,440M (+20% vs 2024 TTM; mid‑2025 quarters show acceleration)
Recent quarterly pattern (indicative): Q3‑2024 ~640M; Q4‑2024 ~700M; Q1‑2025 ~780–800M; Q2‑2025 ~1,000M.
Comment: strong commercial acceleration in 2024–H1 2025, especially U.S. commercial; profitable on TTM with high FCF, though EPS/margins affected by stock‑based comp and non‑cash items.
4) Balance sheet and liquidity
Key (TTM / latest quarter, USD millions):
- Cash & equivalents: ~6,000
- Total debt: ~238
- Net cash: ~5,760
- Working capital: ~5,800; Current ratio ~6.3; Quick ratio ~6.19
- Debt/Equity: ~0.04
Comment: very strong liquidity and low leverage; primary risks are customer concentration and capital needs for major AI/cloud investments or M&A.
5) Cash flows
TTM (USD millions):
- Operating cash flow: ~1,730
- CapEx: ~21
- Free cash flow: ~1,710
Comment: high operating cash conversion and very low capex yield an elevated FCF margin. Increased investment in cloud/AI or acquisitions could raise capex and cash use.
6) Valuation
Peers: Snowflake (SNOW), CrowdStrike (CRWD), Splunk (SPLK).
Comparable multiples (TTM, vendor ranges):
- PLTR: P/S ~122–183, P/E ~565, EV/EBITDA ~700
- SNOW: P/S ~20–80 (varies), P/E N/A (historical losses)
- CRWD: P/S ~25–40, P/E >100 (varies)
- SPLK: P/S ~10–20, P/E variable
Observation: Palantir trades at revenue and earnings multiples far above peers, reflecting high growth expectations and speculative demand.
Simple DCF (assumptions stated):
Base revenue TTM = 3,440M.
Growth assumptions: 2026 +30%, Yr2 +15%, Yr3 +10%, Yr4 +6%, Yr5 +5%; terminal growth 3.5%.
EBIT margin converging to 18%; tax 18%; CapEx = 1% of revenue; WACC = 9%. Result: implied fair value per share roughly in the range ~8–25 USD (highly sensitive to assumptions).
Sensitivity: lower WACC / higher terminal growth materially raises value; higher WACC or lower growth materially lowers it.
Detailed year‑by‑year DCF is available on request.
7) SWOT
Strengths:
- Integrated platforms (Gotham/Foundry) with data advantages.
- Strong net cash position and high FCF.
- Rapid commercial AI adoption and high customer retention.
- Strategic government contracts with entry barriers.
Weaknesses:
- Revenue concentration in a few large clients/government.
- High share‑price volatility and valuation disconnect vs peers.
- Dependence on costly AI/R&D talent.
- Historical share dilution.
Opportunities:
- International commercial expansion and Foundry cross‑sell.
- Monetization of advanced AI/cloud offerings.
- Partnerships with hyperscalers.
- Upsell within regulated enterprises.
Threats:
- Regulatory pressure on data/AI use.
- Intensifying competition (Snowflake, Databricks, cloud vendors, AI startups).
- Reputational risks tied to government contracts.
- AI sentiment correction reducing valuation.
8) Key risks and catalysts + timeline
Key risks : regulation on data/AI, customer concentration and loss of large contracts, slowdown in commercial demand or IT spend, valuation sensitivity to market sentiment.
Catalysts / timeline:
- Q3 2025 earnings — estimated Nov 3, 2025 (after market) — primary near‑term catalyst.
- Major government contract announcements or large ARR renewals (timing variable).
- Product/feature releases and cloud partnerships (ongoing).
9) Final recommendation and risk positioning
Operational recommendation: Hold .
Time horizon: medium term (12–24 months) to monitor growth consolidation and margin confirmations.
Risk/return profile: High risk / potentially high reward — elevated valuation creates meaningful downside if growth slows; upside depends on sustaining high growth and margins. Risk‑tolerant investors who believe in Palantir’s AI/commercial momentum may hold or take a partial position with risk controls; risk‑averse investors should avoid new purchases until valuation normalizes.
10) Sources and data date
Main sources: Palantir Investor Relations (SEC 10‑K / 10‑Q / earnings releases), TradingView, public research notes. Data date: 22 September 2025. Assumptions: market cap ~428B; close price 22‑Sep‑2025 = 179.33 USD; shares outstanding = 2.365B.

PLTR to 234Big weekly bullish engulfing candle to end the week after a perfect 0.618 rejection 2 week prior. Upside target is just short of 234, stop is 2 fib levels below. If this one doesn't work out, I will be looking for another entry lower.

Palantir: Approaches Key Resistance Palantir has recently posted strong gains, moving closer to our magenta Target Zone between $171.80 and $184.62, which we’ve identified as the (corrective) top of magenta wave (B). In this range, we expect the stock to reverse course and head lower, continuing the broader correction—making this a favorable area for short positions. Magenta wave (C) is then projected to reach the green Target Zone between $117.42 and $95, completing the green wave . At that point, we anticipate a more substantial corrective rebound in wave . The green zone is therefore well-suited for taking profits on short trades or initiating short- to medium-term long-positions to capture the (temporary) advance of wave . For these long trades, a stop set 1% below the lower boundary of the zone can help manage risk.

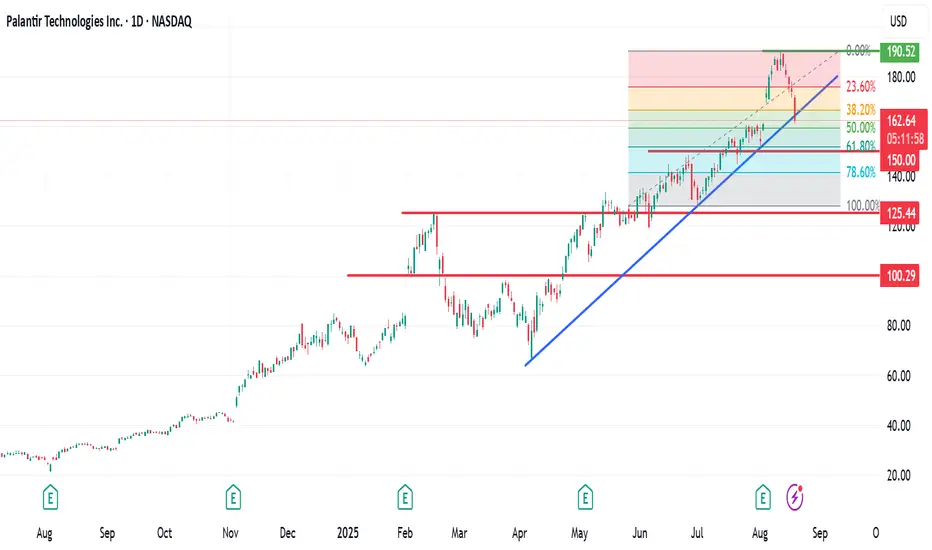
Palantir: Cooling Off After a Strong Bull Run & ATHPalantir: Cooling Off After a Strong Bull Run & ATH.
Palantir has recently taken a breather following an impressive upward rally. The stock surged from the $66 level on April 7th this year to reach a new all-time high of $190.
As expected, no asset moves parabolically upward forever without a retracement.
Over the past week, Palantir has been experiencing a pullback, with today’s session showing a decline of over 6%. The stock is currently trading around $161.
From a technical perspective, I am eyeing two potential entry zones — $160 and $150. Both levels align closely with the Fibonacci 50% and 61.8% retracement areas, making them significant points of interest for a possible rebound.
As always, I take a medium- to long-term approach to my trades, as patience is often the key to capturing real value in strong stocks.
If you found this analysis helpful, please like, comment, share, and connect with me. Let’s continue building a strong TradingView community together.
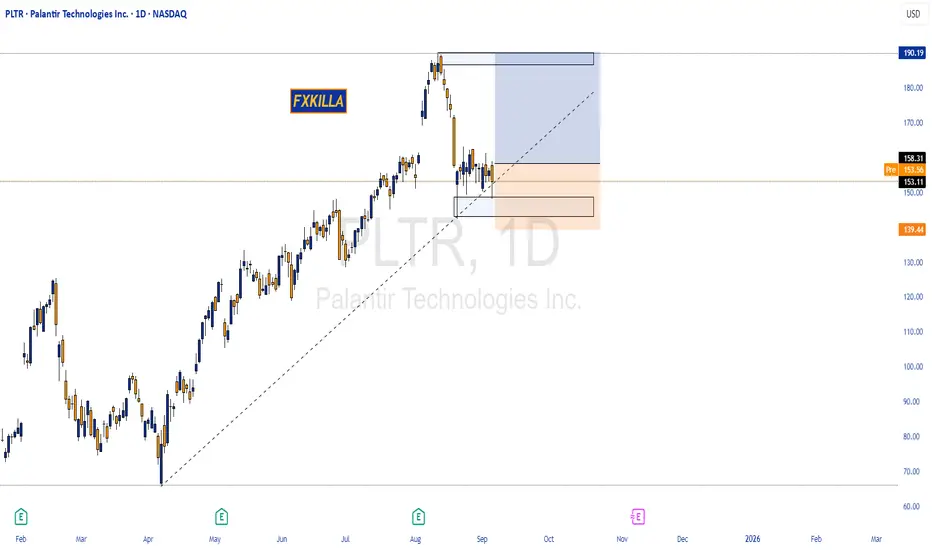
PLTR HIGH PROBABILITY SETUP SOON!!!🚨 PALANTIR HIGH PROBABILITY BUY SETUP 🚨
* Here We Can See Clearly The Next Potential Move For PLTR Coming Hours/Days.
* Keep Your Eyes Close On Your Trading Positions.
* Happy PIP Hunting Traders.
FXKILLA.
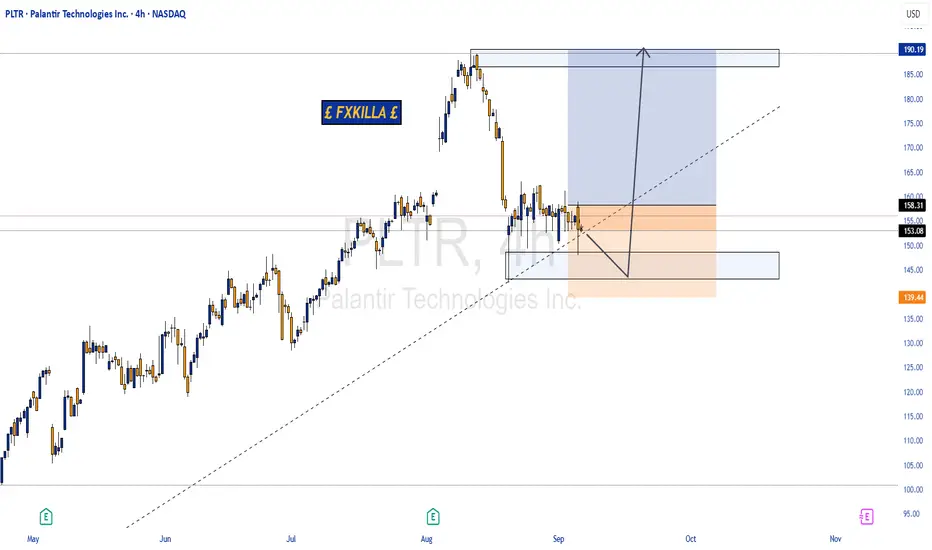
PALANTIR HIGH PROBABILITY SETUP SOON!!!🚨 PLTR HIGH PROBABILITY BUY SETUP 🚨
* Here We Can See The Next Potential Moves For Palantir Coming Hours/Days.
* Keep Your Eyes Close On Your Trading Positions.
* Happy PIP Hunting Traders.
FXKILLA.
For Those Trading PalantirPLTR has greatly accelerated it's growth trend lines. Right now PLTR is almost 3 years ahead of it's main long term trend line. What this means is upside potential is diminishing.
I see a lot of long charts for PLTR and wanted to share that support is actually at $134. So if you're a PLTR trader, looking to buy, that's the best area to do it.
If however you're looking to sell, then $230 is your spot.
I feel like people buying PLTR are playing a bit with fire as the fast gains are likely gone and eventually a return to the long term trend line is likely. I don't see that happening at least until IXCO runs into resistance, so until then $134 is the buy area.
Good luck!

Fannie Mae (FNMA) AnalysisCompany Overview:
Fannie Mae OTC:FNMA , the government-sponsored enterprise (GSE), plays a critical role in supporting the U.S. housing market through mortgage liquidity and stability.
Key Catalysts:
Q2 2025 support: Provided $102B in liquidity, helping 381,000 households—with over 50% being first-time buyers.
Earnings stability: Recurring guaranty fees ensure consistent revenue streams.
Capital strength: Net worth rose to $101.6B, highlighting robust capital buffers.
Tech partnership: New collaboration with Palantir enhances fraud detection & risk management, strengthening long-term earnings protection.
Macro headwinds: Higher mortgage rates and slower home sales remain challenges, but FNMA’s scale & systemic role provide resilience.
Investment Outlook:
Bullish above: $9.20–$9.50
Upside target: $18.00–$19.00, supported by housing liquidity leadership, capital growth, and risk-management innovation.
📢 FNMA — a housing backbone with strong buffers and growth optionality.
#FNMA #HousingMarket #GSE #MortgageFinance #Palantir #Liquidity #Investing

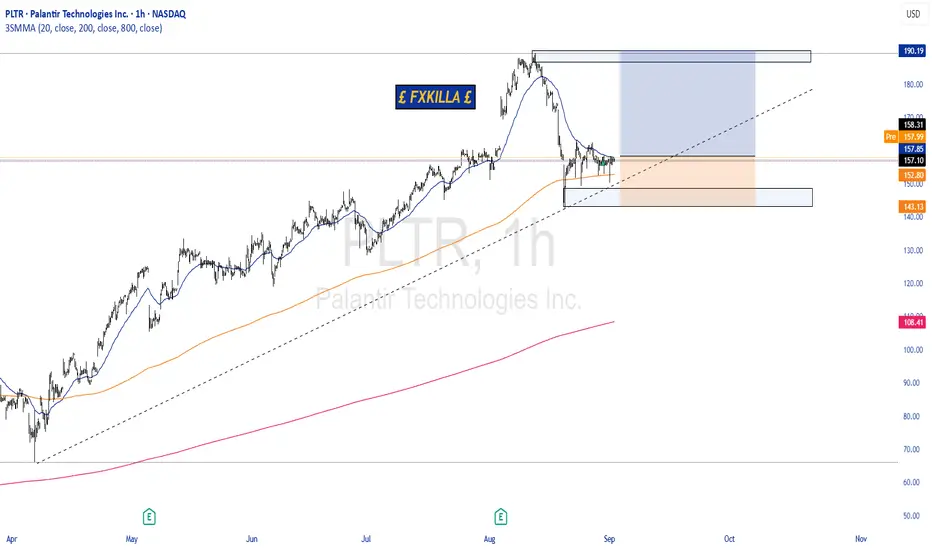
PALANTIR HIGH PROBABILITY BUY SETUP SOON!!🚨 PALANTIR HIGH PROBABILITY BUY SETUP 🚨
* Here We Can See Clearly The Next Potential Move For PLTR Coming Hours/Days.
* Keep Your Eyes Close On Your Trading Positions.
* Happy PIP Hunting Traders.
£ FXKILLA £
Palantir - The unstoppable company!💣Palantir ( NASDAQ:PLTR ) is just too strong:
🔎Analysis summary:
Since mid 2022, Palantir managed to rally more than 2.500%, creating new all time highs every single month. Eventually this rally will slow down, but before this happens, Palantir could rally another +100%. This is a classic example of stock market behaviour and you should take advantage.
📝Levels to watch:
$200
SwingTraderPhil
SwingTrading.Simplified. | Investing.Simplified. | #LONGTERMVISION

PALANTIR is dropping but below the 1D MA50 lies the best BUYLast time we looked at Palantir (PLTR) was almost 4 months ago (May 06, see chart below), giving a buy signal that gradually but surely hit our $185 Target:
This time, the stock has found itself on a short-term pull-back that is about to hits its 1D MA50 (blue trend-line) for the first time since April 21 (4 months). This is far from alarming as the strongest buy signal within its long-term (since February 2023) Channel Up, has been below the 1D MA50.
At the same time, the 3-year RSI Buy Zone (40.00 - 30.00) is also close to being tested, so once it does, we will technically get the most optimal buy confirmation.
Even though another 183% rise from the potential bottom is possible, we will pursue a more modest Target this time, especially as we get close to the end of the year (and potentially the Cycle).
The minimum rise the market has delivered upon a 1D MA50 break has been +58.11%. As a result, our Target will be $220.00.
-------------------------------------------------------------------------------
** Please LIKE 👍, FOLLOW ✅, SHARE 🙌 and COMMENT ✍ if you enjoy this idea! Also share your ideas and charts in the comments section below! This is best way to keep it relevant, support us, keep the content here free and allow the idea to reach as many people as possible. **
-------------------------------------------------------------------------------
💸💸💸💸💸💸
👇 👇 👇 👇 👇 👇

Palantir - The Box Calls The ShotsI recently posted a palatir chart with clean levels of where I'd look to DCA. While those dip-buy levels can easily be used to trade the name, I think it would also help to be mindful of the box ranges as we trade into them. As you'll see, Palantir loves to play with box as much as I do.
If you are familiar with how to trade box set-ups, you can take advantage immediately; otherwise, you may want to do some research on how to trade these.
~The Villain
PLTR 1D — When the tea is brewed and the handle’s in placePalantir’s daily chart is shaping up a textbook cup with handle pattern — one of the most reliable continuation setups in technical analysis. The cup base was formed over several months and transitioned into a consolidation phase, building a rectangle structure where smart money likely accumulated positions before a breakout.
Now here’s the key: price has not only broken out — it’s settled above all major moving averages, including EMA 20/50/100/200 and MA 50/200. The breakout candle was supported by surging volume, signaling strong participation from institutional buyers. When all the averages start bending upwards, it's usually not by accident.
The breakout above the $121 resistance zone unlocked a pathway toward a target at $187 , derived by projecting the height of the cup upward from the breakout level. This kind of structure, once confirmed, often fuels aggressive continuation — and this one’s got the setup locked in.
From a fundamental perspective, Palantir is holding solid ground: strong earnings reports, expanding government and commercial contracts, and aggressive development in AI services. Institutional interest is rising steadily, and that momentum is visibly reflected in price action.
To sum it up: price has launched cleanly out of the consolidation zone, pierced all critical MAs and EMAs, and continues to gain momentum. While the market sips its tea, this cup is boiling hot. Just don’t forget your stop loss — this is a trading desk, not a tea party.
If you enjoy posts like this, drop a like, share it around, and let’s hear your thoughts below. It keeps ideas moving and the content flowing — free, sharp, and relevant.

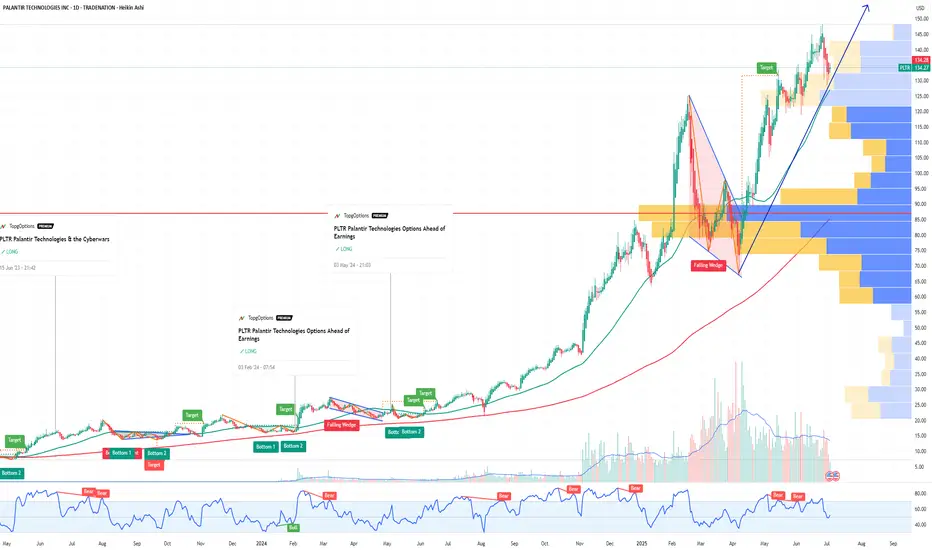
Why Palantir (PLTR) Could Be the NVDA of Government AI If you haven`t bought PLTR before the massive rally:
Palantir Technologies (PLTR) is proving it’s more than just another AI hype play — it’s becoming a core piece of the secure AI infrastructure for governments and large enterprises worldwide.
Key Bullish Arguments
1) Strong Government Moat
PLTR’s deep relationship with the U.S. government, NATO, and allies provides sticky, long-term revenue streams. In an age of geopolitical tension, this is exactly the type of mission-critical AI spending that stays funded.
2) Expanding Commercial Footprint
The commercial segment is no longer a side project. Palantir’s Foundry and Apollo platforms help enterprises deploy AI at scale — securely, in-house, and without sending sensitive data to open systems. Recent deals in healthcare, energy, and critical infrastructure show they’re broadening their customer base.
3) Profitability & Balance Sheet
Palantir is GAAP profitable for six consecutive quarters, with strong free cash flow and zero debt. For a growth stock in AI, this gives it rare staying power if macro conditions tighten.
4) Technical Strength
The stock broke out above ~$125–$130 support and is now testing key resistance in the $140–$148 range. Weekly momentum remains bullish, and institutional accumulation (A/D line) remains strong.
5) AI Tailwinds Remain
While the general AI trade has cooled for some names, PLTR’s unique moat in secure and domain-specific AI makes it more defensible than generic “AI SaaS” stocks. New contracts or AI platform updates could reignite momentum this summer.
Possible Summer Catalysts
New multi-year government deals — especially in defense and cybersecurity.
Major commercial partnerships — especially in healthcare or energy.
AI platform upgrades — more integrations with LLMs or domain-specific AI.
Inclusion in AI-focused ETFs — or further index rebalancing inflows.
Disclosure: I am part of Trade Nation's Influencer program and receive a monthly fee for using their TradingView charts in my analysis.
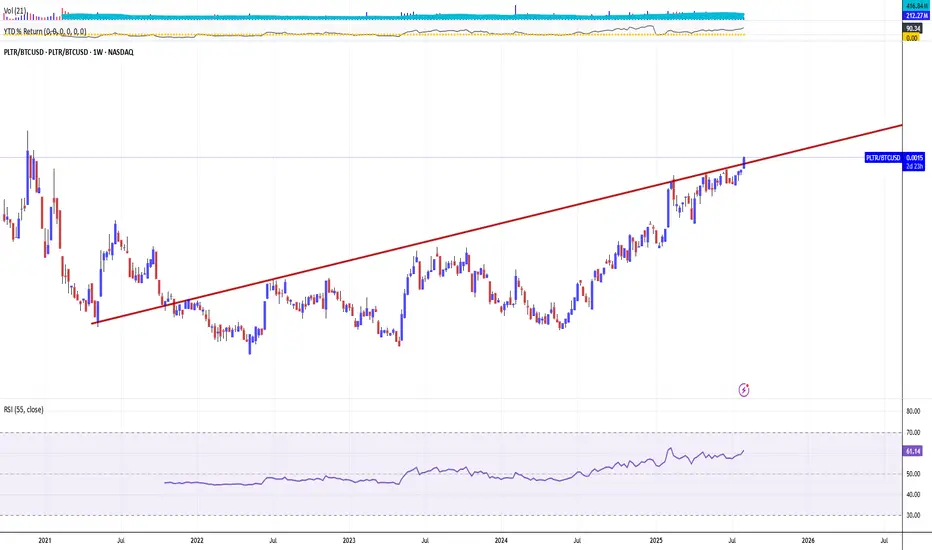
PALANTIR GOES 'BOMBASTIC', DETHRONES JUGGER BITCOIN SUPERIORITYIt's gone less than a year or so since Palantir stock has joined on Friday, September 20, 2024 Stock Top Club, also known as S&P 500 stock index SPX .
Palantir was one of the strongest contenders for inclusion in the broad market S&P500 Index.
This inclusion, as well as Dell (DELL), came after tech companies Super Micro (SMCI) and Crowdstrike (CRWD) also joined the index earlier in the year 2024.
Since that, Palantir stock became the best (i.e. #1) S&P500 index performer the year 2024 and even in nowadays this Jugger remains 'The Best of The Best' over the whole S&P 500 index, with current +127% YTD return in 2025 (and +697% over the past 12 months), being highlighted at 173.29 USD per share - the new all the history peak reached last Wednesday, August 05, 2025 at regular session close.
What is most important also, nor Federal Reserve (The US Central Bank) hawkish projections on monetary policy in 2025, nor bearish were not able to stop the only game in the city, or even make a pause on Palantir leadership.
Since Palantir stock is rallying, the stalkers remain decently far away, swallowing the galactic dust of Palantir shares.
Judge for yourself.
All the nearest pursuers in 2025 are still under 100% YTD return while Bitcoin BITSTAMP:BTCUSD is traded with modest +21% YTD return in 2025.
What is most important also, Palantir stock was able to outperform S&P500 index within 12 (twelve) straight month in a row.
In human words that means, Palantir stock monthly returns (every single month from June 2024 to May 2025) were better against broad market index.
What is Behind this?
On August 4, 2025 Palantir Technologies has announced financial results for the second quarter ended June 30, 2025.
Palantir reported revenue ahead of Wall Street’s expectations in Q2 CY2025, with sales up 48% year on year to $1.00 billion. On top of that, next quarter’s revenue guidance ($1.09 billion at the midpoint) was surprisingly good and 10.5% above what analysts were expecting. Its non-GAAP profit of $0.16 per share was 15.6% above analysts’ consensus estimates.
“The growth rate of our business has accelerated radically, after years of investment on our part and derision by some. The skeptics are admittedly fewer now, having been defanged and bent into a kind of submission. Yet we see no reason to pause, to relent, here.
It has been a steep and upward climb—an ascent that is a reflection of the remarkable confluence of the arrival of language models, the chips necessary to power them, and our software infrastructure, one that allows organizations to tether the power of artificial intelligence to objects and relationships in the real world,” said Alexander C. Karp, Co-Founder and Chief Executive Officer of Palantir Technologies Inc.
Palantir stock Alpha
What is Alpha?
Alpha (a) is a term used in investing to describe an investment's ability to beat (outperform) the market, or its “edge.” Alpha is thus also often referred to as excess return or the abnormal rate of return in relation to a benchmark, or any other asset (even against simple sitting in a cash) when adjusted for risk.
The main graph represents a comparison across Bitcoin and Palantir stocks. Since Palantir outperforms BTC and accelerate right now, so why isn't to continue the play, by staying in a long with Palantir, and finally dethrone "the new oranges" respectively.