PLTR Swing Map: Heikin Reversal + ATR Push + Trend Confirmation*📈 PLTR — Palantir Technologies Inc. | NASDAQ
Swing Trade Profit Playbook (Bullish Edition) 🔥🕶️**
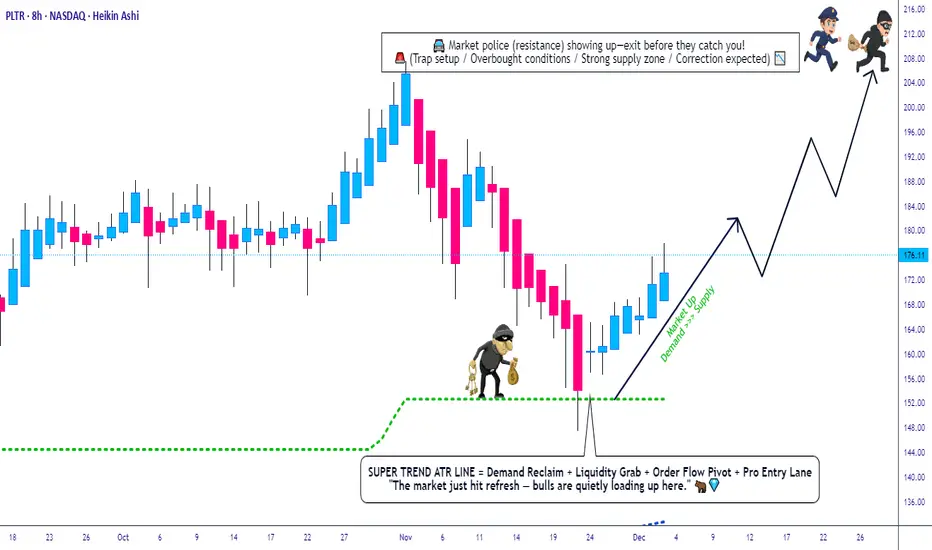
🔍 Trade Thesis (Polished & TradingView-Safe Version)
PLTR is showing a bullish continuation setup, supported by:
✅ SuperTrend Buy Signal confirming upside momentum
✅ ATR expansion showing strong volatility power pushing price upward
✅ Heikin Ashi Doji Reversal confirming short-term exhaustion + shift toward buyers
💡 A clean technical alignment for a bullish swing structure 📊
🎯 Entry Plan (Thief Layer Strategy — TradingView Permitted Version)
Using the Layered Limit Entry Method (a.k.a. “Thief Strategy” — fun nickname only, but fully rule-safe 🙌):
📌 Layered Buy Zones:
Buy Limit @ 150.00
Buy Limit @ 155.00
Buy Limit @ 160.00
Buy Limit @ 165.00
(You may increase layers based on your own plan, risk & liquidity preference.)
This approach helps scale into the position with controlled risk during volatility. 🧩💰
🛑 Stop-Loss (Risk Shield)
SL for this layered structure placed at:
👉 145.00
Note to my respected traders (Thief OG’s 😎):
This SL is NOT a recommendation — adjust based on your personal risk tolerance and account management.
🎯 Target Zone (Resistance + Overbought Region Awareness)
Price faces major resistance ahead + potential overbought traps.
Police (Sellers) are waiting there 🚓… so take profits smartly & exit like a true OG.
👉 Primary Take-Profit Target: 205.00
Note:
TP is NOT a recommendation — set targets based on your strategy and risk profile.
📡 Correlated/Related Markets to Watch
Keep an eye on pairs/stocks that often show AI-tech momentum correlation, macro sensitivity or sentiment overlap with PLTR:
🔗 Related Symbols:
NASDAQ:QQQ — Tracks NASDAQ 100, strongly influences PLTR direction
NASDAQ:NVDA — AI sector leader; strong uptrends often spill over to PLTR
NASDAQ:MSFT — AI + cloud ecosystem correlation
NASDAQ:GOOGL — AI demand + tech-sector flows
NASDAQ:META — Growth-tech sentiment indicator
NYSE:AI (C3.ai) — Direct thematic correlation in AI narrative
AMEX:SPY — Overall market mood, risk-on / risk-off confirmation
📌 Key Correlation Insights:
When QQQ or SPY break upward, PLTR generally strengthens.
AI momentum from NVDA / MSFT earnings or news often boosts PLTR interest.
If tech indexes pull back sharply, PLTR retraces faster due to its volatility profile.
Use these pairs to confirm trend strength, avoid traps, and time layer entries smartly. 🔍✨
📘 Final Notes (Polished for TradingView Compliance)
This trading plan is structured for educational + entertainment purposes, using a fun “Thief Style” theme — but the technical framework is fully professional, rule-compliant, and polished for serious swing traders.
Always manage your own risk, analyze independently, and only trade what aligns with your strategy. 📚⚖️
✨ “If you find value in my analysis, a 👍 and 🚀 boost is much appreciated — it helps me share more setups with the community!”
#PLTR #Palantir #Stocks #SwingTrade #NASDAQ #BullishSetup #TradingView #TechnicalAnalysis #LayersEntry #ATR #SuperTrend #HeikinAshi #RiskManagement #AIStocks #ThiefStrategy #Investing #MarketAnalysis
Palantirtechnology
Palantir: I gotta go 🏃♂️Although the Palantir stock is currently moving downwards, we're expecting the course to climb further North, before corssing the support at $6.44, to reach the turquoise target zone between $15.24 and $17.21 to finish the turquoise wave (iii). Thereupon, we predict a course correction to finish the turquoise wave (iv) before turning the trend back up in order to surpass the resistance line at $14.86. In our alternative scenario, the stock would continue its current movements further downward and drop below the $6.44-mark before heading back up.
P

#PLTR Huge bear trap? 🐻Megaphone in progress📣 + RSI divergenceHi All, my main 3 take-outs from this analysis are the following:
1- Even though the situation seems to be compromised and price seems be heading to 17$, be careful bears, as the price is forming right now a rare megaphone, also called broadening bottom. It basically indicates that the price is charging and volatility is increasing in the perspective of a strong reversal move
2- Please note that there is a strong divergence between price action (lower lows) and RSI (higher lows) and I think it is realistic to expect a reversal soon
3- Keep in mind that we have another static resistence given by the down black trendline that the price will need to retest (and possibly breakout from!). Dec 27th might be a good date to try this breakout...
Not a financial advice, just personal opinion. Do your own due diligence and good luck!
PLong
