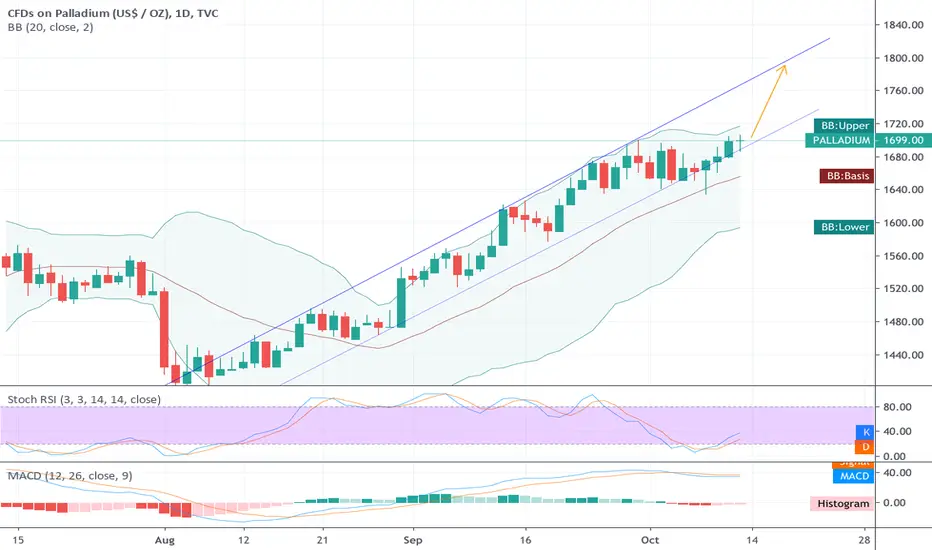
XRP : Palladium trading ideaJust to share my current Palladium trading idea.
In my opinion, Palladium will probably want to test the support before it takes the next big step.
So the right time to buy has not yet come and is likely to be in the second half of November.
Of course, I can be completely wrong. Take care & good luck!
Palladium

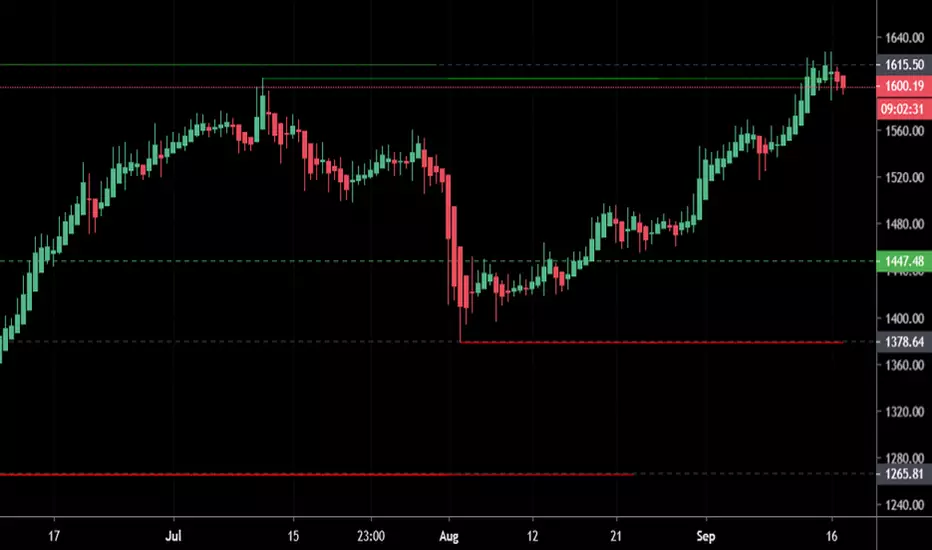
Palladium - CorrectionPalladium has confirmed a break of the uptrend line. To add to this signal, the top of this last move up coincides with the 161.80 fib extension level which could have been used as a profit taking level for longs.
A correction from here down to the 1615-1600 level (previous resistance zone) makes sense and this would be an ideal area to look for longs.
Shorting here is a risky option as it is a counter trend trade however previous corrections have been around 10-20% so a move down to the previous mentioned levels is a realistic scenario. Also there is an acceptable risk/reward ratio of approx. 1.4 if using the previous top as a stop loss level.
This analysis is for my own reference. This is not trading or financial advice.
Price Target 1615
ETA Early Dec

Week 45: Trade 2 - PalladiumA bit of speculation but Palladium is still bullish and going strong. Metals are being moving strong in uncertain times as well as Palldiums impact on auto industry wont slow down this year.
TP 1 -1850
T P2 - 1900
TP 3 - 2025

Short PalladiumI have nothing much to say in these kinds of graphs
With auto industry falling, global economic slowdown (its exaggerated but it is happening for sure), and consumer spending and industrial manufacturing falling, I think palladium might be getting exhausted with this rise.
Palladium is used mainly in 4/3 way catalytic converters along with rhodium.
Yes they are rare metals and found mostly in russia and south africa, but with auto demand falling, i dont see a reason why the demand should not fall
Technical indicator - Overbought
Short palladium 1780
Tp1 1750
Tp2 1710

perfect continuationAs predicted palladium is making new highs and thrashing records. he cupd and handle is way too obvious and this shows its power.
Will be looking at least 2000 in the midterm. Look for a parabolic move that will send this metal sky high. It will determine the end of this rally. Sell ANY parabolic move from here.

IMPALA: A Precious Metals Holder for DecadesImpala is one of the largest Platinum producers in the world, and an extremely cheap stock when one studies their balance sheet.
South African in descent, this company has made some exceptional acquisitions with the latest in North American Palladium (Ticker: PDL; Canadian producer in Thunder Bay, Ontario) which is one of the top producing Palladium mines in the world. Palladium's necessity is expected to increase tremendously in book price over the long term as the world turns to a more "cleaner" form of transportation.
With Platinum still somewhat stagnant, now is the time to invest in IMPALA as once Platinum breaks 1000.00 USD/oz in the next month this stock will take off. Short interest in this company is also decreasing significantly and once they become more extinguished, the price will tick higher drastically.; this company also offers exposure to other metals like Rhodium.
This is one of the most stable stocks on the market.
Moreover, because of their significant acquisitions over the past 5-10 years, this is a stock to hold not just for this upcoming precious metals bull run, but also for ever, as Palladium for example will continue to be "in need" for decades to come for catalytic converters, hydrogen fuel cells and medical equipment.
- zSplit

week 42 - Trade 5: PalladiumStil on uptrend
dancing on uptrend lowline.
entry 1690
tp1 1750
tp2 1800
Palladium shorts positions Monthly chartPalladium after some nice up move end AB=CD and maybe even another CD leg (see at photo)
We gonna short 1 now and short 2 when/if get to the CD leg+ Fibo e level.

Mögliche Korrektur bei Palladium?!Nach dem starken Anstieg des Palladium Preises befindet sich der Markt nun auf dem daily Chart in der Überverkaufzone. Zudem sehen wir eine bearische Divergenz bei MACD und RSI. Wenn der Trendkanal welcher nun seit August anhält gebrochen wird sehe ich hier eine mögliche Korrektur auf ca. 1542 USD. Natürlich sollten wir hier noch auf Bestätigung warten.
Happy traiding!!!
- Wenn das Leben dir eine Kopfnuss gibt, dann sei ein Einhorn! -

XPDUSD (Palladium): Long term action plan. Buy opportunity.Palladium is now on a new Higher High within the 1W Channel Up (RSI = 68.210, MACD = 65.770, Highs/Lows = 97.7642). Based on the similarities with the 2017 Channel Up and with the 1D RSI having reached a peak level (RSI = 66.981) it is natural to assume that a minor pull back is in place (1,600 projection) that will only fuel the uptrend on the long term within the Channel Up. Based on that our Target Zone on a 1 year horizon is 2,200 - 2,400.
** If you like our free content follow our profile (www.tradingview.com) to get more daily ideas. **
Comments and likes are greatly appreciated.

#palladium : target reach 1700 , what next now lol #palladium : target reach 1700 , what next now lol

PDL: The Best Follower of the Palladium BubbleRight now the precious metals are gearing up for a historic run, with Palladium already soaring to record highs.
One of the hardest part when something breaks records is its almost impossible to know where the top is, particularly in this case. Why? With a looming recession, precious metals are bound to soar - and soar parabolically.
PDL has incredible fundamentals with an excellent dividend and has a massive amount of bullish volume. Because Palladium is used mostly in catalytic converters and other forms of manufacturing/biomedical equipment and equipment in general and jeweler, I suspect Palladium will continue to run-up until we get closer to a global recession (which I deem mid to late 2020) before it retraces about 40% from its top peak (whatever it is).
I suspect PDL can get into the 60.00 range at-least over-time and Palladium could shoot into 2200-2400.00 range USD/oz before eventually retracing over-time and consolidating around 1300-1400.
Keep in mind over 70% combined of Palladium mining is in Africa and Russia which provides many of the Palladium miners exceptional fundamentals due to low inherent operating costs. In this case, this miner is of Canadian origin but the technicals, fundamentals and recent quarters (profits) have been stellar.
- zSplit

Palladium Is Leaving Gold In Its DustOften when we talk about commodities, the popular ones that come to mind are Gold and Silver.
They have both performed well in the past. Gold is now looking interesting but has been stuck in consolidation since 2013
and silver is still range bound and requires multiple resistance levels ahead to be cleared before we will consider it.
What good is trading an instrument purely based on its popular name if there is little chance to profit from it?
Unhealthy attachments will kill your performance.
Good trading is about being detached from the name and instead being able to focus on the charts to
determine high-probability environments and setups.
A commodity which is rarely spoken about and performing exceptionally well is Palladium.
This metal is mostly used in catalytic converters for cars but can also be found in jewellery
and dental fillings amongst other uses.
With the way price is moving, you will also find Palladium on the watchlist of and in the trading accounts
of some smart traders and investors.
Why?
Because price is rising, it is that simple!
If we take a glance at the monthly timeframe we can see that price has been in a nice trend
since January 2016 from a low of $454.
Over the past few years, price has steadily been rising under the radar, moving up over
1,100 points which is an increase of over 250%.
On the weekly timeframe, we experienced a strong trend from August 2018 at $833 to March 2019 at $1,615.
This trend moved up by over 90% but came to a sudden halt in March 2019 where price pulled back
and then moved into consolidation.
The chart we can see is for the daily timeframe and we have highlighted the cup & handle chart pattern.
In an uptrend, a cup & handle is a strong trend continuation pattern of the bull trend. Now that price has
broken and closed above the high of this chart pattern, it confirms to us that the chart pattern has
completed which is the first indication that we are likely to see the next leg up.
Ideally, what we now need to happen is for price to pull back and retest the support, which was previous resistance.
If the support level holds, we then need to see the buyers push price back up and break above a previous high as illustrated.
This will confirm a continuation of the overall uptrend and we may see a strong trend to the upside.
By applying patience and waiting for a pullback, retest of resistance-turned-support, followed by
another breakout we drastically reduce the chances of getting caught in a potential head-fake
which can happen after a lengthy period of consolidation.
Applying patience is a key trait to a good trader as this will help us avoid an unnecessary loss
if a head-fake does materialise on this initial breakout from consolidation.
The daily 50sma is above the 200sma which indicates that we are indeed in an uptrend.
Both the 20sma and The 50sma are likely to be used as support if a trend emerges which will
help us with stop placement and exit management when our trading plan is met and we start placing long trades.

Short Palladium @ 1,673; TP @ 1,589, SL your choiceShort Palladium @ 1,673; TP @ 1,589, SL your choice

PalladiumTop is insight imo. Break above golden ratio, whenever it comes, will see price peak around 2200.
Btw I'm not trading this stuff.
/* DEFINITIVELY NOT TRADING ADVICE */

Good trendThis looks a little over extended but has had a nice bull run that maybe can still be of use.


palladium staging a breakoutgoing to make a run at 1700 which I think it will easily surpass. Will be gold for palladium mining stocks like PDL

expecting continuationThis has been a very good stock for a while now. Especially with the new dividend and solid fundamentals. This is a stock to take advantage of the palladium bubble happening right now.


Is Market ready for that SHORT?Posted some days ago that palladium may be ready to drop.
It is my opinion that we are indeed ready and a drop may have kicked in.
For observational purposes, trade at your own risk...
Check linked ideas for previous post on palladium.
Palladium Cup & Handle PatternLast post: See link below.
Review: Price was in a period of consolidation.
Update: Price has formed a cup & handle pattern in an uptrend which is a strong continuation pattern.
Conclusion: If we see a break and close of the all-time high then we should see another strong bullish trend emerge.
Any comments or questions, do not hesitate to leave them below. Give us the thumbs up if you share our sentiments!
Sublime Trading

PALLADIUM TREND WATCH (Visual)Market may be near reversing trend in my opinion.
Will keep an eye for when reversal has been confirmed & in action.
May take some time, so patience is key here as we may still see more upside beforehand.
Hence this is one market to watch closely for near future sell opportunity.
For observational purposes only, trade at your own risk.
Better view ...
