XPD/USD: CAN THE LSMA HOLD THE TREND?💎 XPD/USD | Palladium "The Silver-White Bull" – Market Blueprint 🚀
Asset: XPD/USD (Palladium Spot / US Dollar)
Trade Type: Day / Swing Trade 📈
Vibe: Professional Technical Analysis meets "Thief" Strategy Precision ⚔️
📊 The Game Plan: Bullish LSMA Pullback
We are tracking a high-conviction Bullish Continuation. The price has shown incredible resilience, staying near 4-week highs around $1,977 - $1,980. Our primary trigger is the LSMA (Least Squares Moving Average). We are looking for a tactical pullback to the LSMA line to confirm the next leg up.
The "Thief" is not a gambler—the Thief is a hunter. We don’t chase green candles; we wait for the price to come to our levels. 🏹
🏹 Entry Strategy: The "Thief" Layering Method
Instead of one "All-In" entry, we use Multiple Buy Limit Layers. This improves our average entry price and protects us against market noise.
Layering Zone (Buy Limits):
Layer 1: $1,980 (Immediate Momentum)
Layer 2: $1,950 (Support Re-test)
Layer 3: $1,930 (LSMA Sweet Spot)
Layer 4: $1,900 (Psychological Floor)
💡 Thief Tip: You can increase your limit layers based on your own capital. The goal is to "steal" the best average price as the market dips!
🎯 Targets & Risk Management
Main Target (Take Profit): $2,100 🏁
Analysis: There is a major resistance cluster + potential "Trap" zones near $2,100. Don't be greedy. Escape with the loot when we hit the target!
Stop Loss (Thief SL): $1,850 🛡️
Invalidation: If the price closes below $1,850, the bullish structure is broken.
⚠️ Note to the Crew (Thief OGs): I am not your financial advisor. Setting these specific TP and SL levels is my plan. It is your choice to follow or adjust. You make the money, you take the risk. 🤝
🌍 Fundamental & Economic Feed (Live Context)
Supply Scarcity: 🇷🇺 Russia and 🇿🇦 South Africa (80% of global supply) face ongoing export tensions. Supply deficits are projected to widen in 2026.
Geopolitical Chaos: President Trump’s recent moves regarding Greenland and European tariffs have triggered a flight to "Hard Assets."
Fed Factor: Uncertainty surrounding the new Fed Chair selection and central bank autonomy is weighing on the USD, making metals like XPD more attractive. 📉
Industrial Demand: 🇨🇳 China's industrial production rose 5.2%, signaling massive demand for catalytic converters and high-tech electronics.
⛓️ Correlations & Related Pairs to Watch
Keep these on your secondary screen to confirm the trend:
$XAU/USD (Gold): Currently hitting record highs near $4,700-$4,800. If Gold stays strong, XPD usually follows.
$XAG/USD (Silver): The "Volatile Cousin." Silver has torn through $93/oz. High Silver volatility often leads to "catch-up" rallies in Palladium.
$XPT/USD (Platinum): Closely correlated. If Platinum breaks its resistance, it clears the path for XPD to fly. ✈️
TVC:DXY (US Dollar Index): Inverse Correlation. Watch for DXY weakness. A falling Dollar is the fuel for our $2,100 target. ⛽
Hit the 👍 LIKE button if you’re riding with the Thief OGs today! Drop a comment below: Are you layering in or waiting for a breakout? 👇
#Palladium #XPDUSD #Commodities #TradingStrategy #TechnicalAnalysis #ThiefStrategy #PreciousMetals
Palladiumfutures

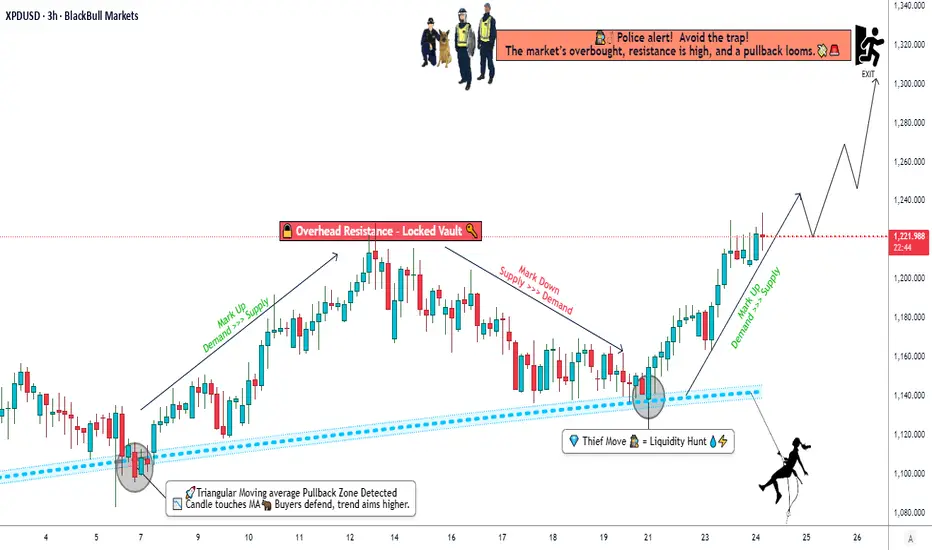
Palladium Market Roadmap | Bullish Case vs Overbought Resistance💎 XPD/USD | Palladium vs U.S Dollar – Market Wealth Strategy Map (Swing/Day Trade)
📊 Plan:
Bullish confirmation looks solid here — backed by Triangular Moving Average pullback + retest ✅ and a Double Bottom formation 🥂 which adds strength to buyers’ side.
I’m laying out my Thief Strategy (Layering Style Entry Method):
Entry is not fixed at a single point 🎯 — instead, I prefer layering multiple limit orders to build positions gradually.
👉 Example Buy Limit Layers:
1180
1190
1200
1220
(You can increase or adjust layers based on your own conviction.)
🛡️ Stop Loss (SL):
📍 My reference SL: 1150
(Note: I’m not recommending you only follow my SL. Always set risk at your comfort level. Manage wisely!)
🎯 Target (TP):
⚠️ “Police barricade” 🚔 acts as strong resistance + overbought conditions → possible bull trap.
My target zone: 1320
(Again, this is just my style. Take profits when it suits your strategy — protect your gains!)
🔗 Related Pairs to Watch:
OANDA:XPTUSD (Platinum vs USD) → Often moves with Palladium due to industrial/auto demand links 🚗
OANDA:XAUUSD (Gold vs USD) → Precious metals correlation, safe-haven appeal 🏆
OANDA:XAGUSD (Silver vs USD) → Volatility cousin, tends to echo similar swings ⚡
PEPPERSTONE:USDX (Dollar Index) → Strong USD can weigh on metals overall 💵
Key Correlation Insight:
Palladium is more industrial-demand driven compared to gold/silver. When auto-sector demand spikes, palladium shines 🌟, but when USD strengthens or risk-off flows dominate, metals may face pressure.
✨ “If you find value in my analysis, a 👍 and 🚀 boost is much appreciated — it helps me share more setups with the community!”
⚠️ Disclaimer:
This is a Thief Style Trading Strategy created for educational + fun purposes only. Not financial advice. Trade at your own risk.
#Palladium #XPDUSD #MetalsTrading #SwingTrade #DayTrade #ThiefStrategy #LayeringStrategy #MarketAnalysis #PreciousMetals
Palladium: Early Bird? 🐦Primarily, we expect Palladium to move downwards once more to dive into the yellow zone between $1176 and $1088. There, it should finish wave v in green as well as wave (b) in blue before taking off in the direction of $1577. However, there is a high 48% chance of the metal being an early bird. In that case, Palladium would have already concluded wave Alt.v in green and would thus directly start the ascent, skipping the yellow zone.

Palladium Futures (PA1!), H1 Potential for Bearish MomentumType : Bearish Momentum
Resistance : 1989.0
Pivot: 1954.5
Support : 1887.5
Preferred Case: On the H1, price is moving below the ichimoku cloud and along the descending trendline which supports our bearish bias that price will drop from our pivot at 1954.5 in line with the swing high resistance to the 1st support at 1887.5 in line with the swing low support, 127.2% fibonnaci extension and 100% fibonacci projection .
Alternative scenario: Alternatively, price may break through pivot structure and rise to the 1st resistance level at 1989.0 in line with the overlap resistance and 61.8% fibonacci projection.
Fundamentals: Due to increasing inflation rates in the US,UK and other developed economies, we have a bullish view on the precious metal.

Formation of twin roof pattern and price correctionForm a twin roof pattern and modify it to the points specified in the diagram

PALLADIUM AnalysisAn idea suggesting bull continuation for palladium
Price can be seen to be sitting right on 4.618 of a trend that was drawn within the bull structure
This is a possible recovery point
It also aligns nicely when a trendline is drawn across the top of the two circles, providing a possible target
The green lines are strong support areas if the bull idea does not come to fruition

Palladium USD profitable Strategy (Study)I'm showing you how my very profitable Palladium USD strategy worked out very well :)
Check out how this system nailed the perfect entry for XAU USD ( Gold ). Press play to check this Ground-breaking result!
*Richimoku ( Advanced Ichimoku Kinko Hyo with 4 Clouds! )
*Kumo Waves (Indentify divergences, trends, investor sentiment.
Know First. Act Faster. A must-have for every trader!)
*As some indicators you may come across are using the repainting mode (which consists in correcting the false signal back in time).
You'll never see such thing in the Richimoku Trading System. What's on the charts is displayed in real time, no cheating...
Send me a Message and Feel Free to test the Richimoku Trading System! I'll send you an invite. Study the chart history on all timeframes. Study all details incl. divergences etc. You'll love it :)
FAQ.
How to access the Richimoku Trading System in tradingview?
To access your indicator simply click on “Indicators” at the top of your Chart, and click on “Invite-Only Scripts”. Click on the indicator to activate it. That’s it!
Will the Richimoku Indicator Trading System work for Stock and Index trading?
Sure! It works on all Forex, Stocks, Indexes, Metals and Crypto's!
Does this indicator work with a free TradingView Account?
Yes you can use the Richimoku Indicator Trading System with a free TradingView account.

Trading plan for PALLADIUM - Short Strategy – PA1The market goes back down but a major resistance could limit the fall.
And don ‘t forget to take your profits…

Trading plan for Palladium - Short Strategy – PA1Zone Sell : 1912.2
Target : 1895
And don't forget to take your profits...

PALLADIUM FUTURES (PA1!) DailyDates in the future with the greatest probability for a rice high or price low

PALLADIUM FUTURES (PA1!) WeeklyDates in the future with the greatest probability for a price high or price low

Palladium BullflagPalladium has formed a bullflag on the 4H chart, this is looking to extend the current bull run that has produced large returns.

Calling Tops In a Bullish MarketAs a rule of thumb you shouldn't call tops or bottoms, react to change. However ima give it my best shot for fun. A bullish divergence can be seen for Palladium on the RSI, which has lead to a large bull run comparable to the initial bull run seen, will this come crashing down like the fractal predicts? I'm no Nostradamus but it would make a hell of a trendline. Return to the mean channel is likely, eventually.

Palladium Near Trend ResistancePalladium has made a strong bullish move in recent months. This may be due to global uncertainty. Palladium is near the top of the rising trend that has formed.


$PALL - Time to Take Some Money off the Table?Palladium has had a fantastic run for 2019 so far, primarily driven by declining global supplies mixed in with rising global demand. In fact, as a result of this trend, the metal has been up 24% so far year-to-date.
However, despite this the stellar trend, recent price action has shown that the rally may be running out of steam. As can be seen, though the price has risen to a 2019 high of $151.35, its technical indicators have failed to follow suit. The SMI and RSI are currently showing negative divergence with $PALL price, as it appears that momentum is coming out of this rally.
As a result, though we think the palladium supply shortage will continue, the $PALL rally is looking a little stretched at the moment. Thus for investors who are currently in $PALL, we would recommend to take some money off the table, while those looking to jump in should wait for a pullback.

Yes I'm Insane Going to short one of the most bullish charts I have seen recently. I think we're going to get a double top on a way overbought over hyped metal, this should be a really nice trade, we will see.

PALLADIUM FUTURES MARCH 2019 (PAH19) Palladium futures are moving in an ascending channel, making higher highs and higher lows. It should be safer to only place buys, as sells may be short lived. However, feel free to play the tennis game inside this channel.
This should be an easy one. Do remember that metals are quite expensive to trade so go easy on the lot size if you have a small account so that you do not get a margin call from your broker.
