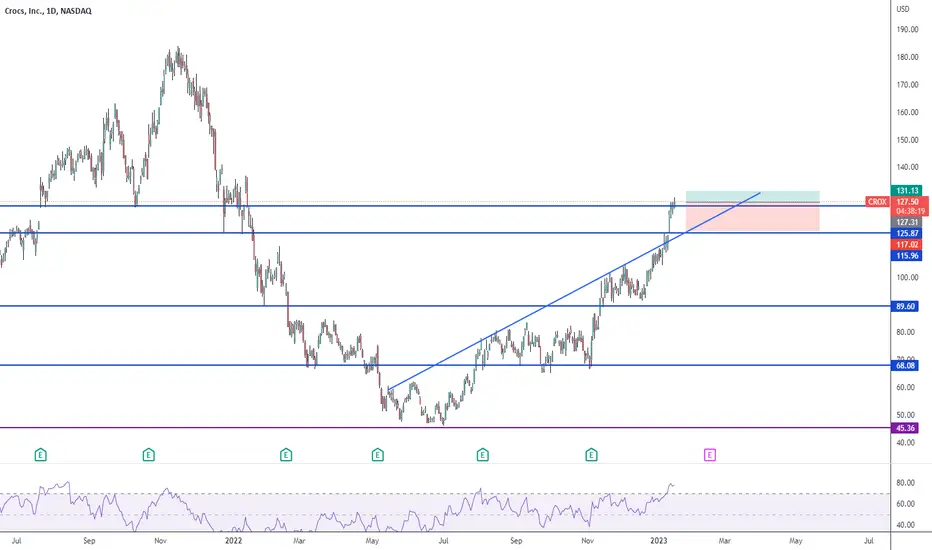
It needs a correctionIs super over extended. It can go down very fast. It just opened a short position.
Parabolicmove
$CRYPTO Total Market Cap - 3.6T LoadingCat calling $3.6T Total Crypto Market Cap 2023. Parabolic blow off 1st-2nd QT of 2023, followed by an equally impressive crash in all markets.

$DXY Projection until 2024!We all Know we are in a bad situation, so many crisis in this situation, we all facing a inflation, jobless, crisis energy and many more. We are just hope with monetary policy in each country. Dollar Domination will svck the all any fiat. FED interst will increase this year with a target of 3.75-4%. And What FED will do ? keep update on economic macro in this situation. this is my outlook. You can sharing you're outlook to in comment section ! i really appreciate it if you sharing with me :) Love u guys cheers ! stay safe

UBX ( NASDAQ BIOTECH PENNY) crushes earnings and news catalystNASDAQ:UBX
and rises over 100 % in premarket, Has a new product
for macular degeneration, a widespread medical problem
affecting vision in the elderly which is increasing
in incidence. The earning beat was significant.
Chart demonstrates the uptrend and midrange
RSI but does not show today's premarket.
40 % rise in the week leading up to earnings and now parabolic.
doubling overnight.
* Get in the party now, don't be late. If you are
late stay home"
( not a recommendation to buy only education)

Parabolic Setup on the Mining JuniorsThis is a very asymmetric trade setup with nearly blue skies to 100 if it can catch some momentum in the coming sessions.
We also have a nice little fractal that shows us the path upward, should we break 49.
I would not front-run this one and would wait for 50+ daily close before a serious entry. With this level of confirmation in pocket, I'll be taking a rather aggressive stance.
Its a clear magnet-move to 100 - if for no other reason than it being one of the only decent plays available.
=PigMagnet
AMEX:GDXJ
TVC:GOLD
TVC:SILVER
MCX:GOLD1!
MCX:SILVER1!
ASX:GOLD
AMEX:GDX
NYSE:GOLD

Parabolic PauseThese are runs for Mastercard and Microsoft
Both of them are massive parabolas
During times of intense bull markets, price has to pull back occasionally and this is what we get.
These pause are often sharp/rounded and quick down moves followed by a quick reversal
It is very surprising how far these parabolic structures can grow
Monthly and Weekly timeframe respectively

Daily Short Parabolic Stock Ideas for my followers!! Follow Me I decided to start this new format to take advantage of short opportunities that arise when a week stock has gone parabolic.
I have some criteria to sift through opportunities and choose the best:
1) The company is relatively unknown (normally belongs to the OTC market) and financially weak (medical companies normally satisfy these criteria)
2) The company has been on a long downtrend
3) The company has made a large move to the upside (greater or equal to 15%; NEVER SPECULATE ON A COMPANY THAT HAS RISEN LESS THAN THAT IN FIRST DAY OF EXPLOSION). Also consider that the green explosion has to be from a relatively full green candle.
4) Before the upside movement, the chart should have formed a falling wedge (which it has broken after the first great upward movement)
5) After several days, an inversion pattern should form (most usually a double top) and that pattern can be used to short the stock according to standard rules
Short stocks to keep an eye on for short opportunities:
1) KALA
2) KAVL
3) COE
4) LBPS

This is happen 🐻📉📈🐂😎I am always bullish in bitcoin because of this 🚀🤙....you just accumulate more & more & you always become's super rich ...so don't panic if btc crash 90% it's just crash 😌🔻not end ! ... 10000% I am sure btc take parabolic after this is happen 💥🤛 so get ready ( & follow for more 🤝 )

SANDUSDT next leg of parabolic move up?Can SAND continue it's parabolic run?
With monster gains since October we can break the movements of SAND down into 2 cycles of 3 phases - and if history repeats (or rhymes) it would lead us up, up and away.
This one's just for fun but anything is possible in a parabolic move up like this, often a sharp move down is just the buying pressure taking a breather before resuming.
This is not financial advice, you're responsible for your own trading decisions.
Leave a like and follow for more!

CTXC ready parabolic move?CtXc the and only decentralized blockchain platform that supports Artificial Intelligence (AI) models to be uploaded and executed on the distributed network

What Happens at the Top of a Parabolic MoveA comparison between Bank of America and BTC
Both experience similar price action (BTC is log, BAC is normal chart)
Yet you can see on both the action at the top of the bull move
A peak is attained and then quickly rejected from

TESLA - Steadily declining volume in the rally (NOT a good sign)Among my friends and acquaintances, I have been known as a Tesla perma-bull for years. So far, this has been quite a comfortable position. Today, however, I noticed something in Tesla's macro chart that has me a bit worried. On the one hand, my Parabolic Exhaustion Indicator hit the alarm at the high in both the Daily and Weekly. This alone indicates with increased probability at least a temporary correction. But what I consider more dangerous is that the rally since March 2020 (70 USD to over 1200 USD) has taken place under steadily declining volume. As early as the 19th century, Charles Dow established the theorem in his Dow Theory that a trend should be confirmed by rising volume.
I will not switch from the bull to the bear camp now - I personally would not short Tesla. However, I am now much more cautious with new positions in the stock. The danger of a selling cascade is given.
What also makes me question the sustainability of further rising prices, is the absolutely no more increaseable hype around Tesla and Elon Musk in the social media. Who is still buying? Are not ALL long Tesla already? Many with a larger position size than they should? Tesla stock is highly emotional, and that in itself already carries an increased risk for high volatility.
At least something to think about, despite all the bright visions of EVs, autonomous driving, robo taxis, turning the energy market around, etc. and the fantastic execution.

TRON probably started its parabolic really Now!!Technical analysis: #TRON (Daily update)
* TRXUSDT is already BREAKOUT the downtrend and retested is also done, the beginning of an uptrend is expected from here.
*The price is trading ABOVE both MA's (50- MA and 21 MA) as well as trend line ,
* LOOK too bullish when ever its trade above the both MA's as well as downtrend but need to break the rising wage pattern to take parabolic raid.
* RSI above the 53 that's means bulls are upper hand and already breakout its resistance, it will take momentum from here..
Take Profits,
TP1= @ $0.18124
TP2= @ $0.24563
TP3= @ $0.39360
TP4= @ $0.52585
TP5= @ $0.60689
next to the moon lol
SL=close BELOW $0.082 on daily bases.
🥰If you find this helpful and want more FREE forecasts in Tradingview😍.
Please show your support back🙏,
Hit the 👍 LIKE button,
Drop some feedback below in the comment✍️!
❤️🤝 Your Support is very much 🙏 appreciated!❤️🤝
💎 Want me to help you become a better Crypto trader?
Now, It's your turn!
Be sure to leave a comment; let me know how you see this opportunity and forecast.
Trade well, 💪
#TRON #CRYPTO #BULLISHRUN #ALTCOIN #UPTREND

LTC parabolic trend formingLTC waiting for breakout in parabolic trend lines
🟢 Parabolic trend movement
🟢 Resting on parabolic
🟢 Inverse Head and Shoulder
🟡 Wait till it retest

Jupiter Possible 400% to ATHJust some basic T.A. I'm no expert but using fib retracment from the may bull run gave me this possible 400% back to ath. I personally think with everything $Jup is doing this is going to blow past ath then were in for real fun.
Let me know your thoughts!

Remember one's again 💯⚡ Seriously !Remember one's again 💯⚡
Seriously !
BTC parabolic move coming soon 🎆💥
So get ready for that 😌🔥.

LUNA HUGE PARABOLIC MOVE IDEA!LUNA is such a great project and has such a good ecosystem with mass adoption.
Based on the LUNA CHANNEL and EXPONENTIAL growth it could reach $600-900 with a blow off top at 2.272.
Any project with network affect has huge growth potential and I believe this is so undervalued.
NFA!

BCH ready to blast, probably parabolic really coming soon!! Technical analysis: #BitcoinCash (Daily update)
. Symmetrical Triangle Upside Breakout ✅
. BTCUSDT is breakout confirmation done as well as trading above the both MA's (21 & 50-
Day MA), and the beginning of parabolic uptrend is expected.
. The RSI is also TRYING to breakout its downtrend, if it could happen which give momentum bch from here.
. Golden cross could happen very soon that's means bulls are in full control the market.
Take Profits:
TP1= @ $809.5
TP2= @ $1176.4
TP3= @ $1649.6
TP4= @ $2282 and then it could really more then $5000
SL= below 500 usdt on daily closed bases
🥰If you find this helpful and want more FREE forecasts in Tradingview😍.
Please show your support back🙏,
Hit the 👍 LIKE button,
Drop some feedback below in the comment✍️!
❤️🤝 Your Support is very much 🙏 appreciated!❤️🤝
💎 Want me to help you become a better Crypto trader?
Now, It's your turn!
Be sure to leave a comment; let me know how you see this opportunity and forecast.
Trade well, 💪
#bitcoincash #crypto #nextmove #bullmarket #dailyclosed

lets see how far SHIB can putup the show of power...SHIB looking strong after months of consolidation. RSI overbought but hey! SHIB IS SHIB RIGHT!
Lets see if we can re-taste ATH,sall we.

Solana just has a gorgeous chart Nothing fancy, sometimes you get beautiful charts on interesting tangible technology. I believe a third parabolic move should take the coin above $300 this year.

Parabolic movements usually end up where they started."The four most dangerous words in investing are; This time it's different" - Sir John Templeton

XMRUSDT wants to retest the 0.618 Fibonacci level 🦐XMRUSDT wants to retest the 0.618 Fibonacci level. Now the price is testing the parabolic trendline. According to Plancton's strategy (check our Academy), we can set a nice order
–––––
Follow the Shrimp 🦐
Keep in mind.
🟣 Purple structure -> Monthly structure.
🔴 Red structure -> Weekly structure.
🔵 Blue structure -> Daily structure.
🟡 Yellow structure -> 4h structure.
⚫️ Black structure -> <4h structure.
Here is the Plancton0618 technical analysis, please comment below if you have any question.
The ENTRY in the market will be taken only if the condition of the Plancton0618 strategy will trigger.

BTCUSDT Parabolic bear trendNot every trend must be lineal, do you remember parabolics from highschool? this chart is interesting to save and check in the future.
