PARTI price analysis🎉 Looks like someone decided to throw a real "#partі" on the OKX:PARTIUSDT chart!
Strong move up, boosted by rising volume — but as always, there are a couple of “BUTs”… 😅
⚠️ 1. Price has slammed straight into the trendline
Nice pump, but the market loves to test patience.
⚠️ 2. Even if the trendline breaks above, the price will enter the liquidity zone at $0.16–0.20
That’s where a huge batch of longs was opened earlier — and many of them will likely sell “at breakeven,” creating extra resistance.
📊 #ParticleNetwork ’s market cap is only around $30M right now.
So the big question is: does it still make sense to keep holding — or is it safer to secure profits now? 🤔
❓ Do you think #Parti has enough strength to push through the trendline and the liquidity wall — or will sellers crush the momentum?
______________
◆ Follow us ❤️ for daily crypto insights & updates!
🚀 Don’t miss out on important market moves
🧠 DYOR | This is not financial advice, just thinking out loud
Parti

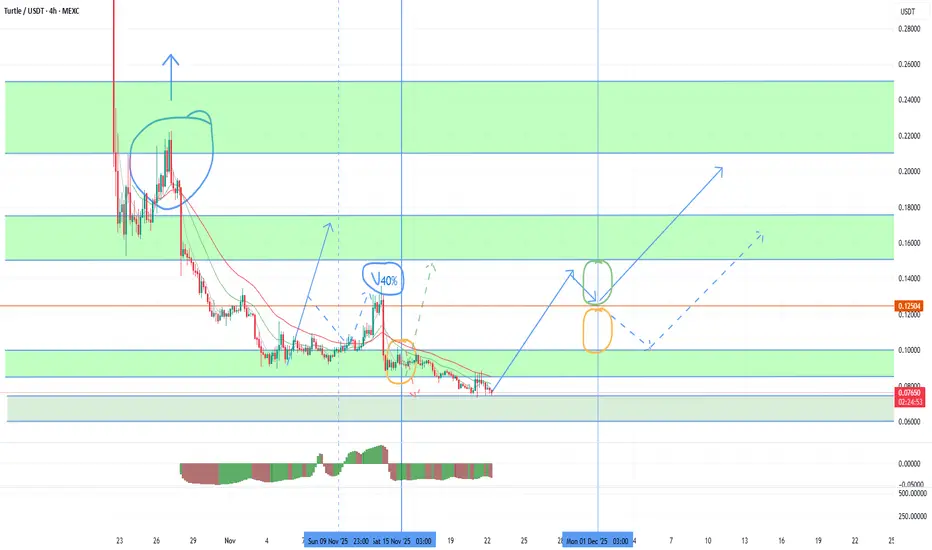
A new wave of growth up to 200%+ for TURTLEAgainst the background of an attempt to reverse the quarter, today there is a new opportunity to make money on TURTLE. Among the recent binance listings, this token is in the most oversold position and is preparing for a powerful growth wave to work out strong technical signals for a retest of 0.21-25 at least and up to 0.5 with a steadily growing market. After the last publication, a wave of growth was expected to retest the nearest resistance of 0.125, which was successfully broken through with a local break. The fall of ETH to the 2600 test was the reason for the disruption of the TURTLE trend, which I warned about, but it provided an excellent opportunity for additional scalping. In the new growth wave, there is a high probability of stable consolidation above 0.125 with tests of the next target range of 0.150-175. The second half of the quarter opened above 0.09, which also gives a signal for a stable exit above 0.1. With sufficient volatility, the current monthly candle will turn bullish with continued growth in the first half of the new month. Among the recent listings, MITO and BMT also have great growth potential with growth targets of up to 300-400%.
I am also considering older VIC HOOK CHESS projects with strong growth signals of up to 200%+.
Also, new growth waves of up to 50-70% can give UTK COS DATA QUICK FIO, which I recommend working with for fewer lots due to the threat of adding the monitoring tag.
PARTIUSDT Forming Falling WedgePARTI/USDT appears to be carving out a classic falling wedge pattern, a technical formation that often heralds a bullish reversal once breakout occurs. The range is narrowing, price action is compressing, and recently the volume has shown signs of rising — all indicators that accumulation could be underway and that a breakout may be imminent. If this structure holds true, the price could surge significantly once the upper trendline is breached.
On the fundamentals front, PARTI represents the native token of Particle Network, a next-gen modular Layer 1 blockchain built on the Cosmos SDK and CometBFT consensus. The project’s focus is on delivering chain-abstraction, universal accounts, universal liquidity, and universal gas — simplifying cross-chain operations and lowering the barrier to Web3 adoption. Tokenomics show a total supply of 1 billion PARTI, with a significant portion circulating while the rest remains locked or vested, which potentially adds a supply-side catalyst as the ecosystem matures.
From a strategy perspective, traders should watch for a clean breakout above the wedge’s upper boundary with confirmation via increased volume and sustained follow-through. An actionable entry might be after such a breakout or on a retest of the breakout level. Risk management is key — placing a stop below the recent swing low or the lower trendline of the wedge ensures a clearly defined risk. If the bullish case wins out, the reward potential could be strong given the foundational narrative and structural setup.

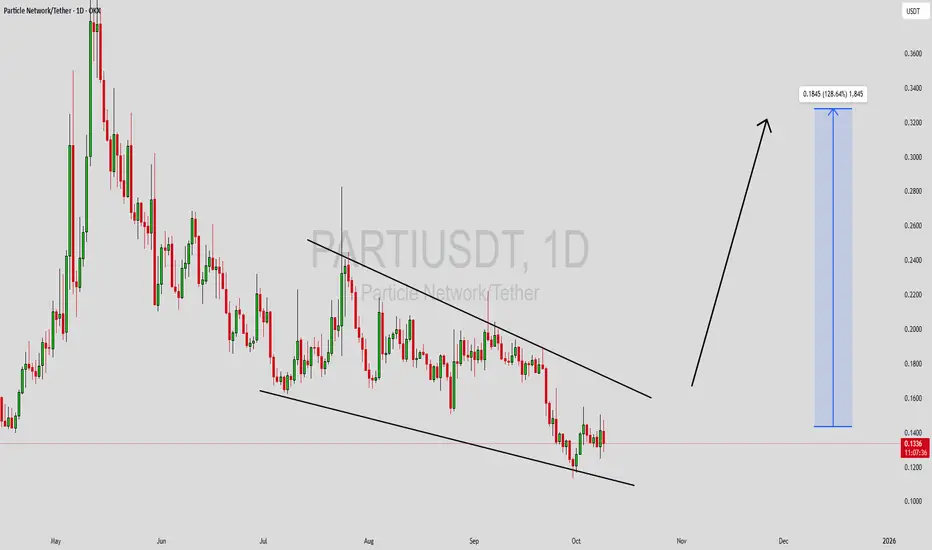
PARTIUSDT Forming Falling WedgePARTIUSDT is forming a clear falling wedge pattern, a classic bullish reversal signal that often indicates an upcoming breakout. The price has been consolidating within a narrowing range around $0.187 USDT, suggesting that selling pressure is weakening while buyers are beginning to regain control. With consistent volume confirming accumulation at lower levels, the setup hints at a potential bullish breakout soon. The projected move could lead to an impressive gain of 390% to 400%+ once the price breaks above the wedge resistance, sparking interest in PARTIUSDT price prediction among traders.
This falling wedge pattern is typically seen at the end of downtrends or corrective phases, and it represents a potential shift in market sentiment from bearish to bullish. Traders closely watching PARTIUSDT are noting the strengthening momentum as it nears a breakout zone near $0.20. The good trading volume adds confidence to this pattern, showing that market participants are positioning early in anticipation of a reversal in this modular blockchain token.
Investors’ growing interest in PARTIUSDT reflects rising confidence in the project’s long-term fundamentals and current technical strength, especially with seamless Web3 onboarding features. If the breakout confirms with sustained volume, this could mark the start of a fresh bullish leg. Traders might find this a valuable setup for medium-term gains, especially as the wedge pattern completes and buying momentum accelerates in falling wedge breakout crypto scenarios.
✅ Show your support by hitting the like button and ✅ Leaving a comment below! (What is You opinion about this Coin) Your feedback and engagement keep me inspired to share more insightful market analysis with you!

PARTI Looks Bearish (12H)It seems that a large-degree contracting bearish triangle has been completed. If we want to consolidate this pattern, we should consider it as wave Ameaning that we expect a **wave B** to form either in terms of time, size, or potentially even larger than wave A.
Any pullback toward the two red lines is an opportunity to open a sell/short position
A weekly candle closing above the invalidation level will invalidate this view.
For risk management, please don't forget stop loss and capital management
When we reach the first target, save some profit and then change the stop to entry
Comment if you have any questions
Thank You

PARTIUSDT Forming Falling WedgePARTIUSDT is currently forming a Falling Wedge Pattern, a strong bullish reversal setup that often signals the end of a downtrend and the start of a new upward movement. The price has been consolidating within a narrowing range, suggesting that selling pressure is fading while buyers are quietly accumulating positions. This setup is particularly significant when accompanied by rising interest and healthy volume, as we’re seeing here with PARTIUSDT.
The trading volume remains solid, confirming growing participation and renewed confidence among investors. A breakout from this wedge could trigger a powerful upside rally, potentially delivering gains of 90% to 100%+ as the price targets higher resistance levels. This technical pattern, combined with improving sentiment in the broader crypto market, adds further weight to the bullish outlook for PARTIUSDT in the coming sessions.
Investors are increasingly turning their attention to this project due to its improving technical structure and potential for substantial short-term growth. With momentum building and key resistance zones in sight, PARTIUSDT could become one of the next standout performers in the altcoin market.
✅ Show your support by hitting the like button and
✅ Leaving a comment below! (What is You opinion about this Coin)
Your feedback and engagement keep me inspired to share more insightful market analysis with you!
PARTI 4H Analysis - Key Triggers Ahead❄️ Welcome to the cryptos winter , I hope you’ve started your day well.
⏰ We’re analyzing PARTI on the 4-Hour timeframe.
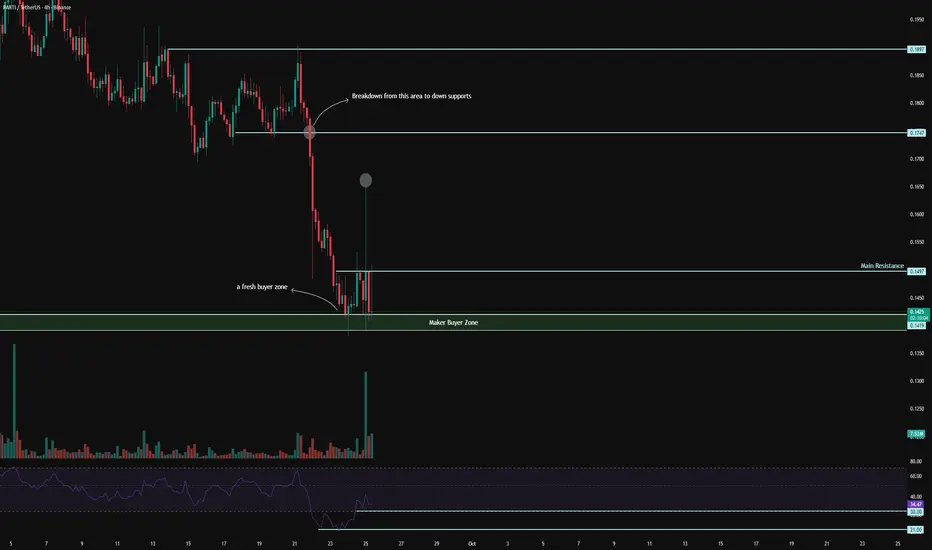
👀 On the 4-hour timeframe, Coin Party has flashed a strong sell signal after losing support at 0.1747, and is now moving toward its lower support zones. The overall trend on higher timeframes remains heavily bearish, with capital inflows steadily exiting the asset in a step-by-step manner.
Meanwhile, a relatively strong micro-buyer zone had formed, which initially pushed the price upward upon contact, but heavy selling pressure soon drove it back down. This level now represents the last defensive support for maintaining price stability. Losing it could trigger a move toward the coin’s key initial-offer support — or, at best, bring it close to that zone.
🧮 On 4-hour timeframe RSI OscillatorFrom a timing perspective, after losing the 0.1419 floor, the coin has been under intense selling pressure for 2 days. It is currently emerging from the oversold zone, sitting just below the 50 resistance level. Key areas remain at 30 and 21; a cross below 30 could generate a volatility-driven target near 21.
🕯 The size, volume, and frequency of red candles are increasing, reflecting heavy selling pressure. Sellers are actively acting as ticker sellers, absorbing any upward moves. Each price attempt away from support meets with stronger sell pressure.
🧠 For new entries, there is a strong possibility of whale-driven sell waves. Patience is key: we wait for the RSI to retest the 30 zone, and upon a confirmed breakdown of the current support floor, we can consider opening short positions.
❤️ Disclaimer : This analysis is purely based on my personal opinion and I only trade if the stated triggers are activated .
Particle Network Short-Term Trade Setup @194% Profits PotentialHere is the thing, the young charts we are using for the short-term trades, and this makes sense because we can't make much of a long-term prediction with no data ok?
Let's trade!
Basic and simple. I can't do it any other way so you will see me repeating the same. The truth is that simple works. If you can't explain something in a simple manner, it simple means you don't understand it well enough. Well, I understand this thing nicely because I will make it so simple for you, that you have to agree and even a three year old can say, "True, Master is right, I agree with his interpretation of the chart."
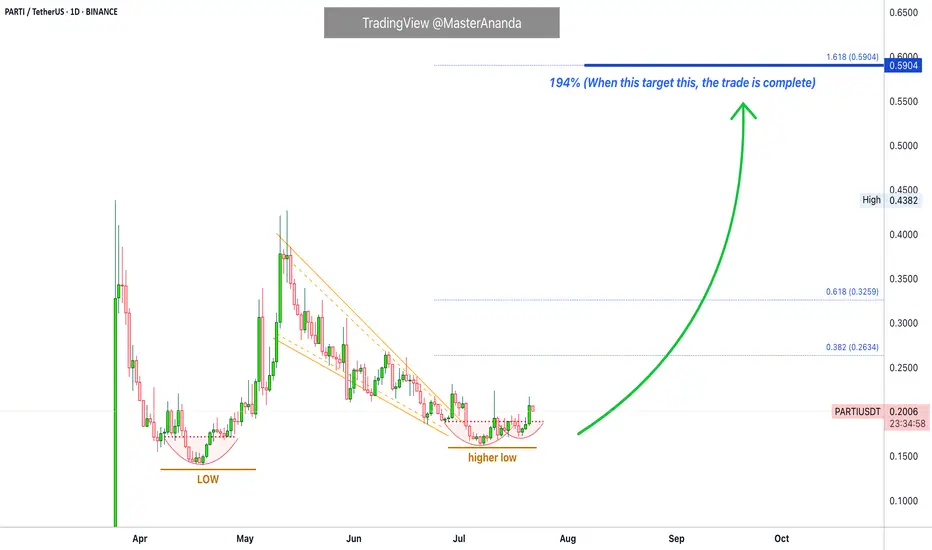
Low and higher low. Beautiful.
A bullish wave leads to a correction. The correction ends in a higher low. This confirms the bullish bias. The higher low is the place that will launch the next leg up. Minimum target is always the 1.618 Fib. extension. This is mapped on the chart as 194%, once it hits, the trade is closed and over. Take the profits and move on.
Thanks a lot for your continued support.
Thank you for reading.
Namaste.
PARTI Near Bottom, Perfect Bottom; Wait Two Months (185%+)Particle Network is showing no momentum on the drop. The peak happened 13-May, more than 40 days ago. I think it is easy to say—or fair to say—that the correction has run its course, it is reaching its end.
Near bottom or perfect bottom? Think about it.
Can you catch a perfect bottom? Yes. No. Maybe.
Is it necessary? Absolutely not.
That's the thing. The bottom might not be in or might be in, but we don't want to catch a perfect bottom we just want to buy near support. Trading low and close to a reversal. That's exactly what we have here.
If it keeps on going lower it goes lower for a few more days or a few weeks. Once the rise starts, it will be strong.
Forty days moving lower. 24 days lasted the bullish jump.
So the drop can last 40 days, 45 days, 50 days... More or less. Not much longer.
Even 20 days would be a decent wait but once the bullish action starts it is a sure win.
Say you aim at a target of 0.57 with profits potential exceeding 185%. With this in mind, would you wait 2-3 months?
If you trade 1 BTC, it is worth the wait.
0.10 BTC that is also ok.
If your position size is 10K, a win after 3 months can produce 28.5K.
Sounds good—looks reasonable, an easy wait.
Perfect bottom or trading low near support?
It all depends on your trading style, your capital and your goals.
Spot trading = buy and hold.
By the way, we got the first PARTIUSDT wave, let's go for the second one. Looks like an easy trade.
Thank you for reading.
Namaste.

Particle Network Set For Bullish Surge Amidst Bullish Flag Particle Network the Layer-1 blockchain powering chain abstraction, seamlessly unifying users and liquidity across Web3's native token ($PARTI) is set for a bullish breakout amidst a bullish flag pattern depicted on the 15-minute time chart.
The token got listed on major exchanges like Binance, Bybit, OKX, Bitget, GateIo and MEXC. Currently siting on a market cap of $80.89 million $PARTI is well poised for a bullish comeback.
The asset is currently up 8% as of the time of writing with the Relative Strength Index (RSI) at 60, this further validates the bullish thesis on $PARTI coin.
By unifying all chains, Particle will enable billions of users to seamlessly onboard and interact with dApps across every chain, serving as the foundation for mass adoption and playing an indispensable role in unifying the Open Web.
Particle Network Price Live Data
The live Particle Network price today is $0.338798 USD with a 24-hour trading volume of $530,561,230 USD. Particle Network is down 1.99% in the last 24 hours, with a live market cap of $78,939,915 USD. It has a circulating supply of 233,000,000 PARTI coins and a max. supply of 1,000,000,000 PARTI coins.
