LIQUIDITY SWEEP INTRADAY SETUP MODEL | EURUSDDaily price swept PDH, taking buy-side liquidity.
After the sweep, I’m not chasing longs.
I’m waiting for 1H market structure to shift bearish.
🔹 Entry condition:
1H closes below the CHoCH swing low
🔹 Stop loss:
Above the PDH sweep high
🔹 Target:
Previous Day Low (PDL)
Narrative is simple:
Buy-side taken → bearish confirmation → price seeks sell-side liquidity.
No prediction.
Just reaction to structure.
Patience

Long on EU/USD Lovely fresh demand zone waiting to be kissed. Liquidity just down that and a wonderful 75% Fib retr in the same area!
SL 1.1617
TP 1.19/1.20
🏄♀️🚀🛸

BULLISH ANALYSIS-15M XAU/USDIn this analysis, price first moves down to collect sell-side liquidity.
Many traders sell in fear, and institutions use that liquidity to buy at better prices.
After the liquidity sweep:
• Price shows a CHoCH, signaling a potential trend change.
• Then a BOS confirms bullish intent.
Price retraces into the POI at 4,331, an area where:
• Support is present
• Price is at a discount
• Buyers are likely to step in again
Before moving higher, price creates a fake out to remove impatient traders.
Then it continues toward its natural targets:
• TP1: 4,338
• TP2: 4,344
• TP3: 4,349 (buy-side liquidity)
👉 Price moves with purpose, toward liquidity, not randomly.

The Break-Even Syndrome: Why Profitable Trades Die Early“Many traders are right about direction…
but wrong about patience.”
A trade moves in your favor.
Not much. Just enough to breathe.
Your mind reacts before price does.
“Let me move stop to break-even.”
“Now it’s safe.”
But what feels like safety is often fear wearing discipline’s mask.
What Is the Break-Even Syndrome?
The break-even syndrome is the habit of moving stop loss to entry
not because the market confirms it —
but because the trader cannot tolerate the possibility of being wrong again.
It’s not risk management.
It’s emotional relief.
Why Traders Do This
• Recent losses create fear of giving back profits
• Ego wants to avoid another red trade
• The brain seeks comfort, not expectancy
• A small win feels better than another loss
So traders protect their feelings
instead of protecting their edge.
How Break-Even Kills Good Trades
Markets breathe.
Pullbacks are normal.
Structure requires space.
By moving to break-even too early:
• You exit before the real move begins
• You train yourself to fear normal retracements
• You destroy positive expectancy
• You stay “safe” but never grow the account
Break-even doesn’t reduce risk.
It reduces potential.
When Break-Even Makes Sense
Break-even is valid only when:
• Structure has shifted clearly
• Liquidity is cleared in your favor
• Partial profits are secured
• The market has earned protection
Otherwise, break-even is premature.
The Deeper Issue
The real problem isn’t the stop.
It’s trust.
Trust in your analysis.
Trust in probability.
Trust that not every trade needs saving.
You don’t need to protect every trade.
You need to let your edge play out.
📘 Shared by @ChartIsMirror
Do you move to break-even because the market told you to…
or because fear did?

The Trade You Don’t Take!Most traders focus on entries, strategies, indicators, patterns…
But the truth is: your biggest edge is avoiding low-quality trades.
The market rewards patience far more than prediction.
Here’s the framework professional traders use to filter noise from opportunity, something 90% of traders overlook:
1. The Market Must Be Aligned
Before placing any trade, ask one question:
“Is the market trending, ranging, or correcting?”
Your strategy only works in the right environment.
A breakout strategy fails in a choppy range. A mean-reversion setup dies in a strong trend.
Identify the environment first, then choose the setup.
2. Your Levels Must Be Significant
True opportunity comes from reaction points, not random prices.
Look for:
- Major swing highs and lows
- Weekly or monthly levels
- Clean trendlines with multiple touches
- Areas where price previously paused, reversed, or consolidated
If the market isn’t near one of these levels, you’re trading in the middle, where noise lives.
3. Your Risk Must Make Sense
A good setup with a bad risk-to-reward is a bad trade.
Professionals only act when:
- The stop-loss is logical (protected behind structure)
- The target is realistic
- The reward outweighs the risk
If the math doesn’t work, the trade doesn’t happen.
🧠 The Hidden Lesson
Great traders don’t trade more, they filter more.
Your account grows not by finding better entries,
but by avoiding the trades that drain your capital, energy, and confidence.
Master the art of waiting, and your strategy will finally start working the way it was designed to.
⚠️ Disclaimer: This is not financial advice. Always do your own research and manage risk properly.
📚 Stick to your trading plan regarding entries, risk, and management.
Good luck! 🍀
All Strategies Are Good; If Managed Properly!
~Richard Nasr

The Hidden Skill Every Great Trader Masters; And It’s Not Chart!Most traders spend years perfecting chart patterns, indicators, and entries…
Yet only a handful ever master the real skill that separates professionals from the rest, the art of waiting.
📉 Anyone can draw support and resistance.
📈 But not everyone can wait for price to reach them.
The market rewards patience, not predictions.
It’s not about catching every move, it’s about being ready when your setup aligns perfectly.
That’s when you strike. That’s when probability works for you, not against you.
Think of trading like fishing 🎣:
You don’t chase the fish, you position your line where it’s most likely to bite, then you wait.
So next time you feel the urge to jump in early, remind yourself:
You’re not just a trader. You’re a waiter, paid in precision and patience.
📚 Key takeaway:
Great traders don’t predict, they prepare.
They let the market move first, then respond with clarity.
⚠️ Disclaimer: This is not financial advice. Always do your own research and manage risk properly.
All Strategies Are Good; If Managed Properly!
~Richard Nasr

USDJPY – Waiting for H1 CHoCH After Daily Supply RejectionAfter reacting from the Daily Supply Zone, USDJPY is now showing signs of slowing momentum on H1. This region is the decision point: either we see a confirmed structural break (CHoCH), or price continues pushing upward into unmitigated liquidity.
Execution Plan:
– Wait for an H1 candle-body close below the last bullish swing high
– Let price retrace into the newly-formed H1 supply
– Refine on M15/M5 for entry
– No shorts without structural confirmation
If price reclaims the high instead of breaking down, the bearish idea becomes invalid and the bullish trend continues, and we can look at the further SO POINT.
Patience here is key.

USDJPY – First Reaction @Daily Supply Zone | Watching 4 WeaknessUSDJPY has finally tapped a major Daily Supply Zone that caused the last significant selloff. Liquidity above previous highs has been taken, and price is now reacting for the first time since this zone formed.
This is a premium area where reversal probability increases, but higher-timeframe supply alone is not enough for execution.
What I’m watching next:
– H1 to show the first clean CHoCH
– Early signs of weakening bullish order flow
– A potential retest into newly-formed LTF supply zones
– M15/M5 refinement for precise entries
If H1 fails to break structure, the bullish continuation remains intact.
We watch the Further SO POINT as well
Confirmation comes from structure — not from the zone alone.

The Illusion of Control: Why You Can’t Force the Market“The moment you try to control the market,
the market reminds you who’s really in control.”
Every trader begins by trying to master the market,
to predict it, bend it, or time it perfectly.
But with every chart and every candle,
the lesson becomes clear: control is an illusion .
The Control Trap
You enter a trade and instantly want the next candle to move your way.
You adjust your stop loss to feel safer.
You exit early just to protect a small profit.
And without noticing, your process turns into emotional management.
The market doesn’t punish mistakes.
It punishes the need to be right .
Why Control Fails
The market isn’t a machine you operate.
It’s a reflection of millions of human decisions.
Your control ends the moment your order is placed.
Once you accept that, trading feels lighter.
You stop managing outcomes and start managing yourself .
Letting Go Isn’t Giving Up
Letting go means realizing your role is to identify structure, define risk, and stay calm inside uncertainty.
You no longer trade to be right; you trade to execute well.
The need to control fades, and discipline takes its place.
Practical Reminder
• Define risk before entry.
• Accept the loss before pressing buy or sell.
• Never move your stop just to feel better.
• Let probability do the work.
You control your plan, not the outcome.
The market owes you nothing.
And that is what keeps it honest.
📘 Shared by @ChartIsMirror
Do you still find yourself trying to control what happens after entry?
Share your reflection below — awareness begins where control ends.

Silence Between Trades: The Missing Edge“The best traders don’t trade all the time.
They wait until silence turns into clarity.”
Most traders believe progress means constant activity —
always analyzing, clicking, reacting, entering.
But true consistency begins in the space between trades .
In that quiet gap where no button is pressed and no candle matters.
Why Silence Matters
The human mind craves noise.
When the chart slows down, the mind gets restless.
You start doubting your bias. You scroll timeframes. You force entries.
That’s not trading — that’s trying to escape stillness.
But silence is where observation deepens.
It’s where the impulsive trader becomes the patient one.
Stillness is not absence of action — it’s control of it.
What to Do Between Trades
Journal — note what you felt after your last trade, not just the result.
Observe price structure without bias. Let the market show its next intent.
Breathe — step away, let your nervous system reset.
Review your setups — refine your plan instead of forcing a new one.
The Hidden Edge
When others jump into random trades, your patience will look like inactivity —
but it’s actually precision.
The longer you can stay calm in uncertainty,
the closer you are to mastery.
Stillness isn’t waiting for the market to move —
It’s waiting for yourself to settle.
📘 Shared by @ChartIsMirror
Does silence make you uneasy, or do you find strength in it?
Share your reflection below — the quietest traders often have the loudest growth.

Patience - When Calm Feels WrongNOTE – This is a post on mindset and emotion. It is not a trade idea or strategy designed to make you money. My intention is to help you preserve your capital, focus, and composure — so you can trade your own system with calm and confidence.
Markets quiet down.
Price moves slow.
Everything looks still, maybe too still.
Part of you relaxes.
Another part tenses.
It’s that sense that something’s coming.
And sometimes, it is.
But here’s the hard part
Your body doesn’t always know the difference between anticipating danger and feeling unsafe.
For traders, the nervous system reads uncertainty like threat.
Even a normal pause in volatility can trigger the same internal siren:
Something’s wrong. Do something.
You start scanning: news, charts, signals
anything to justify the unease.
But often, the danger isn’t out there.
It’s inside you... a learned association between stillness and not knowing what's going to happen next
Which causes restlessness, uncertainty and a need to fidget and meddle.
The skill isn’t in shutting that instinctive unease down.
It’s in listening without reacting impulsively.
Ask yourself - what is really going on right here, right now?
The point here is:
Patience isn’t passive.
It’s regulated awareness.
It’s being alert, not alarmed.
Ready, but not restless.
Sometimes there is indeed a risk out there.
We are trading the financial markets after all.
However. You have a trading plan.
You know to be risk measured.
All that is needed now is the ability to regulate yourself
Stay calm and patient so you can execute your plan as intended.

Universal Trading Psychology: The Patience Paradox PlaybookUniversal Trading Psychology: The Patience Paradox Playbook
A general discipline lesson you can apply to any liquid market and any timeframe
Most trading pain is not caused by a bad system. It is caused by impatience. The edge appears when you plan inactivity, watch with intent, wait for confirmation, and only act when setup quality is high. Cash is a position.
1. Why patience beats impulse in every market
Impatience sneaks in as early entries, overtrading, revenge trading, and random scaling. These habits feel productive because you are clicking and chasing motion. In reality they transfer capital from your future self to the present urge. Patience does the opposite. It gives your method time to read structure, it allows volatility and volume to normalize, and it keeps your energy for the right moment. The effect is universal. It does not matter if you trade indices, commodities, crypto, stocks, or forex. It does not matter if you trade on the one minute, the fifteen minute, or the daily. The core link is simple. Better timing raises the probability of an idea and lowers drawdown. Fewer attempts with higher quality improve expectancy and improve return divided by drawdown. That is the language that every account understands.
2. The Patience Paradox in plain language
The paradox says you can win more by doing less. You plan windows where you watch the market without touching the buy or sell buttons. You promise to yourself that you will let a timer run and you will only act after a confirmation event. Inactive minutes feel like a cost at first. In practice they are an investment. They reduce noise, they teach you the current regime, and they keep you calm enough to apply your edge. The paradox holds across sessions. The first minutes after a session begins often have high noise and emotional bait. The middle of the session can go quiet and trick you into forcing trades. The last minutes can be erratic. A patient trader respects this rhythm and keeps a written plan of when to observe and when to allow action.
3. Observation windows that fit any market
Observation windows are simple. Pick a time block. Start a timer. During the block you do not place orders. You watch the tape, the order of bars, the response to levels, and the size of swings. You collect awareness. You write one or two sentences about regime and structure. Then the timer ends. Only then do you look for a trade.
Observation windows you can adopt today
Pre session scan for fifteen minutes. You prepare levels and watch the first hints of tempo. Inactive only.
Session open observation for fifteen minutes. You let the first box form. No orders until a bar closes beyond this box and the next bar respects that information.
Mid session read for thirty minutes. You classify regime as active or quiet using simple filters and you decide trend, range, or inactivity.
Pre secondary session observation for fifteen minutes. If your market has two major sessions, you repeat the open observation idea.
Post trade cooldown for ten to twenty minutes. You break the dopamine loop, you write a short review, and you reset your attention.
How to make it practical
Place a small physical timer on your desk. A phone timer also works. Print a one page card with your windows and durations. When the window starts, say out loud that you are in observation and you will sit on hands until the timer ends. This small ritual builds identity. It tells your brain that watching is part of trading and not a waste of time.
4. Confirmation that cuts false signals
Impatience usually shows up as early entry without confirmation. The most portable rule is also the simplest. Wait for the close. A signal bar that looks perfect in the middle of its life can close with a wick, a rejection, or a full flip. If you still want earlier entry mechanics, use delay one bar. You let a signal print. You enter on the next bar only if price remains valid. Both rules reduce false positives and reduce the total number of attempts. That is a feature, not a bug. The quality of attempts goes up. The mood in your head calms down. Your journal becomes cleaner to read and your expectancy calculation becomes more stable.
A universal confirmation checklist
The setup is valid by your written plan.
Close confirms beyond structure or a retest holds and closes in your direction.
Regime filters are supportive. You see participation that matches the idea.
Risk and position size are defined. The exit is clear before you click.
5. Regime filters that travel well
Regime is the background condition that decides if your strategy is likely to read the market correctly. You can estimate regime with two simple filters. One measures volatility. One measures participation. These two are available on any platform.
Volatility filter
Use average true range with a long enough length to be stable. A common choice is length fifty. Express ATR as a percent of price so you can compare across timeframes and symbols. Compare the current reading to a baseline such as the daily median over the last few weeks. Above the baseline means active regime. Below means quiet regime.
Participation filter
Use a session volume baseline. A simple moving average of session volume works. When current volume is below the baseline, you demand more patience or you switch to range tactics. When current volume is above the baseline, you keep confirmation strict and you avoid random scalps.
Session filter
Every market has time of day effects. The first minutes can be noisy. Lunchtime or the middle band can be flat. The last minutes can snap. You plan a response. Observe at the open. Reduce attempts in the lull. Keep the end of session simple.
6. Cooldown, loss streak lockout, and daily loss limit
Cooldown is the fastest lever you can pull to stop impulsive streaks. After any loss you start a ten to twenty minute cooldown. You leave the chart zoom alone. You write a short paragraph with what the market did and what you did. This break cuts the urge circuit and lets you reset. A lockout is a stronger version. Two losses in a row at full risk trigger a lockout until the next session. Three small losses also trigger a lockout. A win does not cancel a lockout if you broke plan discipline during the win. A daily loss limit protects the account from a bad day. Pick a fraction of your weekly drawdown budget. When you hit it, you stop for the day. These three guardrails build survivorship and keep your mind from spiraling.
7. Expectancy and return divided by drawdown
Expectancy is the average outcome per trade. Write it as average win multiplied by win probability minus average loss multiplied by loss probability. It is a small number in units of R. That is fine. The power of expectancy is repetition. The second metric to watch is return divided by drawdown. This tells you how efficiently you compound given the cost of the worst pullback. Patience improves both. Cutting early attempts raises win probability and often raises average win because you pick cleaner structure. Removing impulsive losses reduces drawdown. Together they stabilize equity and make your process less emotional.
A quick way to measure
Log ten to twenty trades under the patience protocol. Record average win in R, average loss in R, win rate, and worst drawdown in R. Compute expectancy and return divided by drawdown. Then compare to your prior logs where you did not respect observation or confirmation. The difference shows you why patience pays.
8. A portable pre market checklist
Checklists prevent decision fatigue. Use one page. Keep the language simple.
Trade plan
Plan is visible. Strategy is defined.
Entry, exit, and position size rules are clear and written.
Journal template is open.
Market regime
ATR as percent of price labeled active or quiet.
Session volume labeled below baseline or above baseline.
Prior session open, high, low, close marked.
Observation windows for the first minutes drawn on the chart.
Session timing
Pre session observation timer set.
Open observation window scheduled.
Lunchtime lull noted.
Post session review time booked.
Watchlist and setup quality
Three to five names maximum.
One sentence setup description for each name.
Score the idea from one to five on quality.
Act only on four or five.
Confirmation and patience
Delay one bar or close based confirmation selected.
Inside bar means wait. No exceptions.
If FOMO appears, start a five minute micro timer and breathe.
Say out loud that doing nothing is a valid decision.
Risk and position control
Risk per trade set as a fixed percent of equity.
Stop never widened after entry.
No adds unless the plan explicitly allows scaling.
Daily loss limit and lockout rules visible.
Exit plan
Exit condition defined before entry.
Partial exits use confirmation if the system supports it.
If a volatility spike hits, reduce risk or exit per plan.
Journal the reason for the exit.
9. A simple setup quality score
A score makes permission to trade objective. Use five factors. Each is zero to two.
Factors
Regime. Market aligned with the strategy using the filters.
Structure. Setup is clean with room to target.
Timing. Observation respected and confirmation present.
Risk. Position size correct and stop placed where logic breaks.
Mindset. Patient attention present and FOMO absent.
Eight or more means permission. Seven or less means wait. This one rule saves careers.
10. A day in the life under the Patience Paradox
You begin fifteen minutes before your active session with an observation. You mark levels and write a short line about tempo. No orders. When the session begins you let the first box print. A breakout looks tempting inside the window, but you stay inactive. The next bar fails to close beyond the box. You extend the delay. Later participation rises above the baseline and volatility reaches the active zone. Your strategy calls for a trend pullback entry. You wait for a bar to close back in the direction of trend. Then you take a single position with one percent risk. The trade reaches target. You record the result and start a short cooldown. Near the second session open you repeat the observation idea. A clean setup appears but your score is only six. You pass and write one sentence to honor the decision. You end the day with a review and update your metrics. Equity is stable. Attention is calm. The process feels repeatable.
11. Overtrading prevention that actually works
Limit attempts per session. Use micro breaks whenever fatigue appears. If the journal shows a loss streak, apply the lockout. If volatility is too low, accept inactivity. If noise is heavy near the open, extend the observation. If you break any rule, record the event and reduce size on the next attempt. Prevention is cheaper than recovery. You will never regret a trade you did not take. You will often regret the one you forced.
12. Mindfulness and urge surf for traders
Mindfulness is not about long meditation. It is about a one minute reset. Watch the breath for one minute. Name the urge silently. Start a two minute timer and surf the wave. When it passes, you return to the plan. This tiny protocol moves you from reaction to response. Over time it raises your discipline score and lowers your cost of error.
13. Frequently asked behavior questions
What if the first clean setup appears during the first minutes of the day
You still respect the observation. The first confirmation bar after the window often gives better probability and a calmer entry.
What if volume stays below average all day
Reduce attempts. Focus on one name or stay inactive. Quality beats quantity. You are paid for selectivity, not activity.
What if I miss a win after a long wait
Missing is normal. Write it in the journal and keep the schedule. The market never runs out of opportunities. Your attention does.
How do I measure improvement
Track three numbers. Expectancy. Return divided by drawdown. Discipline score. If the first two rise and the third stays above four, the process is working.
14. Install the Paradox in one week
Day one. Print the checklist and the windows. Place a timer on the desk. Commit to half the usual number of attempts.
Day two. Run all observation windows. Log only confirmed ideas.
Day three. Add the cooldown after any loss. Review your writing at the end of the day.
Day four. Apply the loss streak lockout if needed. Protect the account.
Day five. Score every idea with the five factor grid. Only trade eight or more.
Day six. Compute expectancy and return divided by drawdown from the week.
Day seven. Read your notes. Keep the parts that made you calm and effective. Remove what was noise.
15. Comparator versus a passive baseline
You want to see that patience improves efficiency. Pick a baseline that matches your market. If there is a natural session, use buy at session open and exit at session close. If there is no natural session, use an always in market baseline. Then run the Patience Paradox protocol next to it.
How to compare in three steps
Compute baseline results across your window. Record attempts, average result per session, and worst drawdown in R.
Compute Paradox results with observation windows, confirmation, and guardrails. Record attempts, expectancy, and worst drawdown in R.
Compute return divided by drawdown for both. When the protocol is respected, this ratio usually improves even if total trades drop. Your account and your sleep benefit from that.
16. A journal template you can use today
Before entry
Setup name and one sentence description.
Regime notes on volatility and participation.
Quality score and reason for each point.
Risk in R and exit plan.
After exit
Result in R and whether the logic held.
What you felt and how you responded.
What you would repeat and what you would remove.
One sentence lesson for the board.
17. Advanced patience drills for professionals
The inside bar extension
When a bar prints inside the prior range you extend the observation by one more bar. This drill stops you from guessing breakouts and creates a natural delay.
The half size probation
After a loss you allow the next confirmed idea at half size. You return to full size only after a clean win that followed plan. This keeps you from trying to win it back.
The one pass rule
You allow yourself one pass on a marginal idea each week. You write the reason and the outcome. This rule prevents a cascade of rationalizations.
18. Closing perspective
Patience is not passive. It is active observation guided by rules. A professional monitors regime, respects timers, demands confirmation, and protects the account with cooldowns and lockouts. The paradox is simple. Inactivity at the right time raises probability, keeps drawdown shallow, and makes expectancy stable. Traders who internalize this find that the market stops feeling like a battle and starts feeling like a process. You do less. You see more. You let the best ideas come to you.
Education and analytics only. Not investment advice.
Thank you all for reading this article.
If you have any type of requests, drop a comment below.

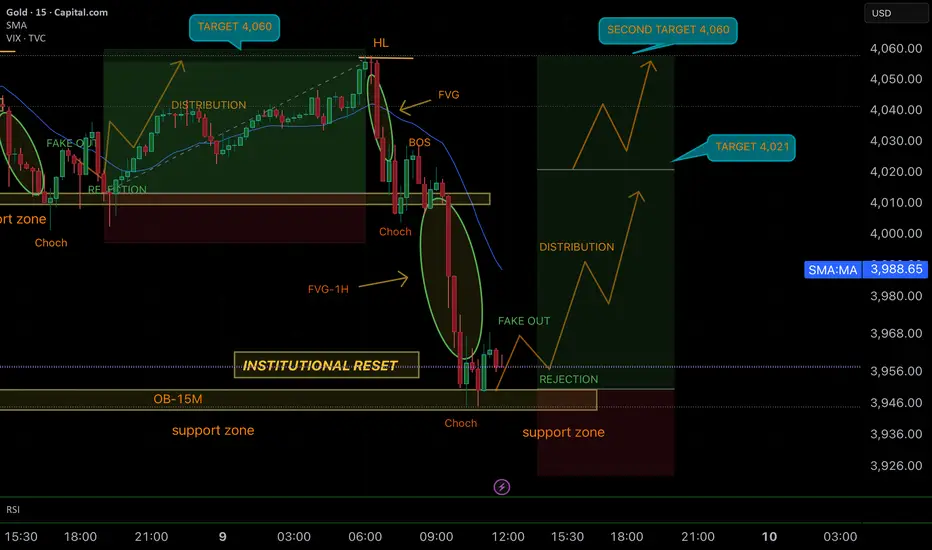
SMART MONEYN CONCEPT (SMC)📊 SMC Analysis – GOLD 15M
• After reaching the High (HL) near 4,060, price broke down with a Break of Structure (BOS), creating a clear institutional reset.
• Price tapped into the 1H Fair Value Gap (FVG-1H) and the 15M Order Block (OB-15M) inside the support zone.
• A Change of Character (ChoCH) plus a fake out formed before rejecting strongly back into bullish territory.
• Current projection: institutions may drive price into a new distribution phase, first targeting 4,021, with a second target at 4,060.
• Setup remains valid while price holds above the support zone and the FVG imbalance is respected.
🚀 Takeaway for traders: Institutional resets aren’t the end of the trend — they’re liquidity grabs to fuel the next leg. Stay patient and follow the footprints.
GOOD LUCK TRADERS… ;)
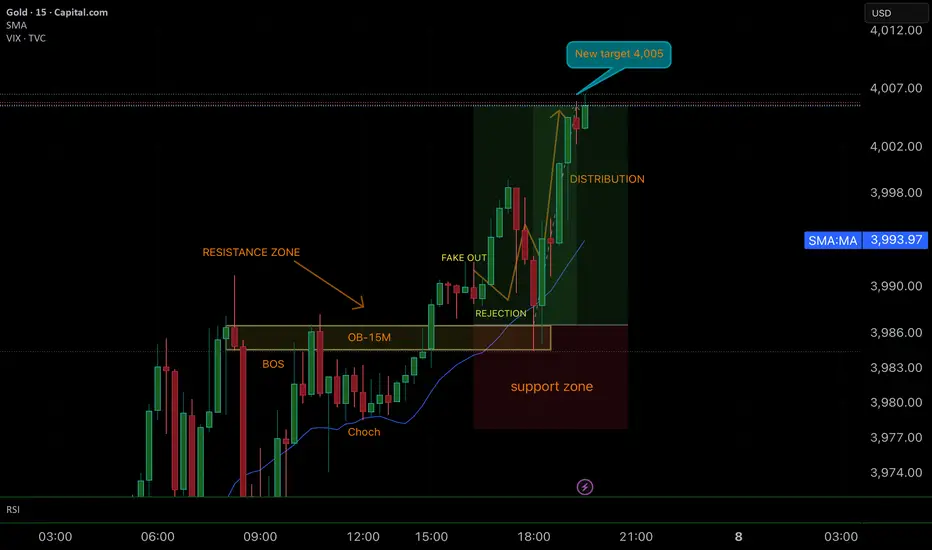
SMART MONEY CONCEPT (SMC)📊 SMC Analysis – GOLD 15M
• After the ChoCH and Break of Structure (BOS), price tapped into the 15M Order Block (OB-15M) located inside the resistance zone.
• A classic fake out occurred above the level, followed by a rejection back into the support zone, giving confirmation of bullish intent.
• From there, price pushed strongly into distribution, targeting the new highs.
• First target achieved: 4,005, right at the psychological level above 4,000.
• Market structure remains bullish as long as the support zone holds.
⚡ This analysis shows perfect market manipulation → rejection → bullish continuation flow.
GOOD JOB TRADERS.. ;)
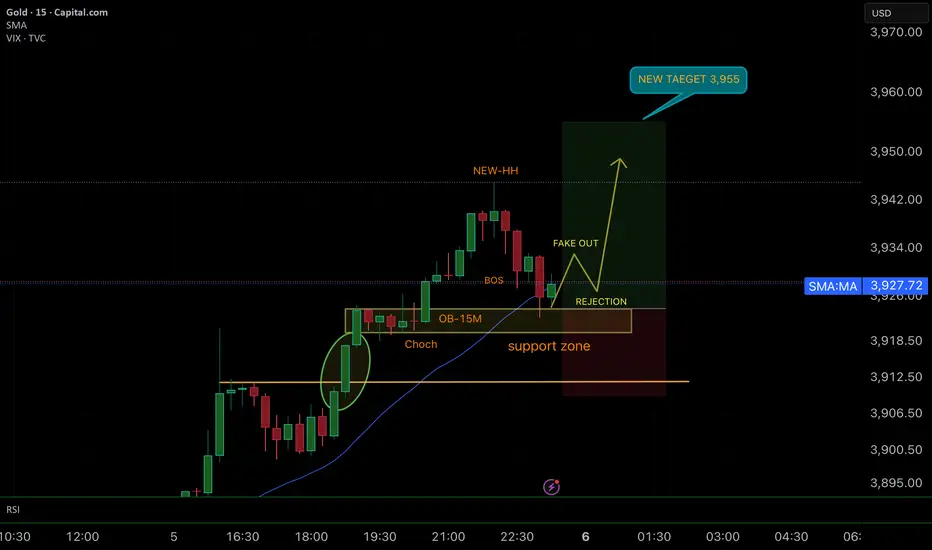
SMART MONEY CONCEPT (SMC)📊 SMC Analysis – Bullish Projection on GOLD
🔎 Market Observation
Price showed a Change of Character (ChoCH) at the support zone, confirming strong buyer interest. Then it created a new Higher High (HH), validating bullish continuation. Currently, we see a short-term BOS (Break of Structure) that looks more like a healthy retracement than a reversal.
📍 Key Levels
• OB-15M (Order Block 15m): Aligned with the support zone, likely to act as a mitigation point.
• Rejection + Fake Out: Market could create a liquidity sweep before resuming the bullish move.
• Target 3,955: Projection consistent with bullish structure and continuation.
📈 Conclusion
The bullish scenario remains strong: a minor pullback into the OB and support is expected before continuation upward. As long as 3,920 – 3,918 holds, probability of reaching 3,955 is high. GOOD LUCK TRADERS…. ;)
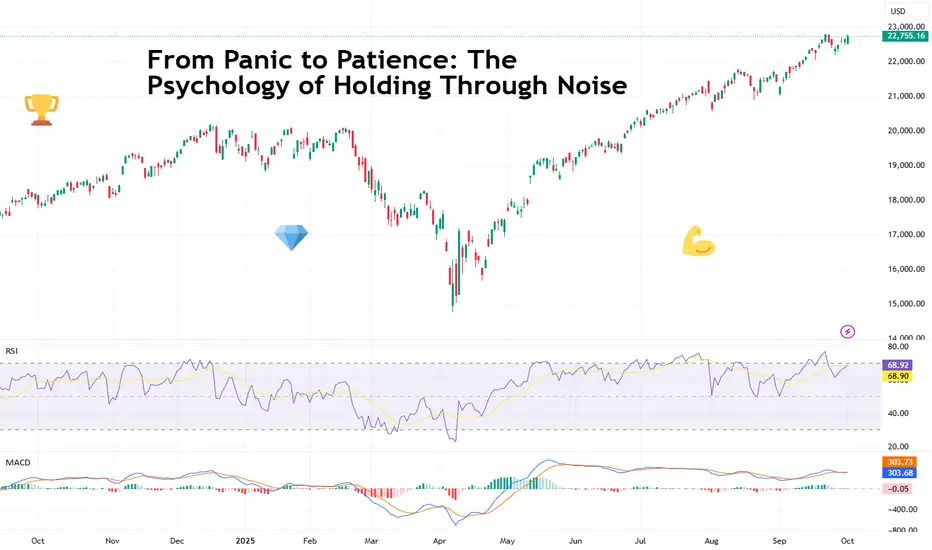
From Panic to Patience: The Psychology of Holding Through NoiseMarkets can be a noisy place. Screens flash, feeds scroll, and your cousin won’t stop texting you with urgent stock tips.
Yet if you zoom out, the difference between traders who burn out and traders who build wealth often comes down to one underrated skill: the ability to hold.
Not forever, of course, and not in ignorance. But to hold through the chatter, the dips, and the occasional headline apocalypse without throwing your strategy in the bin.
Let’s talk about how patience beats panic, and how you can keep your head when all about you are losing theirs .
📉 Why Panic Is Easy
When a chart turns red, our lizard brains scream louder than Jim Cramer on Nvidia NASDAQ:NVDA day. Humans are wired to avoid loss more than to seek gain — a concept called loss aversion. Especially during events from the Economic calendar or the Earnings calendar — nasty surprises can tilt you off kilter.
In trading terms, losing $1 hurts twice as much as making $1 feels good. That’s why you’ll often see people bailing at the first sign of trouble, only to watch prices reverse and rally without them.
But most “market crises” are just noise. If you zoom out, markets wobble, shake, and zig-zag before resuming their long-term trend. But panic-selling is a reflex, and unless you train yourself out of it, it’ll cost you over and over.
⏳ The Patience Premium
Patience in trading isn’t granted — it’s a superpower. Think of it as the compounding effect of discipline. When you resist the urge to sell into weakness or chase into strength, you give your trades time to play out according to your thesis instead of your emotions.
This doesn’t mean becoming a bagholder or marrying a bad stock. It means knowing the difference between short-term volatility and a true trend reversal . Spoiler: they’re not the same thing.
Warren Buffett (obligatory Buffett quote) once said the stock market is a device for transferring money from the impatient to the patient. In other words: the longer you can wait without flinching, the better your odds.
📰 The Problem with Market Noise
Every week brings a new villain: tariffs, inflation, “this time it’s different” chatter. But most of the time, these events don’t destroy trends — they just shake weak hands out of positions.
Think back to April’s tariff shock . Bitcoin BITSTAMP:BTCUSD dipped, stocks slid, headlines screamed.
Not even a week later, the Nasdaq Composite NASDAQ:IXIC vaulted higher by 12% for its best day in 24 years.
A few months later, markets not only recovered but ripped to new highs . The traders who panicked out at the bottom? They locked in losses. The ones who sat tight with a plan? They got paid.
🧘 Training the Trader’s Mind
You can’t mute the market, but you can build a mindset that handles it better. Start by reframing volatility. Instead of “Oh no, my position is doomed,” think “Let’s see if my thesis remains valid, or I’ll consider bailing.”
Other tips:
• Position sizing . If you’re too heavy in one trade, every tick feels like life or death. Keep sizes reasonable, and the noise gets quieter.
• Set rules in advance. Decide your stop-loss and target before you hit buy. That way, you’re not making panicked choices mid-storm.
• Practice detachment. It’s not your stock. It’s a trade. Don’t let ego glue you to every uptick.
These aren’t hacks; they’re habits. Build them, and noise turns from overwhelming to manageable.
🎢 The Cyclical Nature of Stress
Holding through noise isn’t just about one bad week — it’s about recognizing that markets move in cycles. Bull runs, corrections, consolidations… rinse, repeat.
When you’re in a correction, it feels endless. When you’re in a rally, it feels invincible. Neither is true. Both will pass. Your job isn’t to predict every twist, but to ride the broader wave without getting tossed by every splash.
This is why seasoned traders talk less about “calling tops” and more about sticking to process. Trends matter more than headlines.
💡 Patience ≠ Blind Holding
Let’s clear something up: patience doesn’t mean diamond-handing garbage stocks to zero. It means sticking to positions where your thesis still holds. If the fundamentals or technicals break, you cut it. If the only thing that’s breaking is X’s collective sanity, you hold.
The art is knowing the difference — and that’s what separates a patient trader from a stubborn one.
🔑 From Panic to Patience in Practice
So how do you go from reactive panic to steady patience? Try this framework:
• Zoom out — Look at the weekly or monthly chart before you sell on a 15-minute candle.
• Check the plan — Does your original thesis still make sense? If yes, why exit?
• Limit your exposure — Never risk so much that a drawdown keeps you awake.
• Reframe the noise — Headlines pass. Trends endure.
That’s the difference between panic selling and strategic holding.
🎯 Bottom Line
Holding through noise is as much psychology as strategy. It’s about resisting the knee-jerk sell, trusting your process, and understanding that volatility is part of the game. The traders who master patience don’t just survive noise — they profit from those who can’t handle it.
So next time the S&P 500 heatmap lights up red, ask yourself if this is the end of it, or just another chapter in the endless saga of market drama? More often than not, it’s the latter.
Off to you : What's your strategy when you need to filter the noise out? Share your thoughts in the comment section!
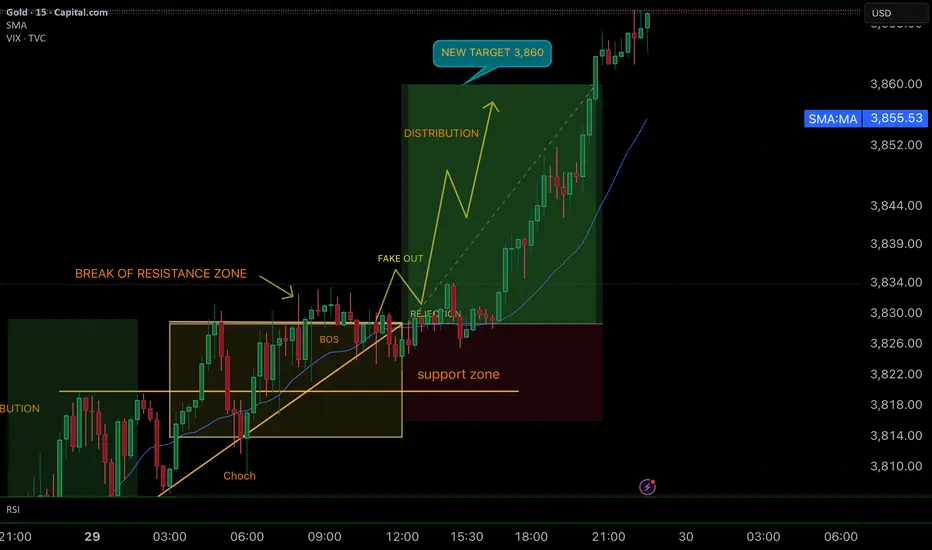
SMART MONEY CONCEPT (SMC)📊 GOLD 15M – Perfect Trade Execution
🔑 What Happened
1. ChoCh + BOS → Confirmed the change of character and break of structure.
2. Break of Resistance Zone → Price broke above the key resistance area with strong bullish pressure.
3. Fake Out + Rejection → Liquidity grab (fake out) followed by rejection validated the entry.
4. Bullish Impulse → Price launched directly toward the 3,860 target, surpassing the projection.
🎯 Result
• Entry: At the rejection after the fake out.
• TP (Take Profit): 3,860 → hit with strength 🚀.
• Momentum: Strong bullish continuation creating new Higher Highs (HH).
GOOD JOB TRADERS….. ;)
📌 SMC Lesson
Patience is key — waiting for confirmation at the rejection after manipulation (fake out) separates a forced trade from a clean institutional setup.
SMART MONEY CONCEPT (SMC)📊 Trade Breakdown – GOLD 15M
1. Context
• The market came from a distribution phase with a strong rejection at the resistance zone.
• Initial bearish structures appeared (ChoCh + BOS), pushing price down into key support zones.
2. Key Confirmations
• ChoCh (Change of Character): price signaled a potential reversal from bearish to bullish.
• BOS (Break of Structure): break of minor structures confirmed buyers stepping in.
• Fakeout + Rejection: liquidity was taken at support (stop hunt), followed by a strong bullish reaction.
• FVG Mitigation: price filled the imbalance before continuing upward.
3. Execution
• Entry taken after the clear rejection at the institutional support zone.
• Stop Loss placed just below liquidity zone for protection.
• Take Profit projected at the resistance zone (3,767).
4. Result
✅ Price fully respected structure and hit the target at 3,767.
✅ Two days of patience paid off with a clean, high-probability setup.
🔑 SMC Lesson
• Liquidity gets cleared before any strong move.
• ChoCh + BOS + FVG + rejection at key zones = golden setups.
• Discipline and patience are just as important as technical analysis.
GOOD JOB TRADERS….;)

Dollar getting stronger?The Dollar is showing strong bullish signs both technically and fundamentally. I’m looking for a long-term buy with two targets, taking the first at a key level and holding the second as long as the fundamentals remain supportive. A straightforward setup where fundamentals and technicals align.
lets see how it works out.

SMART MONEY CONCEPT (SMC)📊 Bullish SMC Trade Recap – GOLD
1. Resistance Break → Price cleanly broke the resistance zone, confirming bullish strength.
2. Fake Out & Liquidity Grab → Institutions swept liquidity above resistance, trapping early sellers.
3. Rejection Entry → The rejection gave the perfect confirmation for entry.
4. Explosive Move → Price launched directly toward the new target.
5. Target 3,785 Hit 🎯 → Institutions drove the market to fresh Higher Highs, just as projected.
6. Distribution Phase → After hitting target, price consolidates in distribution, showing smart exit points.
✅ Conclusion: Patience, confirmation, and structure once again proved the power of institutional trading. A clean, textbook example of SMC in action.
GOOD JOB TRADERS…… ;)

EURGBP | POSSIBLE BEARISH INTENT Price never tagged me in on the buy but is reacting very well from the 3HR OB
so now we wait to confirm that change then we can look to join in sells
Watch your charts !!

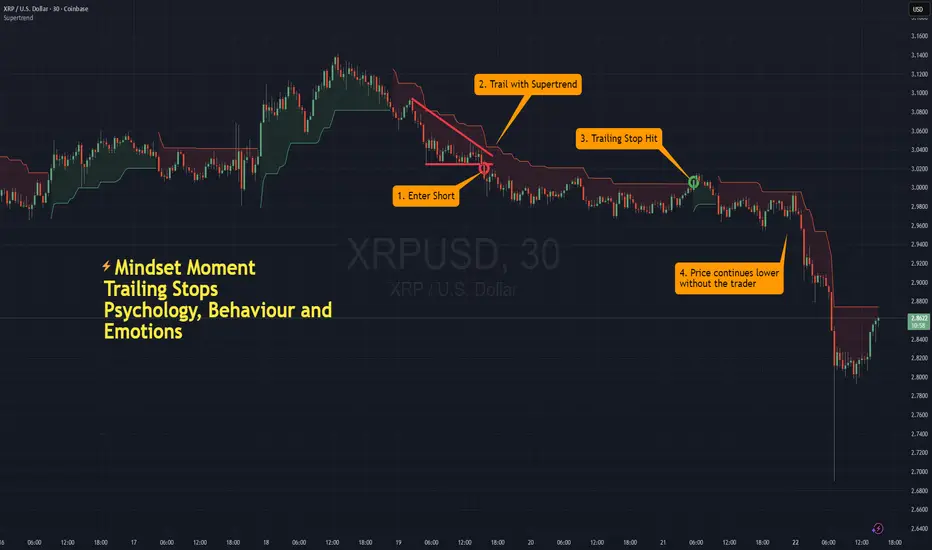
Exit Psychology 3/5: The Trailing Stop – Patience vs ProtectionNOTE – This is a post on Mindset and emotion. It is NOT a Trade idea or strategy designed to make you money. If anything, I’m taking the time here to post as an effort to help you preserve your capital, energy and will so that you are able to execute your own trading system as best you can from a place of calm, patience and confidence.
This 5-part series on the Psychology of Exits is inspired by TradingView’s recent post “The Stop-Loss Dilemma.” Link to the original post at the end of this article.
Consider this next scenario:
You’re in a trade and it’s working. Price is moving in your favour. You trail your stop in line with your plan. The trade moves your way and your trailing stop has started to lock in profit. Relief washes over you for a moment. Then price pulls back, tags your stop by a fraction and runs again without you on board.
Frustration rises: you protected your gains, but cut your winner short.
How behaviour shows up with trailing stops:
Trailing stops can be powerful, but the way we use them often reveals our mindset:
Moving the stop up too quickly : Driven by the belief that profit isn’t real until it’s banked.
Keeping it too loose : Rooted in the hope that one big win will make the difference.
Adjusting based on emotion rather than structure : Reflects the belief that constant management equals control.
Using the trail as a safety net when confidence fades: “I don’t trust myself to exit well without this crutch.”
The psychology underneath:
These surface behaviours are often driven by deeper beliefs and biases - the silent programs running in the background:
Scarcity belief : “If I don’t protect every dollar now, it will disappear.” This drives over-tightening.
Illusion of control: Adjusting the trail gives the feeling of mastery, even if it undermines expectancy.
Hero trade belief : The idea that one outsized win can “fix” everything encourages overly loose trails.
Identity fusion : For some, holding onto profit = being a “good” trader; giving it back = failure.
Comfort-seeking : The nervous system experiences unrealised gains as already “yours,” so trailing becomes a way to protect identity as much as capital.
Why traders use trailing stops:
There are good reasons too. Trailing stops can:
Protect profits without fully closing the position.
Allow participation in bigger trends without micromanaging.
Reduce stress when you can’t watch the screen constantly.
But just like initial and break-even stops, the challenge isn’t the tool, it’s the psychology behind how and when we use it.
Practical tips … the How:
The point isn’t the exact method you use, but whether your adjustment comes from structure or from stress. A few ways to build awareness:
Define in advance what conditions justify moving the stop - structure, ATR, trend shift - not just feelings.
Notice the difference between protecting and controlling. One preserves edge, the other chokes it.
Journal: How many times has moving the trail early cost you a bigger win? Seeing patterns reduces self-deception.
Practice nervous system awareness : when you feel the urge to “lock in,” pause and observe the sensation in your body before acting. Sometimes that’s enough to prevent a premature cut.
Reframe:
A trailing stop isn’t a way to eliminate uncertainty. It’s a tool to balance patience with protection. Used well, it keeps you in the move long enough to benefit, while still defining where you’ll step aside.
Closing thought:
The art of the trailing stop isn’t about perfection. It’s about holding the tension between fear of giving back and faith in your process and learning to stay in that space without over-managing.
A quick note to those who have signed up to the free newsletter on our website: please be sure to check your spam folder in case it’s found its way there.
A link to the previous post in this series - Exit Psychology 2/5 : The Break-Even Stop – Comfort or Illusion
A link to the original article as promised:
This is Part 3 of the Psychology of Exits series .
👉 Follow and stay tuned for Part 4: The Profit Target – Certainty vs. Potential .
SMART MONEY CONCEPT (SMC)📊 Bullish Analysis on GOLD (XAU/USD)
1. Market Context
• Price recently showed a ChoCh (Change of Character) followed by a clear BOS (Break of Structure), confirming bullish momentum and institutional interest.
• The highlighted OB-1H zone acts as a decision point where a retracement is likely.
2. Trade Plan
• Rejection Zone: Expecting price to retest the OB-1H and confirm liquidity before continuation.
• Fake Out: A possible liquidity grab may occur, trapping sellers before the real move.
• Institutional Distribution: After clearing liquidity, price is likely to resume its bullish path strongly.
3. Target & Risk Management
• 🎯 New Target: 3,730 (potential creation of a Higher High – HH).
• 📍 Support Zone: Marked as invalidation area if price breaks lower.
• 🛡️ Entry on rejection provides a strong Risk/Reward setup supported by institutional order flow.
4. Conclusion
This setup highlights institutional buyers’ interest in driving price higher. The key is patience wait for confirmation at the rejection zone before entering to catch the move toward 3,730.
GOOD LUCK TRADERS….. ;)
