EUR/USD rally: "Sell America" targets 1.18 – Buying Wave 4 dip?We are witnessing a strong repricing in EUR/USD, driven by a "Sell America" trade that is crushing the dollar across the board. The pair is up 1.6% this week alone, breaking out of a bullish flag and confirming a vertical impulsive move. But the question is: with Wave 4 near the 100% extension as support, is it time to buy the dip?
We analyse the shift driven by President Trump's tariff threats at Davos, which has intensified the selling pressure on the greenback. We overlay this geopolitical risk with a classic Elliott Wave setup on the 4-hour chart, mapping out the path to 1.1800 and potentially 1.1900.
Key topics covered :
"Sell America" intensifies: How Trump's double-down on the February 1st tariff deadline at Davos triggered a second wave of dollar weakness, sending gold to $4,850 and the euro soaring.
Elliott Wave analysis :
Wave 3 peak: The impulsive leg from Monday's open was rejected exactly at the 161.8% Fibonacci extension (1.1767), signalling a temporary top.
Wave 4 entry: We are now looking for a corrective pullback to the 100% Extension and 50% Retracement near 1.1700—a major psychological support and our "buy zone."
Wave 5 targets: If 1.1700 holds, the net distance projection targets 1.1784, 1.1807, and potentially 1.1830.
Risk Factors : Tomorrow's US PCE data (expected steady at 2.8%) is the wild card. A hot print could deepen the correction, while an in-line result supports the higher grind.
Are you buying the Wave 4 dip at 1.17 or fading the rally? Let us know in the comments!
This content is not directed to residents of the EU or UK. Any opinions, news, research, analyses, prices or other information contained on this website is provided as general market commentary and does not constitute investment advice. ThinkMarkets will not accept liability for any loss or damage including, without limitation, to any loss of profit which may arise directly or indirectly from use of or reliance on such information.
PCE

PCE — What the market will see on Thursday (22 January 2026)Introduction
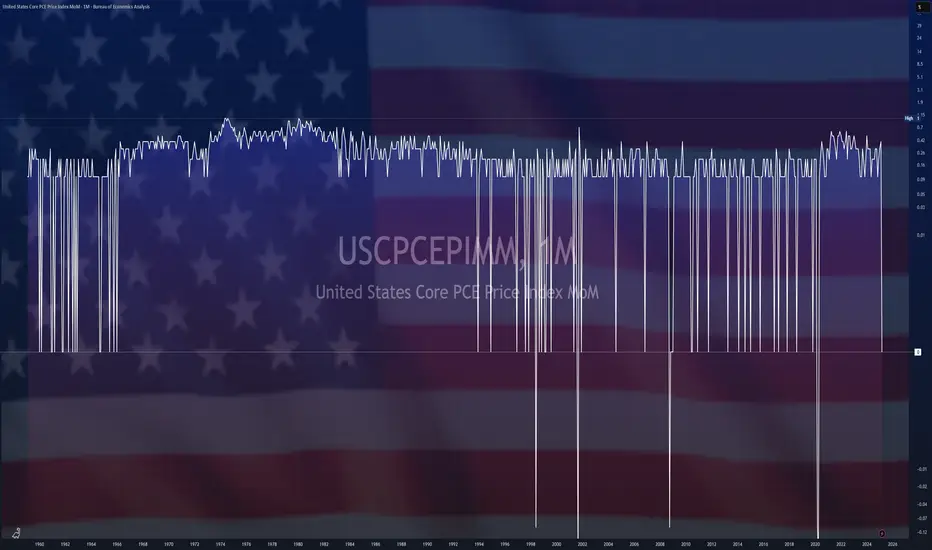
On Thursday, January 22, the Core Personal Consumption Expenditures (PCE) Price Index will be released in the United States. Ahead of the release, we decided to take a deeper dive into macroeconomic theory and revisit what PCE is and how its data influence financial markets.
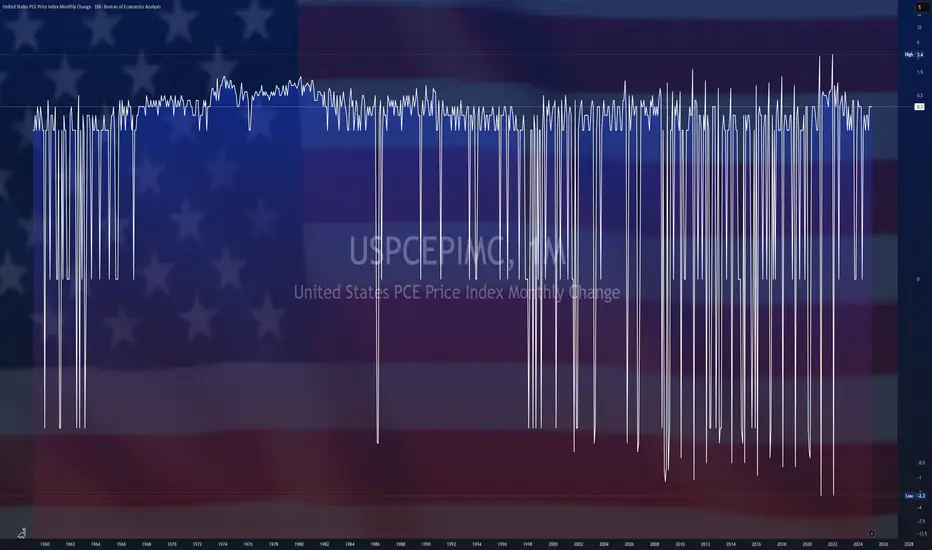
The PCE (Personal Consumption Expenditures) Price Index is a comprehensive measure of inflation that tracks changes in prices for all goods and services consumed by households within the country, regardless of the source of funding. Its conceptual depth lies in the fact that it reflects the actual cost of consumption across the economy, not merely the out-of-pocket expenses of individual consumers.
The Federal Reserve views PCE as its primary gauge of inflationary pressure due to its deeper analytical structure and methodology, which is largely free from certain statistical distortions and explicitly accounts for behavioral aspects of consumer choice.
CPI vs. PCE
While CPI answers the question:
How much more expensive has life become for the average urban consumer?
PCE addresses a broader one:
How much more expensive has total final consumption in the economy become?
This makes PCE more macroeconomically representative. It includes not only household spending, but also expenditures by non-profit institutions serving households.
The core methodological difference between the two indices lies in how they treat consumer behavior.
CPI assumes relative rigidity in consumption habits:
its basket is updated with a lag
its calculation implies that households continue purchasing the same goods even as prices rise, simply paying the higher cost
PCE, by contrast, incorporates rational behavioral flexibility. The Fisher chain-weighted index used in its calculation reweights components on a quarterly basis, reflecting the natural shift in demand toward relatively more affordable substitutes. This substitution effect not only reduces the indicator’s volatility, but also aligns it more closely with real-world consumer spending dynamics, where price changes are a key driver of budget reallocation.
An important clarification regarding the relationship between CPI and PCE:
the two indicators are highly correlated
PCE typically prints slightly lower readings than CPI
this persistent gap is a structural result of methodological differences in how the indices are constructed
What to Focus on in the Release
When CPI data are released, the most reliable way to assess underlying inflation pressure is to focus on Core CPI.
The same logic applies to PCE.
The headline figure (Headline PCE) carries a significant risk of misinterpretation due to its elevated volatility, which can distort the perception of the underlying price trend. Core PCE, stripped of these destabilizing components, serves as a far more reliable compass, pointing to the deeper inflationary forces in the economy — precisely the forces that shape the long-term path of monetary policy.
With this framework in mind, we can move on to a more precise interpretation of the data.
When the report is released, greater emphasis should be placed on the monthly (m/m) Core PCE reading, as it is more sensitive to short-term changes in inflation. Even if inflation accelerates in the current month (a high MoM print), the year-over-year figure may continue to decline for several months due to base effects — comparisons against elevated readings from the prior year.
It is also important to pay close attention to revisions of the previous month’s data.
The market evaluates releases through the lens of trend, which is often just as important — if not more so — than a single data point.
For example, imagine that the current month’s Core PCE comes in exactly in line with consensus at 0.2%. At first glance, this looks benign. However, if the previous month’s figure is revised upward from 0.3% to 0.5%, the picture changes entirely. Such a revision would be inconsistent with the Fed’s 2% inflation target and would undermine the narrative of a smooth and sustained disinflationary trend.
Market Reaction
Market reaction to inflation data is fundamentally driven by expectations of future Federal Reserve actions. A sustained rise in inflation reinforces a hawkish scenario: the Fed is forced to maintain or tighten monetary policy, which leads to higher interest rates, a stronger dollar, rising Treasury yields, and downward pressure on equities.
Conversely, a consistent decline in inflation signals that the Fed’s measures are working and opens a dovish window for potential easing in the future. This implies the prospect of rate cuts, which typically acts as a catalyst for equity markets, while pushing Treasury yields lower and weakening the domestic currency.
However, accurate analysis is impossible without considering the broader macroeconomic context. For instance, if a prevailing trend has already been established by weak labor market data and a soft CPI report, even a neutral PCE release that comes in line with consensus is often interpreted as a confirmation of that trend. In such an environment, the absence of a negative surprise becomes a positive signal in itself, providing additional support for equities.
That said, the key element of analysis remains the probability of a fundamental surprise capable of breaking the existing trend built on earlier releases. Labor market data and CPI set the preliminary direction of expectations, but they do not carry finality. The PCE report, acting as a strategic “closing argument,” carries sufficient weight in the eyes of both the Fed and market participants to trigger a full reassessment of the priced-in scenario. A material deviation from consensus can do more than merely adjust expectations — it can invert the prevailing market logic altogether, leading to a regime shift across currency, bond, and equity markets.
Conclusion
Ultimately, market dynamics are a complex fusion of countless factors whose interactions often defy linear logic. This is precisely why outcomes so frequently diverge from even the most well-reasoned forecasts.
The only way—if not to tame, then at least to comprehend this force—is to develop your own analytical judgment. Critical thinking and the ability to construct an independent view of reality are the most valuable tools in a world with no guarantees and no ready-made solutions. Neither the forecasts of research desks nor the opinions of popular commentators can replace your personal ability to interpret data, weigh risks, and connect fragmented facts into a coherent hypothesis. This is the path from following noise to understanding signal.
Enjoy!

$USGDPQQ - U.S GDP (Q2/2025)ECONOMICS:USGDPQQ 3.8%
Q2/2025
source: U.S. Bureau of Economic Analysis
- U.S Economy expanded an annualized 3.8% in Q2 2025,
much higher than 3.3% in the second estimate,
marking the strongest performance since Q3 2023.
The stronger-than-anticipated figure primarily reflected an upward revision to consumer spending.
PCE rose 2.5% (vs 1.6% in the second estimate), led by a bigger revision for services (2.6% vs 1.2%) while spending on goods remained robust (2.2% vs 2.4%).
Fixed investment was also revised higher (4.4% vs 3.3% in the second estimate), including equipment (8.5% vs 7.4%), intellectual property products (15% vs 12.8%) and structures (-7.5% vs -8.9%).
Residential investment however, fell more (-5.1% vs -4.7%).
Also, government consumption shrank slightly less (-0.1% vs -0.2%).
On the other hand, the contribution from net trade was revised lower, as exports declined at a faster pace (-1.8% vs -1.3%) and imports fell 29.3% (vs -29.8%). In addition, the drag from private inventories worsened (-3.44 pp vs -3.29 pp).

4 Biggest trading opportunities this week This week presents several key events traders should keep a close eye on:
Korean inflation – Monday 6pm
The last reading for SK CPI came in at +2.4% year‑on‑year in October 2025, above the 2.1% expected by economists. Another surprise uptick might reinforce expectations of a rate pause (or even a re‑tightening), which could boost KRW.
Euro inflation – Tuesday 5am
Inflation data out of the eurozone will shape expectations for the European Central Bank (ECB). If inflation remains sticky or rises, it could bolster ECB hawkishness, strengthening EUR and European bond yields.
Australian GDP Growth – Tuesday 7.30am
Australia’s GDP report will offer a snapshot of the local economic picture. A strong GDP print could support the Australian dollar and lift demand for commodity‑linked assets, given Australia’s status as a major commodity exporter.
US PCE – Friday 10am
The upcoming release of the Personal Consumption Expenditures Price Index (PCE) matters because the Fed views it as its preferred inflation gauge. A hotter‑than‑expected PCE could reaffirm caution on rate cuts and lift USD, bond yields, and potentially weigh on risk assets.

Tokyo Core CPI remains unchanged, US PCE Index ticks higherThe Japanese yen has stabilized on Friday. In the North American session, US/JPY is trading at 149.61, down 0.11% on the day. The yen has taken a beating over the past two days, falling 1.5%.
Tokyo Core CPI held steady in September at 2.5% y/y. This matched the downwardly revised August reading and was lower than the market estimate of 2.8%. Tokyo Core CPI excluding food and energy dropped to 2.5%, down sharply from 3.0% in August. Food inflation remains high but eased to 6.9% in September from 7.4% in August.
The Bank of Japan will include this data in the mix when it meets next on October 29-30. Aside from inflation, BoJ policymakers will be looking at the impact of US tariffs on the economy.
The US PCE Price Index, which is the Federal Reserve's preferred inflation indicator, ticked higher in August. Annualized, PCE rose to 2.7%, up from 2.6% in July and in line with the consensus. Monthly, PCE gained 0.3%, up from 0.2% in July and matching the consensus.
With inflation largely under control, the Federal Reserve's priority has shifted to the US labor market. The last two nonfarm payrolls reports showed marginal job growth and missed expectations, raising concerns that the labor market is quickly losing steam. If next week's nonfarm payroll report is soft, it could cement an October rate cut.
USDJPY is testing support at 149.75. Next, there is support at 149.62
There is resistance at 149.89 and 150.02

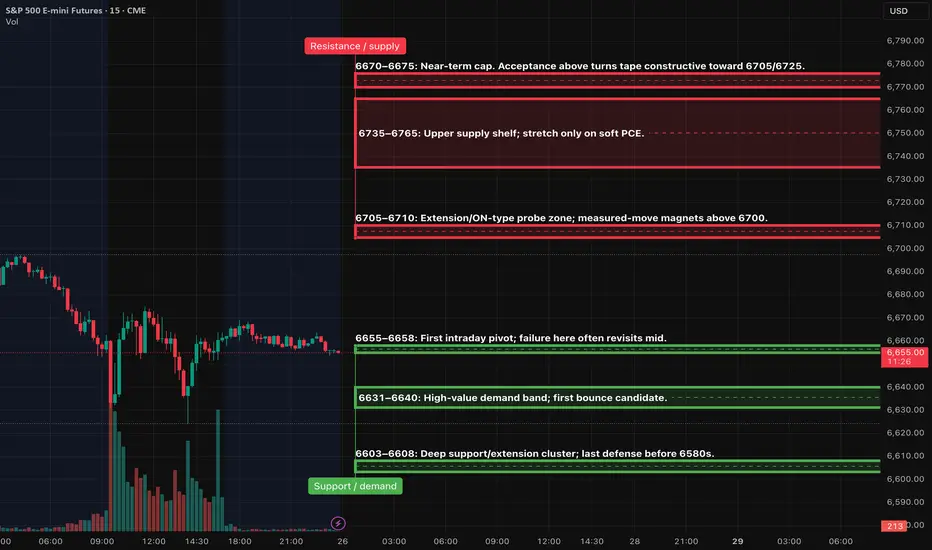
ES Futures (SPX) - Analyses, Key-Zones, Setups - Thu, Sep 26News & catalysts (ET)
8:30 — PCE & Core PCE (Aug) , the Fed’s preferred inflation gauges. Market focus is on Core PCE ~2.9% YoY and ~0.2% MoM consensus.
10:00 — University of Michigan Consumer Sentiment (final Sep) . Scheduled time confirmed by
Fed speakers: Vice Chair for Supervision Bowman in a 10:00 discussion;
Fed Board’s Beth Anne Wilson remarks at 8:45 at a New York Fed conference.
Earnings/overnight tone: Costco (COST) reported FY Q4 results Thu after close; headlines can sway retail/consumer sentiment pre-open. Nike (NKE) is due Tue 9/30 after close (next week).
Bias:
Base case: Two-way trade into 8:30, directional break afterward.
If Core PCE ≤ 0.2% MoM or ≤ 2.8% YoY: risk-on; favor upside continuation through near-term supply toward 6700+.
If Core PCE ≥ 0.3% MoM or ≥ 3.0% YoY: risk-off; favor sell-the-rips into 6630 → 6605 ladder.
Secondary input 10:00: Michigan Sentiment can add a second impulse; weak sentiment keeps rallies fragile.
PA roadmap
Overnight: Expect balance inside 6655–6675 until 8:30. Liquidity likely pools above 6675 and below 6650 for the data sweep.
NY AM (09:30–11:00): Trade the post-8:30 acceptance: continuation if 15m structure accepts beyond a zone; fade if we get swift rejection back inside.
NY PM (13:30–16:00): Look for consolidation breaks toward untested AM extremes; avoid initiating inside mid-range chop.
Setups (Level-KZ Protocol 15/5/1)
A++ Acceptance Long (major)
Trigger: 15m full-body close above 6670–6675, followed by 5m pullback that re-closes above.
Entry: 1m HL after the 5m re-close.
SL: Below the 15m trigger wick −0.25–0.50 pts.
TPs: TP1 6705, TP2 6725, TP3 6760–6765.
Management: No partials before TP1; at TP1 close 70%, set 30% runner to BE; runner aims TP2→TP3. Time-stop 45–60m if neither TP1 nor SL hits.
Invalidation: 15m body back inside 6670 (acceptance lost).
A++ Acceptance Short (major)
Trigger: 15m full-body close below 6655, then 5m pullback that fails and re-closes below.
Entry: 1m LH after the 5m re-close.
SL: Above the 15m trigger wick +0.25–0.50 pts.
TPs: TP1 6631–6635, TP2 6605–6608, TP3 6580–6585.
Management: Same as above.
Invalidation: 15m body back above 6658.
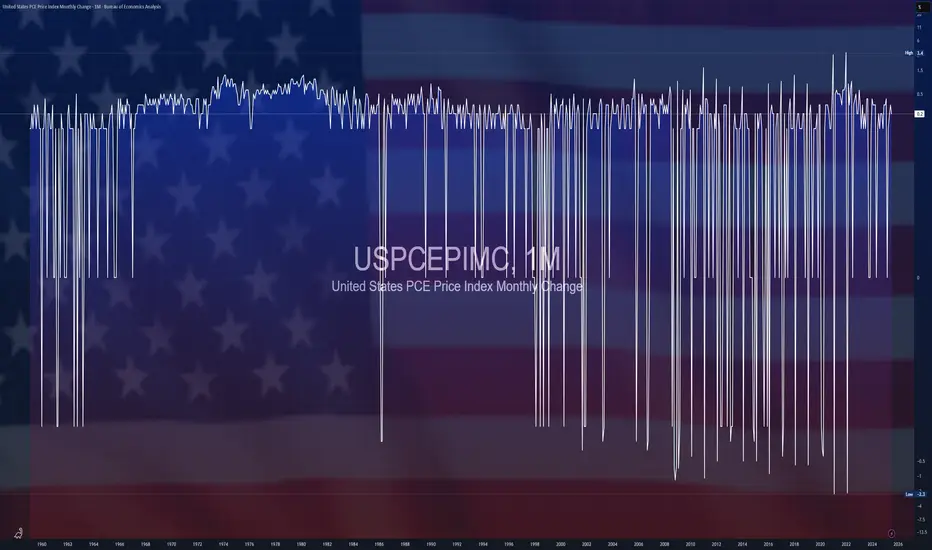
$USPCEPIMC -U.S Producer Prices Rise Slightly (July/2025)ECONOMICS:USPCEPIMC
July/2025
source: U.S. Bureau of Economic Analysis
- The core PCE price index in the US,
which excludes volatile and energy prices and is Federal Reserve's chosen gauge of underlying inflation in the US economy, went up 0.3% from the previous month in July of 2025.
It was the same as in June, in line with market expectations.
From the previous year, the index rose by 2.9%, the highest in five months.
All eyes on the PCE todayWatching the US dollar reaction carefully today.
TVC:DXY
MARKETSCOM:DOLLARINDEX
Let us know what you think in the comments below.
Thank you.
75.2% of retail investor accounts lose money when trading CFDs with this provider. You should consider whether you understand how CFDs work and whether you can afford to take the high risk of losing your money. Past performance is not necessarily indicative of future results. The value of investments may fall as well as rise and the investor may not get back the amount initially invested. This content is not intended for nor applicable to residents of the UK. Cryptocurrency CFDs and spread bets are restricted in the UK for all retail clients.

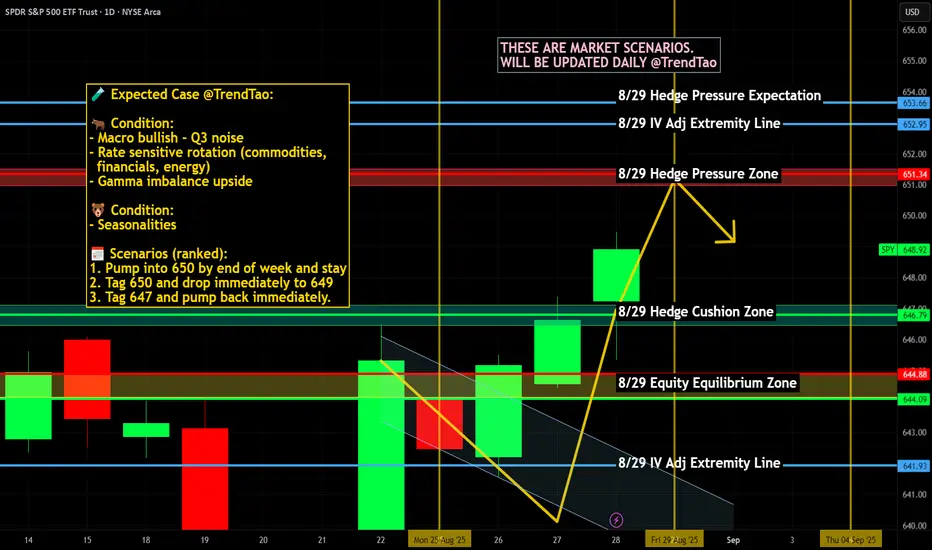
$SPY / $SPX Scenarios — Friday, Aug 29, 2025🔮 AMEX:SPY / SP:SPX Scenarios — Friday, Aug 29, 2025 🔮
🌍 Market-Moving Headlines
🔥 Fed’s favorite inflation gauge hits: PCE arrives just as markets digest Powell’s Jackson Hole tone.
💵 Consumer under the microscope: Spending & income data reveal demand strength heading into fall.
🏭 Regional PMI wrap: Chicago PMI closes out August with a manufacturing pulse check.
📊 Key Data & Events (ET)
⏰ 8:30 AM — PCE Price Index (Jul)
⏰ 8:30 AM — Personal Income & Outlays (Jul)
⏰ 9:45 AM — Chicago PMI (Aug)
⏰ 10:00 AM — UMich Consumer Sentiment (Final, Aug)
⚠️ Disclaimer: Educational/informational only — not financial advice.
📌 #trading #stockmarket #SPY #SPX #PCE #inflation #Fed #bonds #economy #PMI #consumerconfidence
Gold Surges Amid Fed Drama & Key Data: Buy or Sell Now?Fundamental Analysis: What’s Shaking Up Gold Prices?
USD Index Up 0.2%: A stronger dollar makes gold pricier for foreign buyers, creating short-term pressure. But don’t worry—gold remains the ultimate safe-haven in times of uncertainty! 📉
US Treasury Yields Rise 0.4%: Higher yields make non-yielding gold less attractive. Still, with persistent inflation, gold’s allure as a hedge stays strong! ⚖️
Fed Drama: Trump vs. Lisa Cook: Earlier this week, Trump announced plans to oust Fed Governor Lisa Cook from the Board of Governors. Cook’s legal team fired back, filing a lawsuit to block her removal, setting the stage for a prolonged legal battle. The result? Gold surged to a 2-week high on August 26 following this news. Political uncertainty = Rocket fuel for gold! 🔥🇺🇸
Key Economic Data on the Horizon: Investors are on edge awaiting GDP data today (28/08) and the PCE index—Fed’s favorite inflation gauge—on 29/08. Reuters’ poll forecasts PCE inflation at 2.6% for July 2025, matching June’s level. If the data comes in softer than expected, the Fed might cut rates, sending gold soaring! 📊 What’s your take on the Fed’s next rate move?
Technical Analysis: Bullish Trend Intact, But Watch for a Pullback!
Gold continues its bullish run, breaking through the 3393 level with a clear BOS (Break of Structure), signaling the uptrend is alive and well! However, price is hesitating around the 340x resistance zone, with risks of a sharp pullback at any moment. Strategy: BUY short-term to ride the momentum, but be ready to SELL on signs of a structural reversal. Don’t miss out! 📉📈
Key Resistance: 3399 - 3405
Key Support: 3393 - 3385 - 3381 - 3374 - 3363 - 3352
Sell Zone: 3403 - 3405
SL: 3410
TP: 3399 - 3393 - 3385 - 3381 - 3374
Buy Zone: 3375 - 3373
SL: 3369
TP: 3381 - 3385 - 3393 - 3400
#Gold #XAUUSD #TradingView #Fed #Trump #PCE #GDP #GoldTrading #Finance #Investing #TechnicalAnalysis #MarketUpdate #Crypto #Forex

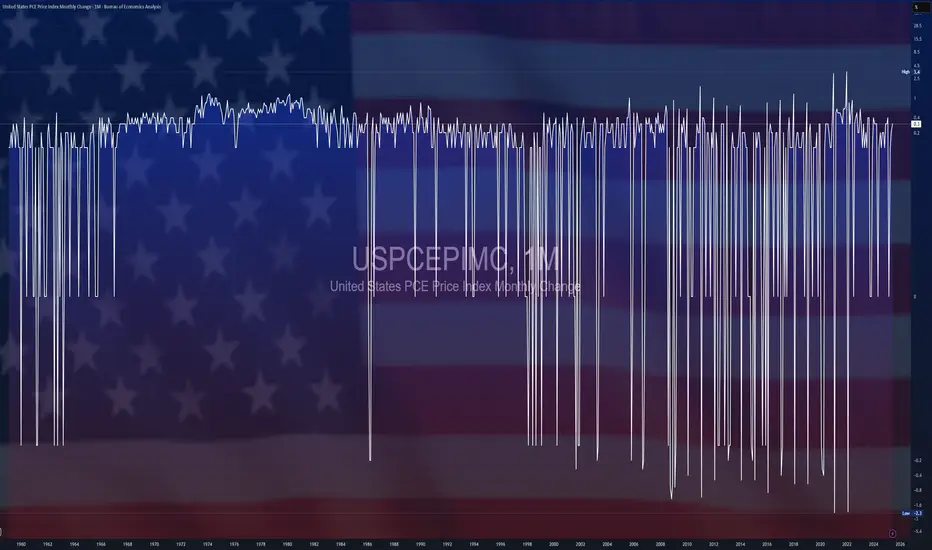
$USPCEPIMC -U.S PCE Prices Rise (June/2025)ECONOMICS:USPCEPIMC
June/2025
source: U.S. Bureau of Economic Analysis
- The US PCE price index rose by 0.3% mom in June, the largest increase in four months, and in line with expectations, led by prices for goods.
The core PCE index also went up 0.3%, aligning with forecasts.
However, both the headline and core annual inflation rates topped forecasts, reaching 2.6% and 2.8%, respectively.
Meanwhile, both personal income and spending edged up 0.3%.
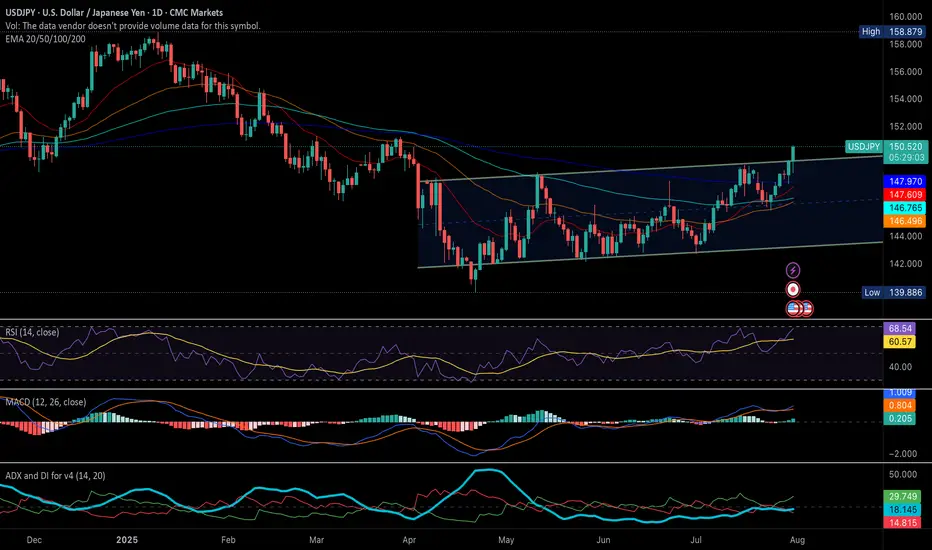
BoJ keep interest rate unchanged, yen weakeningFollowing the July meeting, the BoJ maintained its interest rate at 0.5%, citing prevailing uncertainties from trade tariffs. Concurrently, the BoJ revised its inflation forecast upward to 2.7% YoY from 2.2%. The central bank's language on economic uncertainty has become less pessimistic, downgrading trade policy risks from "extremely high" to "high uncertainties remain," which signals a growing, albeit cautious, confidence in the economic outlook.
In the US, the June PCE surged to 2.6% YoY, surpassing the 2.5% prev. cons. The increase was attributed to tariff impacts, with Goods prices rising 0.4% MoM, the fastest pace since January, while Services prices held steady at 0.2% MoM.
The higher-than-expected US PCE data and the BoJ's decision to hold interest rates have continued to drive further appreciation of the USDJPY.
USD/JPY Technical Analysis
The USD/JPY pair is trading above its EMAs extensions, signaling a continuation of the bullish momentum. The price has successfully breached the ascending resistance trendline. However, the RSI is in overbought territory, suggesting that the current rally may be extended, and a potential pullback could be imminent.
The pair could continue to test the resistance level at 151.367. Should it fail to break this level, a rebound could see the USD/JPY pair test the support at 149.65.
By Van Ha Trinh - Financial Market Strategist at Exness
German CPI flatlines, eurozone CPI nextThe euro is up for an eighth consecutive day and has gained 2.4% during that time. In the North American session, EUR/USD is trading at 1.1738, up 0.36% on the day.
German inflation data on Monday pointed to a weakening German economy. The CPI report indicated that the deflationary process slowly continues. The inflation rate for June came in at 0% m/m, down from 0.1% in May and below the consensus of 0.2%. Annually, inflation dropped to 2.0% from 2.1% and below the consensus of 2.1%. The eurozone releases its CPI report on Tuesday.
Inflation has been dropping in small increments and has now fallen to the European Central Bank's inflation target of 2%. The ECB cut the deposit rate to 2.0% earlier in June and meets next in July. Although eurozone inflation is largely contained, there are concerns about the impact that US tariffs and counter-tariffs by US trading partners could have on the inflation picture. The ECB is likely to maintain rates in July but could lower rates in September if disinflation continues.
The US continues to show signs that the economy is slowing down. Last week, GDP was revised downwards to -0.5% in the first quarter. This was followed by US consumer spending for May (PCE) which posted a 0.1% decline, following a 0.2% gain in April and shy of the consensus of 0.1%. This was the first contraction since January. If economic data continues to head lower, pressure will increase on the Federal Reserve to lower interest rates, which isn't expected before the September meeting.
EUR/USD is testing resistance at 1.1755. Above, there is resistance at 1.1791
1.1718 and 1.1682 are the next support levels

Yen rises sharply, Tokyo Core CPI nextThe Japanese yen has edged higher on Friday. In the North American session, USD/JPY is trading at 144.57, up 0.16% on the day.
Tokyo Core CPI surprised on the downside in June, falling to 3.1% y/y. This was down sharply from the 3.6% gain in May and below the market estimate of 3.3%. This was the the first slowdown in Tokyo core inflation since February. The decline was largely driven by a renewal of fuel subsidies and a reduction in water charges.
Despite the drop, core inflation remains well above the Bank of Japan's 2% target, maintaining expectations for another rate hike in the second half of the year. BoJ Governor Ueda has signaled that the Bank will raise rates if it is confident that wage growth is sustained, which is critical to maintaining inflation at the 2% target. However, this week's BOJ Summary of Opinions showed that some members are more dovish, given global trade tensions and the bumpy US-Japan trade talks. Japan has said it will not agree to US tariffs of 25% on Japanese cars, and six rounds of talks in the past two months have failed to produce a deal.
The Core PCE Price Index, the Fed's preferred inflation indicator, accelerated in May and was higher than expected. The index rose 2.7% y/y up from an upwardly revised 2.6% in May and above the consensus of 2.6%. Monthly, the index rose 0.2%, up from 0.1% which was also the consensus. This was a three-month high and will boost the case for the Fed to leave interest rates unchanged at the July meeting.
USD/JPY faces resistance at 144.49 and 144.64
144.31 and 144.16 are the next support levels

PCEs & attacks on PowellWe are carefully monitoring the PCEs today, to see, "wins" this small battle in the rate-lowering war. Let's dig in.
Let us know what you think in the comments below.
Thank you.
77.3% of retail investor accounts lose money when trading CFDs with this provider. You should consider whether you understand how CFDs work and whether you can afford to take the high risk of losing your money. Past performance is not necessarily indicative of future results. The value of investments may fall as well as rise and the investor may not get back the amount initially invested. This content is not intended for nor applicable to residents of the UK. Cryptocurrency CFDs and spread bets are restricted in the UK for all retail clients.

Can PCE data rescue the dollar? JPY, EUR, GBP setup in playThe latest U.S. PCE report is set for release at 8:30am EDT, with both headline and core inflation expected at 0.1% month-on-month.
As the Fed’s preferred inflation measure, today’s figures could influence interest rate expectations. A stronger print may reduce the case for a July rate cut, while a softer result could add pressure on the U.S. dollar.
The dollar has already weakened this week amid speculation over central bank independence (trump is reportedly considering nominating Fed chair Jerome Powell’s successor earlier than normal in order to undermine the current chair).
Pairs to watch include, EUR/USD, GBP/USD, USD/JPY with symmetrical triangle formations suggesting breakout potential in either direction for all once the data hits.

$USPCEPIMC -U.S Core PCE (April/2025)ECONOMICS:USPCEPIMC
April/2025
source: U.S. Bureau of Economic Analysis
-The core PCE price index in the US, which excludes volatile and energy prices and is Federal Reserve's chosen gauge of underlying inflation in the US economy,
went up 0.1% from the previous month in April of 2025.
The result was in line with market expectations.
From the previous year, the index rose by 2.5% to slow from the 2.7% jump from March, the softest increase since March of 2021.

$USPCEPIMC -U.S PCE Inflation Slows as Expected (March/2025)ECONOMICS:USPCEPIMC -U.S PCE Inflation Slows as Expected (March/2025)
ECONOMICS:USPCEPIMC
March/2025
source: U.S. Bureau of Economic Analysis
-The personal consumption expenditure price index in the US was unchanged in March from February 2025, the least in ten months, and following a 0.4% rise in each of the previous two months, in line with expectations.
Prices for goods fell 0.5%, after a 0.2% increase in February and prices for services went up 0.2%, easing from a 0.5% rise.
Meanwhile, the core PCE index, which excludes volatile food and energy prices, was also unchanged, compared with forecasts for a 0.1% increase.
Separately, food prices rose 0.5% (vs a flat reading) while prices for energy goods and services dropped 2.7% (vs 0.1%).
Finally, the annual PCE rate decreased to 2.3%, the lowest in five months, and the annual core PCE inflation also eased to 2.6%.
$USPCEPIMC -U.S Core PCE Inflation Rises More than ExpectedECONOMICS:USPCEPIMC
(February/2025)
source: U.S. Bureau of Economic Analysis
- The US PCE price index rose by 0.3% month-over-month in February, maintaining the same pace as the previous two months.
The core PCE index increased by 0.4%, the most since January 2024, surpassing the forecast of 0.3% and up from 0.3% in January.
On a year-over-year basis, headline PCE inflation remained steady at 2.5%, while core PCE inflation edged up to 2.8%, above the expected 2.7%.
GOLD knocking on heaven's door againAnd once again we are at the spot, where MARKETSCOM:GOLD is trying to go for another all-time high. Will we see another strong push, or is it time for the commodity to slow down and retrace? Let's dig in!
TVC:GOLD
Let us know what you think in the comments below.
Thank you.
74.2% of retail investor accounts lose money when trading CFDs with this provider. You should consider whether you understand how CFDs work and whether you can afford to take the high risk of losing your money. Past performance is not necessarily indicative of future results. The value of investments may fall as well as rise and the investor may not get back the amount initially invested. This content is not intended for nor applicable to residents of the UK. Cryptocurrency CFDs and spread bets are restricted in the UK for all retail clients.

$USPCEPIMC -U.S Price Index (January/2025)ECONOMICS:USPCEPIMC 0.3%
(January/2025)
source: U.S. Bureau of Economic Analysis
- The US Personal Consumption Expenditures (PCE) price index increased by 0.3% month-over-month in January 2025, the same pace as in December, and in line with expectations.
Prices for goods increased 0.5%, following a 0.1% rise in December and prices for services rose at a slower 0.2%, after a 0.4% gain in the previous month.
Meanwhile, the core PCE index, which excludes volatile food and energy prices, rose 0.3%, slightly above the 0.2% gain recorded in the previous month, and also matching forecasts.
Food prices went up 0.3%, higher than 0.2% in December while cost of energy eased (1.3% vs 2.4%). On a year-over-year basis, headline PCE inflation eased to 2.5% from 2.6%, marking its first slowdown in four months. Similarly, core PCE inflation declined to 2.6%, its lowest level in seven months, from an upwardly revised 2.9%.

EURUSD 28 Feb 2025 W9 -Intraday Analysis- US PCE Day! EOM FlowsThis is my Intraday analysis on FOREXCOM:EURUSD for 28 Feb 2025 W9 based on Smart Money Concept (SMC) which includes the following:
Market Sentiment
4H Chart Analysis
15m Chart Analysis
Market Sentiment
Heavy economic news:
EU : German Prelim CPI m/m
US : the most awaited report Core PCE Price Index m/m - Personal Spending m/m - Chicago PMI
The market sentiment detailed as following:
Trump's Tariff Announcements:
President Trump's announcements regarding new and increased tariffs significantly impacted market sentiment. Uncertainty surrounding trade relations with various countries, including the European Union, Mexico, and Canada, created volatility.
These tariff announcements created fears of trade wars, which negatively impacted investor confidence.
Economic Data:
Reports of declining new home sales in the U.S. and concerns about overall economic health contributed to market unease.
Also, the release of various economic data points, and the anticipation of the PCE inflation data release, influenced market movement.
NVIDIA's Performance and AI Competition:
While NVIDIA beat earnings estimates, concerns about increased competition from Chinese AI companies, particularly DeepSeek, led to a significant drop in its stock price, impacting the broader tech sector.
Geopolitical Uncertainty:
Geopolitical factors, such as the removal of Chevron's oil license in Venezuela, contributed to fluctuations in commodity prices, particularly oil.
Bank of Japan governor Ueda's statements regarding the uncertainty of US policies also added to uncertainty.
Additional Factors:
Geopolitical Resolution: A sudden de-escalation in a prior crisis (e.g., eased tensions in a conflict zone) might have reduced safe-haven demand for gold, though this was secondary to dollar strength.
Technical Factors: End-of-month rebalancing or options expirations could have amplified downward moves.
The interplay of a hawkish Fed, a resilient dollar, and risk aversion triggered broad-based declines. The overarching theme was a recalibration of investor expectations around tighter monetary policy and its implications for global growth and asset valuations.
4H Chart Analysis
1️⃣
🔹Swing Bullish (Reached Swing Extreme Demand)
🔹INT Bearish (Adjusted my INT structure to align with the previous Bullish move)
🔹Complex Swing INT Structure
2️⃣
🔹As the Swing is Bullish, expectations were set to continue Bullish targeting the Weak Swing High and create a Bullish BOS after the Deep Pullback to the Swing Demand.
🔹During the Swing Bullish Continuation after the Deep Pullback, INT Structure kept holding Bullish to fulfill the Bullish continuation phase.
🔹With price reaching the Swing Extreme Premium zone and the expectation of breaking the Weak Swing High, price failed 2 times and with the 3rd attempt it created a Bearish iBOS. This indicated that the Swing INT structure is Complex and the Daily/Weekly TFs are still in play.
3️⃣
🔹After the Bearish iBOS, we expect PB, there is no clear POI for price to initiate PB except the Liq. at 1.03730 and 1.03173 before mitigating the last clear 4H Demand.
🔹It’s not a must to reach these Liq. points as we already in a Daily partially mitigated Demand Zone and maybe some orders reside there. But Will need LTFs to show clear Bullish OF to confirm the 4H Bearish INT structure is staring the PB.
🔹Expectations is set to Bearish continuation till we have a clear Bullish OF. Also, keep in mind that Daily and Weekly are still Bearish and we may target the 4H Strong Swing Low to fulfill the Daily and Weekly move.
15m Chart Analysis
1️⃣
🔹Swing Bearish
🔹INT Bearish
🔹Swing Pullback
2️⃣
🔹Swing structure turned Bearish with confirmed BOS. And after BOS we expect PB phase to start.
🔹We didn’t mitigate any HP POI/Liq. to initiate the Swing PB phase.
🔹Will need a clear INT Structure shift to Bullish with momentum in order to play the PB phase otherwise price will continue Bearish till the sweep of Liq. on the 4H TF at 1.03730 and 1.03173 before tapping the clear 4H Demand.
3️⃣
🔹Expectations is set to continue Bearish with cautious from the Swing PB phase that can start at any time.
🔹Also keep in mind the End of Month Flows and PCE report today.

EURUSD 24-28 Feb 2025 W9 - Weekly Analysis - US GDP / PCE Week!This is my Weekly analysis on EURUSD for 24-28 Feb 2025 W9 based on Smart Money Concept (SMC) which includes the following:
Market Sentiment
Weekly Chart Analysis
Daily Chart Analysis
4H Chart Analysis
Economic Events for the Week
Market Sentiment
Inflation Data Dominates
Hotter-than-expected U.S. CPI/PPI initially fueled inflation fears, but signs of moderation in underlying PPI components raised hopes for softer PCE data next week.
Investors see a growing chance of Fed rate cuts in late 2025, limiting USD strength.
Tariff Noise vs. Market Calm
Trump’s tariff threats (e.g., reciprocal steel/aluminum duties) were largely dismissed as negotiation tactics, easing fears of an immediate trade war.
Markets expect delays in implementation, reducing near-term volatility.
Geopolitical Progress Supports Risk Sentiment
Reports of progress in Ukraine-Russia peace talks (e.g., territory swaps) reduced safe-haven demand for the USD, indirectly boosting the Euro.
Stabilizing energy prices and supply chains further supported the Eurozone outlook.
Central Bank Divergence
The Fed remains cautious, emphasizing data dependency, while the ECB signals potential rate cuts later in 2025.
Short-term EUR resilience stems from reduced trade-war risks and improving Eurozone economic data.
Focus on Upcoming Catalysts
This week PCE inflation report (Fed’s preferred gauge) will test disinflation optimism.
Weak U.S. retail sales/industrial production amplified concerns about slowing growth, weighing on the USD.
Key Takeaways
Bullish Drivers:
Progress in geopolitical tensions.
Softening inflation expectations ahead of PCE data.
Tariffs seen as negotiation tools, not immediate threats.
Bearish Risks:
A hot PCE report reviving Fed hawkishness.
Sudden tariff escalations or breakdowns in peace talks.
Overall Sentiment:
Cautiously bullish for EUR/USD this week, with upside hinging on sustained risk appetite and confirmation of disinflation trends.
Weekly Chart Analysis
1️⃣
🔹Swing Bearish
🔹Internal Bearish (Pullback Phase)
🔹In Swing Discount
🔹Swing Continuation Phase (Pro Swing + Pro Internal)
2️⃣
🔹INT structure continuing bearish with iBOS following the Bearish Swing. (End of 2023 till end of 2024 was a pullback phase after the first bearish iBOS)
3️⃣
🔹After the bearish iBOS we expect a pullback, price tapped into Monthly Demand and the liquidity below Nov 2022 which is above the weekly demand formed with the initiation of the bearish iBOS pullback phase.
🔹Price made a bullish CHoCH which indicated that the liquidity was enough as per previous weeks analysis to initiate a pullback phase for the bearish iBOS.
🔹Price pulled back after the Bullish CHoCH to the Weekly Demand formed and showed reaction after volatile week.
🔹With the previous week solid Bullish close, the Demand did hold and there is a high probability that price could continue Bullish to facilitate the INT structure pullback phase.
🔹If price to continue Bullish, price will be targeting the liquidity above Dec 2024, INT Structure EQ (50%) at 1.06933 to target the Weekly Supply in premium before continuing down to target the Weak INT Low.
🔹Expectations is for price to continue Bullish if it managed to break 1.05333 27 Jan High to facilitate the INT structure pullback.
Daily Chart Analysis
1️⃣
🔹Swing Bearish
🔹INT Bearish
🔹Swing Continuation Phase (Pro Swing + Pro Internal)
2️⃣
🔹Following the Bearish Swing BOS, INT Structure continuing bearish tapping the weekly demand zone.
3️⃣
🔹After the failure to close below the Weak INT Low, price continued bullish sweeping the liquidity above Dec 30 and mitigating a Daily supply zone within the INT Structure Premium Zone.
🔹With the mitigation of the Daily supply, price created a Bearish CHoCH signaling the end of the Pullback Phase of the INT structure and the start of the Bearish move targeting the Weak INT Low.
🔹Price failed for the 2nd time to close below the Weak INT Low after mitigating the Daily Demand formed from the failure to close below the Weak INT Low which triggered aggressive Bullish reaction and mitigating the Daily Supply Zone formed from the recent Bearish CHoCH.
🔹After Supply mitigation, price continued Bearish following the Bearish INT Structure continuation phase.
🔹Previous week I mentioned “if the Daily formed a Bullish CHoCH (Currently above the recent mitigated Supply) this will shift my outlook to the Weekly Scenario of a deep pullback of the Weekly INT Structure to at least the Structure EQ (50%). MTF required to shift Bullish to confirm”. And with that happened I’d shifted to Bullish expectation and there is expectations of a deep pullback within the Daily Bearish INT structure.
🔹The expected targets for the current bullish move is 1st to sweep the liquidity above the equal highs (17 Dec & 27 Jan) 2nd Break of the Strong INT High to facilitate the Daily Bearish Swing pullback and the Weekly Bearish INT pullback.
🔹Currently Supply is failing and Demand is holding confirms the short-term Bullish scenario and setting my expectations for continuing Bullish. Price had pulled back to the recent Daily Demand and continued Bullish.
4H Chart Analysis
1️⃣
🔹Swing Bullish (Reached Swing Extreme Demand)
🔹INT Bearish (Reached Extreme Supply)
🔹INT-INT Bullish (Reached EQ (50%)
🔹Swing Continuation
2️⃣
🔹With the deep pullback to the Bullish Swing extreme discount and mitigating the 4H/Daily demand zones, price turned Bullish forming a Bullish CHoCH.
🔹The current Bullish move from Swing extreme discount to current price level having 2 scenarios (Previously I’d the following 2 scenarios where now I favors the 2nd scenario due to the impulsive nature of the move):
Scenario 1: Pullback for Bearish INT Structure and with the recent Bearish CHoCK and Minor Demand zones are failing, I expect Bearish continuation to target the Weak INT Low which aligns with the Daily/Weekly Bearish Structure/Move. (Counter Swing – Pro Internal)
Scenario 2: Bullish Swing continuation to target the Weak Swing High. Which requires to have Demand holding and Supply failing. The first sign required to confirm this scenario will be the current Demand which price is currently at to hold and we form a Bullish CHoCH. (Pro Swing – Counter Internal)
🔹As expected yesterday, price managed to continue Bullish after reaching the INT-INT structure EQ (50%) in a solid impulsive move aligns with the Swing continuation move.
3️⃣
🔹Still expectation is set to continue Bullish targeting the Weak Swing High as long LTFs holds Bullish structures. Also, In my mind I’m not neglecting the current Bearish 4H INT structure and we already reached that structure extreme where we are getting the current corrective Bearish OF.
Economic Events for the Week
