PENDLE/USDT at Critical Weekly Support — Reversal or Breakdown?PENDLE/USDT on the Weekly (1W) timeframe is currently moving inside a descending channel after printing its previous macro top. Price has now returned to a strong historical demand zone (yellow box) at 2.15 – 1.80, which acts as a key decision area for the next major move.
This zone previously served as a base before a strong bullish impulse, making it a critical level to watch.
---
Pattern Explanation
The price structure forms a Descending Channel (Bearish Continuation / Potential Reversal Structure) characterized by:
Consistent lower highs at the channel resistance
Gradual lower lows toward support
Current price positioned at the lower boundary of the channel + weekly demand
This confluence creates two possible outcomes:
Bullish reversal if demand holds
Further breakdown if demand fails
---
Key Levels
Major Demand Zone (Support): 2.15 – 1.80
Mid-Channel Resistance: ~3.00 – 3.30
Upper Channel Resistance: 4.80 – 5.50
Weekly High Reference: 7.53
Critical Breakdown Level: Below 1.80
---
Bullish Scenario
The bullish scenario remains valid as long as price holds above the 2.15 – 1.80 demand zone, supported by:
Strong weekly rejection or long lower wicks
Formation of a higher low on higher timeframes
A confirmed breakout and close above the mid-channel resistance
Potential Bullish Targets:
1. 3.00 – 3.30 (mid-channel reaction zone)
2. 4.80 – 5.50 (upper channel resistance)
3. 7.00+ if a full channel breakout occurs with strong volume
This area may act as a weekly accumulation zone before the next expansion phase.
---
Bearish Scenario
The bearish scenario activates if:
A weekly candle closes decisively below 1.80
Demand fails to produce meaningful buying pressure
Breakdown is confirmed with increased volume
Potential Bearish Targets:
1. 1.50 – 1.40
2. 1.10 – 1.00
3. Deeper historical support zones if overall market sentiment weakens
A breakdown below this demand would indicate distribution failure and continuation of the medium-term downtrend.
---
Conclusion
PENDLE/USDT is currently trading at a major weekly decision zone.
The 2.15 – 1.80 area will determine whether price forms a bullish reversal from demand or continues its broader bearish structure.
Waiting for weekly candle confirmation and applying proper risk management is crucial at this level.
---
#PENDLE #PENDLEUSDT #CryptoAnalysis #WeeklyChart #DescendingChannel #DemandZone #SupportResistance #AltcoinAnalysis #MarketStructure #PriceAction
Pendlesignals

PENDLE/USDT - Major Reversal or Major Breakdown?Pendle is now approaching one of the most critical areas on its entire weekly chart.
After topping near 7.5 and forming a long distribution phase, price is sliding back toward the historical origin of its previous bull cycle — the 1.05–0.80 demand zone.
This yellow zone is not just another support.
It’s the level that changed Pendle’s trajectory once before.
---
🧩 Macro Structure: What’s Really Happening?
2022 → Early 2023: Long accumulation base.
2023 → 2024: Explosive breakout and trending bull phase.
2024 → 2025: Distribution, weakening structure, lower highs forming.
Now: Price retracing toward the most critical weekly demand zone.
Why is 1.05–0.80 such a big deal?
Because this is where:
The previous bullrun began
Major volume and liquidity were absorbed
Smart money positioned before the breakout
If the zone holds → history could repeat.
If it breaks → the long-term bullish structure collapses.
---
🟢 Bullish Scenario — Could This Become a New Macro Higher Low?
A bullish case activates if:
1. Price taps 1.05–0.80 and rejects strongly
– A weekly candle with a long lower wick would be a powerful early signal.
2. Weekly close stays above the zone
– Confirms that demand still dominates here.
3. Recovery targets are as follows:
First reclaim: 2.7
Structural resistance: 4.0
Full recovery region: 6.0–7.5
If this happens, the chart would form a new macro higher low, potentially triggering a long-term bullish reversal.
This is exactly where institutions and early-cycle buyers may step back in.
---
🔴 Bearish Scenario — Breakdown Toward Deeper Liquidity Zones?
A bearish continuation is confirmed if:
1. Weekly close breaks below 0.80 with conviction
– This signals full momentum shift to sellers.
2. Retest fails to reclaim the zone
– Validates a clean supply-flip.
3. Downside targets become:
0.45 → midrange structural support
0.20–0.12 → major historical demand
Below this lies deep capitulation territory
Losing 0.80 would mark the official breakdown of Pendle’s multi-year bullish structure.
---
🎯 Why the 1.05–0.80 Zone Is So Important
Because it is:
A macro decision point for market direction
A battle zone between smart money and retail liquidity
The origin of the previous bull market
The clearest weekly level on the entire chart
This is the type of zone that determines the direction of the next several months.
---
📌 Conclusion
Pendle enters one of its most critical phases.
The 1.05–0.80 zone is not merely “support” — it is the major pivot that will decide whether:
Pendle is preparing for a large-scale weekly reversal,
or
Pendle is sliding into a deeper corrective phase toward 0.45 → 0.20.
On the weekly timeframe, every reaction is amplified and highly meaningful.
---
#Pendle #PENDLEUSDT #CryptoAnalysis #MarketStructure #PriceAction #WeeklyChart #CryptoOutlook #SupportAndResistance #CryptoBreakdown #CryptoReversal

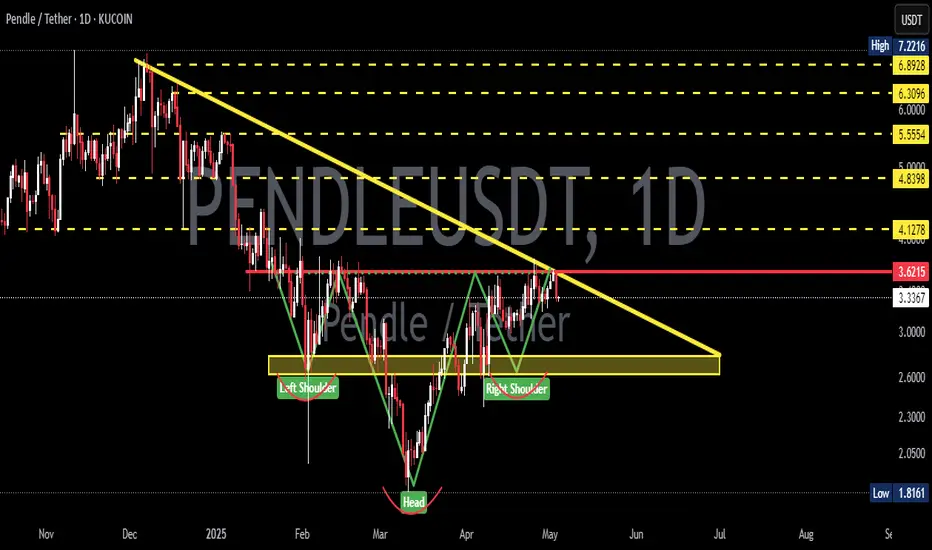
PENDLEUSDT 2D AnalysisPENDLE ~ 2D Analysis
#PENDLE Buy when re -testing this support block or buy after successfully penetrating this resistant line with a short -term target of at least 10%+.
PENDLEUSDT 3DPENDLE ~ 3D
#PENDLE So far it still continues to maintain this support block. If you still have Conviction on this coin,. Buy from here with a minimum target of 20%++

PENDLE target $8.64h time frame
-
Entry: $3.9
TP: $8.6
SL: $3.05
RR: 5.41
-
(1) PENDLE is building a descending wedge which is a standard correction from previous pump
(2) Currently stand on a comparable low point
(3) Fibonacci provides first target at $8.6 and final target at $12.5
(4) Stop loss once going below $3.05

PENDLEUSDT 5DPENDLE Update ~ 5D
#PENDLE In the 5D Time Frame it forms a rounding bottom pattern. If you still have Conviction on this coin, Buy gradually after breaking through this resistance block. New highs are only a matter of time.

PENDLE target 74h time frame
-
Entry: $3.7
TP: $7
SL: $3.03
RR: 4.93
-
(1) Completed first wave; Doing second wave; Ready for third wave (Refer to following link)
(2) Big bottom head and shoulders pattern is creating
(3) Got support twice at fib projection 0.618, but be careful the possibility to reach 0.5
(4) Target for fib projection is $7
(5) Stop loss once going below $3.03
-
Previous Analysis-PENDLE reached target

PENDLEUSDTPENDLE ~ 3D ✅
#PENDLE On the 3D Time Frame a Bullish Pennant Pattern is formed.
✅ Make purchases gradually in this pattern. with a minimum target of 20%+

PENDLE target 4.66(short-term)4h time frame
-
Entry: $2.7
TP: $4.66
SL: $2.15
RR: 3.56
-
(1) Potential bullish flag on 4h
(2) Got support around Fib 0.382, high possibility reach 1.618 if stop falling here
(3) Fib 1.618 is also overlapped with structural resistance at $4.66
(4) Stop loss once going below $2.1

PENDLE target 8.9712h time frame
-
TP: $8.97
SL: $4.49
RR: 8.76
-
(1) Convergence pattern is be building. *two potential support lines
(2) 0.382 fibonacci projection at $3.8
(3) Target matches fibonacci projection_0.382 & fibonacci extension_2.618
(4) Stop loss while triangle bottom got breaking down

PENDLEUSD 3DPENDLE ~ 3D
#PENDLE Buy after successfully breaking the Resistance Line on this pattern or buy on retest of $3.85 support. Minimum target 20%+

PENDLEUSD Strong Buy Signal. Target $12.Pendle (PENDLEUSD) is on a short-term pull-back after the 1D RSI got overbought above 70.00. This is consistent with all previous times the RSI got that overbought but against common sentiment, which would suggest exhaustion of the bullish trend, that was a signal to buy halfway through the Bullish Leg.
As you can see on the two Legs before, that signal emerged at around 50% of the uptrend. As a result, we expect at least $12.000 before the next consolidation.
-------------------------------------------------------------------------------
** Please LIKE 👍, FOLLOW ✅, SHARE 🙌 and COMMENT ✍ if you enjoy this idea! Also share your ideas and charts in the comments section below! This is best way to keep it relevant, support us, keep the content here free and allow the idea to reach as many people as possible. **
-------------------------------------------------------------------------------
💸💸💸💸💸💸
👇 👇 👇 👇 👇 👇
