PENDLE Technical Outlook (Long-Term)The global OKX:PENDLEUSDT chart continues to respect a well-defined channel.
📌 Current price action is located near the lower boundary of the channel, a region that historically preceded medium- to long-term upward impulses.
🔹 Conservative technical target:
• Upper channel zone near $6.50
• Potential upside: +240–250%
• Implied market cap: $900M–$1B (from ~$300M currently)
🔹 Extended bullish scenarios:
If momentum accelerates and broader market conditions improve, higher targets such as $14 or even $214 could come into play — though these would require a different macro environment.
❓ Do you consider CRYPTOCAP:PENDLE fairly valued at current levels, or still structurally undervalued?
______________
◆ Follow us ❤️ for daily crypto insights & updates!
🚀 Don’t miss out on important market moves
🧠 DYOR | This is not financial advice, just thinking out loud
Pendleusdtperp

PENDLE/USDT - Major Reversal or Major Breakdown?Pendle is now approaching one of the most critical areas on its entire weekly chart.
After topping near 7.5 and forming a long distribution phase, price is sliding back toward the historical origin of its previous bull cycle — the 1.05–0.80 demand zone.
This yellow zone is not just another support.
It’s the level that changed Pendle’s trajectory once before.
---
🧩 Macro Structure: What’s Really Happening?
2022 → Early 2023: Long accumulation base.
2023 → 2024: Explosive breakout and trending bull phase.
2024 → 2025: Distribution, weakening structure, lower highs forming.
Now: Price retracing toward the most critical weekly demand zone.
Why is 1.05–0.80 such a big deal?
Because this is where:
The previous bullrun began
Major volume and liquidity were absorbed
Smart money positioned before the breakout
If the zone holds → history could repeat.
If it breaks → the long-term bullish structure collapses.
---
🟢 Bullish Scenario — Could This Become a New Macro Higher Low?
A bullish case activates if:
1. Price taps 1.05–0.80 and rejects strongly
– A weekly candle with a long lower wick would be a powerful early signal.
2. Weekly close stays above the zone
– Confirms that demand still dominates here.
3. Recovery targets are as follows:
First reclaim: 2.7
Structural resistance: 4.0
Full recovery region: 6.0–7.5
If this happens, the chart would form a new macro higher low, potentially triggering a long-term bullish reversal.
This is exactly where institutions and early-cycle buyers may step back in.
---
🔴 Bearish Scenario — Breakdown Toward Deeper Liquidity Zones?
A bearish continuation is confirmed if:
1. Weekly close breaks below 0.80 with conviction
– This signals full momentum shift to sellers.
2. Retest fails to reclaim the zone
– Validates a clean supply-flip.
3. Downside targets become:
0.45 → midrange structural support
0.20–0.12 → major historical demand
Below this lies deep capitulation territory
Losing 0.80 would mark the official breakdown of Pendle’s multi-year bullish structure.
---
🎯 Why the 1.05–0.80 Zone Is So Important
Because it is:
A macro decision point for market direction
A battle zone between smart money and retail liquidity
The origin of the previous bull market
The clearest weekly level on the entire chart
This is the type of zone that determines the direction of the next several months.
---
📌 Conclusion
Pendle enters one of its most critical phases.
The 1.05–0.80 zone is not merely “support” — it is the major pivot that will decide whether:
Pendle is preparing for a large-scale weekly reversal,
or
Pendle is sliding into a deeper corrective phase toward 0.45 → 0.20.
On the weekly timeframe, every reaction is amplified and highly meaningful.
---
#Pendle #PENDLEUSDT #CryptoAnalysis #MarketStructure #PriceAction #WeeklyChart #CryptoOutlook #SupportAndResistance #CryptoBreakdown #CryptoReversal

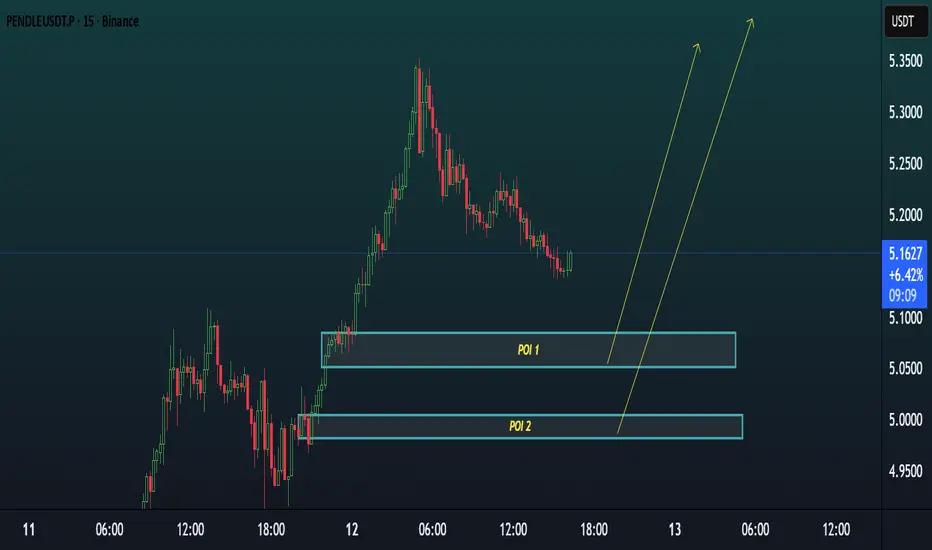
PENDLEUSDT TRADE POIsChart Analysis (15m)
Current Price: $5.145 (+7.48%)
Trend: Strong bullish momentum after a deep retracement.
📍
Points of Interest (POIs)
POI 1 (First Buy Zone): Around $5.05 – $5.10
Acts as the nearest demand zone.
Price may react here if it doesn’t drop too deep.
POI 2 (Second Buy Zone): Around $4.95 – $5.00
Stronger demand area for confirmation.
If price sweeps liquidity from POI 1, this is the deeper entry.
✅
Bullish Scenario
Wait for bullish confirmation (engulfing, liquidity sweep, or strong reversal wick) at either POI.
Potential upside targets:
First target: $5.30
Second target: $5.40+
⚠️
Invalidation
If price breaks and closes strongly below $4.90, the bullish setup weakens.
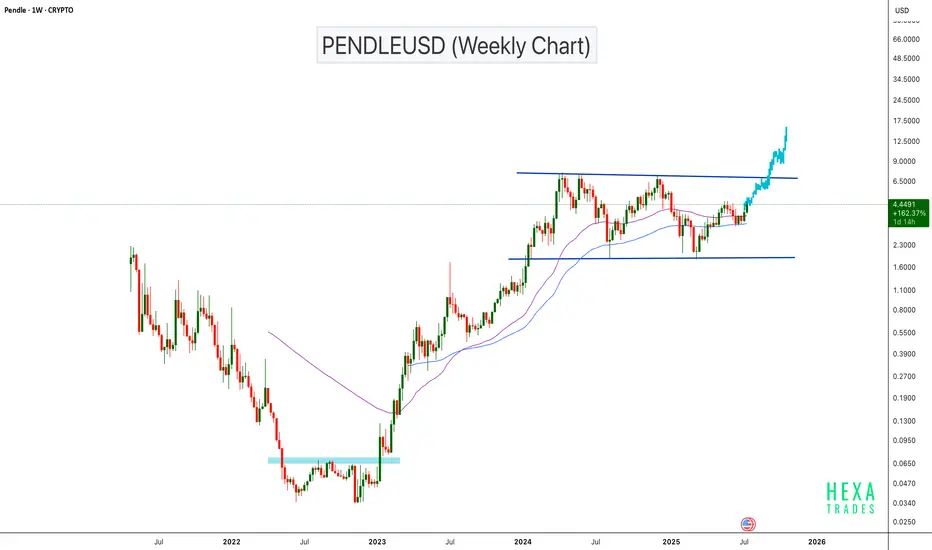
PENDLEUSD Bullish Continuation Setup!BINANCE:PENDLEUSDT has surged approximately 20,000% from its bottom, showing exceptional long-term strength. The price is now approaching a major horizontal resistance zone on the weekly chart. If the price breaks the parallel channel resistance, we can expect a bullish continuation with a psychological target of $15.
Cheers
Hexa
CRYPTOCAP:PENDLE CRYPTO:PENDLEUSD
PENDLEUSDT 📈 PENDLEUSDT 4H Analysis:
Price rebounded from the 2.444 demand zone after a short-term breakdown and is now stabilizing above the 200 EMA, with the bullish trendline still intact. Key resistance lies at 3.219, and breaking it could open the path to 3.602. However, a drop below 2.626 and the trendline may trigger a deeper correction.

PENDLEUSDT 2D AnalysisPENDLE ~ 2D Analysis
#PENDLE Buy when re -testing this support block or buy after successfully penetrating this resistant line with a short -term target of at least 10%+.
#PENDLE/USDT#PENDLE
The price is moving within a descending channel on the 1-hour frame and is expected to continue upward.
We have a trend to stabilize above the 100 moving average once again.
We have a downtrend on the RSI indicator, which supports the upward move with a breakout.
We have a support area at the lower boundary of the channel at 2.63.
Entry price: 2.85
First target: 3.07
Second target: 3.20
Third target: 3.40

PENDLEUSDT 1DPENDLE ~ 1D Analysis
#PENDLE Buy gradually after successfully penetrating this resistant line with a short -term target of at least 10%+.

PENDLEUSDT 3DPENDLE ~ 3D
#PENDLE So far it still continues to maintain this support block. If you still have Conviction on this coin,. Buy from here with a minimum target of 20%++

PendleUSDT Long IdeaIf Pendle comes to fill the 50% of the 4hr wick which is where the 1hr 50ema sits, I'll attempt a long for 7.12RR towards the nearest available 1D 50% of an unfilled wick, which is at 7.265.
Please, share your opinion on this bias in the comments section. If you take it, let me know.

PENDLEUSDT 5DPENDLE Update ~ 5D
#PENDLE In the 5D Time Frame it forms a rounding bottom pattern. If you still have Conviction on this coin, Buy gradually after breaking through this resistance block. New highs are only a matter of time.

PENDLEUSDT Bearish Wedge PatternPENDLEUSDT Technical analysis update
PENDLE has formed a Raising wedge pattern on the daily chart, and the price has recently broken below the wedge's support line in day chart. This breakdown suggests potential bearish momentum in the coming days, with a possible decline toward lower support levels.

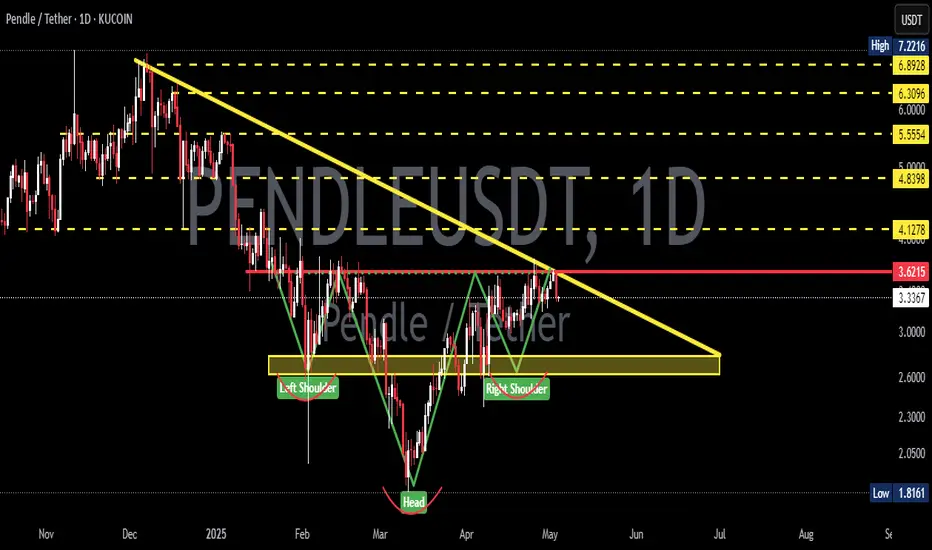
PENLDEUSDT Bullish Head and Shoulders Pattern.PENDLEUSDT Technical analysis update
PENDLE's price is breaking the inverse head and shoulders neckline on the daily chart, with the 100 and 200 EMAs acting as support for the right shoulder. We can expect a potential bullish move in PENDLE
Buy zone : Below $5.00
Stop loss : $4.40
Take Profit 1: $5.48
Take Profit 2: $6.15
Take Profit 3: $8.00
Regards
Hexa

PENDLE target 74h time frame
-
Entry: $3.7
TP: $7
SL: $3.03
RR: 4.93
-
(1) Completed first wave; Doing second wave; Ready for third wave (Refer to following link)
(2) Big bottom head and shoulders pattern is creating
(3) Got support twice at fib projection 0.618, but be careful the possibility to reach 0.5
(4) Target for fib projection is $7
(5) Stop loss once going below $3.03
-
Previous Analysis-PENDLE reached target

PENDLEUSDTPENDLE ~ 3D ✅
#PENDLE On the 3D Time Frame a Bullish Pennant Pattern is formed.
✅ Make purchases gradually in this pattern. with a minimum target of 20%+

PENDLE target 4.66(short-term)4h time frame
-
Entry: $2.7
TP: $4.66
SL: $2.15
RR: 3.56
-
(1) Potential bullish flag on 4h
(2) Got support around Fib 0.382, high possibility reach 1.618 if stop falling here
(3) Fib 1.618 is also overlapped with structural resistance at $4.66
(4) Stop loss once going below $2.1

PENDLE target 8.9712h time frame
-
TP: $8.97
SL: $4.49
RR: 8.76
-
(1) Convergence pattern is be building. *two potential support lines
(2) 0.382 fibonacci projection at $3.8
(3) Target matches fibonacci projection_0.382 & fibonacci extension_2.618
(4) Stop loss while triangle bottom got breaking down

PENDLEUSD 3DPENDLE ~ 3D
#PENDLE Buy after successfully breaking the Resistance Line on this pattern or buy on retest of $3.85 support. Minimum target 20%+

PENDLEUSDT Next Target $2.00PENDLEUSDT Technical Analaysis Update
PENDLEUSDT has formed a cup and handle pattern on the daily chart. Now that the price has broken through the cup and handle resistance (neckline), we can expect a 50% move from the current level.
Buy zone : Below $1.23
Stop loss : $1.10
Always Keep StopLoss
Regards
Hexa
