PENDLE/USDT at Critical Weekly Support — Reversal or Breakdown?PENDLE/USDT on the Weekly (1W) timeframe is currently moving inside a descending channel after printing its previous macro top. Price has now returned to a strong historical demand zone (yellow box) at 2.15 – 1.80, which acts as a key decision area for the next major move.
This zone previously served as a base before a strong bullish impulse, making it a critical level to watch.
---
Pattern Explanation
The price structure forms a Descending Channel (Bearish Continuation / Potential Reversal Structure) characterized by:
Consistent lower highs at the channel resistance
Gradual lower lows toward support
Current price positioned at the lower boundary of the channel + weekly demand
This confluence creates two possible outcomes:
Bullish reversal if demand holds
Further breakdown if demand fails
---
Key Levels
Major Demand Zone (Support): 2.15 – 1.80
Mid-Channel Resistance: ~3.00 – 3.30
Upper Channel Resistance: 4.80 – 5.50
Weekly High Reference: 7.53
Critical Breakdown Level: Below 1.80
---
Bullish Scenario
The bullish scenario remains valid as long as price holds above the 2.15 – 1.80 demand zone, supported by:
Strong weekly rejection or long lower wicks
Formation of a higher low on higher timeframes
A confirmed breakout and close above the mid-channel resistance
Potential Bullish Targets:
1. 3.00 – 3.30 (mid-channel reaction zone)
2. 4.80 – 5.50 (upper channel resistance)
3. 7.00+ if a full channel breakout occurs with strong volume
This area may act as a weekly accumulation zone before the next expansion phase.
---
Bearish Scenario
The bearish scenario activates if:
A weekly candle closes decisively below 1.80
Demand fails to produce meaningful buying pressure
Breakdown is confirmed with increased volume
Potential Bearish Targets:
1. 1.50 – 1.40
2. 1.10 – 1.00
3. Deeper historical support zones if overall market sentiment weakens
A breakdown below this demand would indicate distribution failure and continuation of the medium-term downtrend.
---
Conclusion
PENDLE/USDT is currently trading at a major weekly decision zone.
The 2.15 – 1.80 area will determine whether price forms a bullish reversal from demand or continues its broader bearish structure.
Waiting for weekly candle confirmation and applying proper risk management is crucial at this level.
---
#PENDLE #PENDLEUSDT #CryptoAnalysis #WeeklyChart #DescendingChannel #DemandZone #SupportResistance #AltcoinAnalysis #MarketStructure #PriceAction
Pendleusdtrading

PENDLE/USDT - Major Reversal or Major Breakdown?Pendle is now approaching one of the most critical areas on its entire weekly chart.
After topping near 7.5 and forming a long distribution phase, price is sliding back toward the historical origin of its previous bull cycle — the 1.05–0.80 demand zone.
This yellow zone is not just another support.
It’s the level that changed Pendle’s trajectory once before.
---
🧩 Macro Structure: What’s Really Happening?
2022 → Early 2023: Long accumulation base.
2023 → 2024: Explosive breakout and trending bull phase.
2024 → 2025: Distribution, weakening structure, lower highs forming.
Now: Price retracing toward the most critical weekly demand zone.
Why is 1.05–0.80 such a big deal?
Because this is where:
The previous bullrun began
Major volume and liquidity were absorbed
Smart money positioned before the breakout
If the zone holds → history could repeat.
If it breaks → the long-term bullish structure collapses.
---
🟢 Bullish Scenario — Could This Become a New Macro Higher Low?
A bullish case activates if:
1. Price taps 1.05–0.80 and rejects strongly
– A weekly candle with a long lower wick would be a powerful early signal.
2. Weekly close stays above the zone
– Confirms that demand still dominates here.
3. Recovery targets are as follows:
First reclaim: 2.7
Structural resistance: 4.0
Full recovery region: 6.0–7.5
If this happens, the chart would form a new macro higher low, potentially triggering a long-term bullish reversal.
This is exactly where institutions and early-cycle buyers may step back in.
---
🔴 Bearish Scenario — Breakdown Toward Deeper Liquidity Zones?
A bearish continuation is confirmed if:
1. Weekly close breaks below 0.80 with conviction
– This signals full momentum shift to sellers.
2. Retest fails to reclaim the zone
– Validates a clean supply-flip.
3. Downside targets become:
0.45 → midrange structural support
0.20–0.12 → major historical demand
Below this lies deep capitulation territory
Losing 0.80 would mark the official breakdown of Pendle’s multi-year bullish structure.
---
🎯 Why the 1.05–0.80 Zone Is So Important
Because it is:
A macro decision point for market direction
A battle zone between smart money and retail liquidity
The origin of the previous bull market
The clearest weekly level on the entire chart
This is the type of zone that determines the direction of the next several months.
---
📌 Conclusion
Pendle enters one of its most critical phases.
The 1.05–0.80 zone is not merely “support” — it is the major pivot that will decide whether:
Pendle is preparing for a large-scale weekly reversal,
or
Pendle is sliding into a deeper corrective phase toward 0.45 → 0.20.
On the weekly timeframe, every reaction is amplified and highly meaningful.
---
#Pendle #PENDLEUSDT #CryptoAnalysis #MarketStructure #PriceAction #WeeklyChart #CryptoOutlook #SupportAndResistance #CryptoBreakdown #CryptoReversal

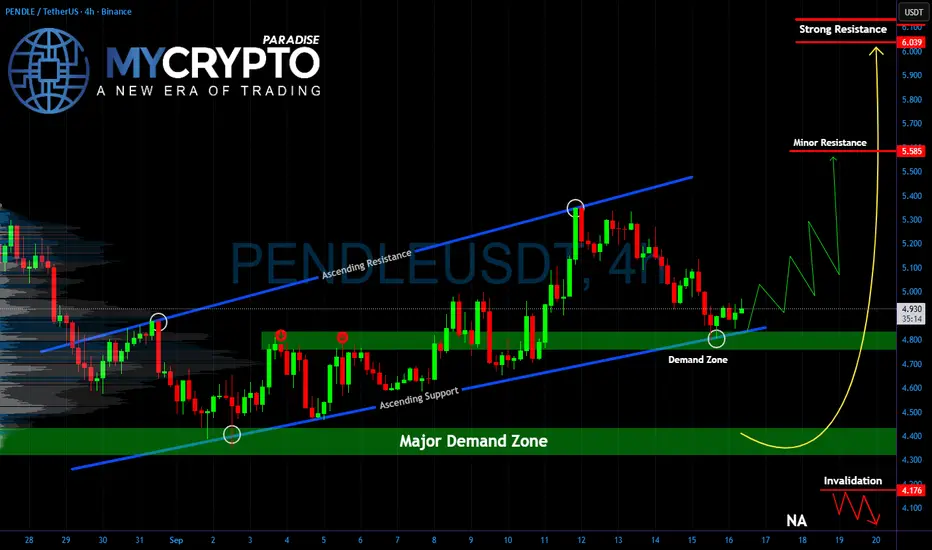
PENDLE At Critical Turning Point Before Explosive MoveYello Paradisers, can #PENDLEUSDT hold the line here, or is a painful flush waiting around the corner? After the recent selloff, the price has landed right inside a demand zone that previously triggered strong recoveries. This is the level where buyers need to step up, or the structure risks collapsing toward the deeper major demand area below.
💎Currently, #PENDLE is bouncing from the ascending support trendline after retesting it, showing early signs of strength. If momentum continues, the first big obstacle lies at the 5.58 minor resistance. A clean breakout above that level could open the way toward the strong resistance zone around 6.03–6.13, which has historically been a heavy supply area. That’s where aggressive profit-taking is likely to appear again.
💎On the downside, the invalidation level remains clear at 4.17. A close below this mark would signal that demand has completely failed, and it could invite deeper liquidation, dragging the price back into the major demand zone around 4.20–4.40. Until then, the bullish structure remains intact, but the next moves will be decisive.
🎖Strive for consistency, not quick profits. Treat the market as a businessman, not as a gambler. The next breakout or breakdown will shake out weak hands, but only disciplined traders will stay on the right side of the move.
MyCryptoParadise
iFeel the success🌴
PENDLE Buy Prices For a DCA Strategy & Fib Take Profit TargetsPENDLE is a great coin for this Bull run, which I think can easily push up to $10 - $20.
In this video, I cover where I'm placing limit buy orders below to dollar cost average in and build a bigger position, while lowering my overall cost.
Then we'll look at a few reasons why, showing that PENDLE is oversold and likely to push higher here, and into AltSeason.
I'm also sharing my 4 Take Profit Targets of $7 (Previous ATH), and the Fib Targets of $10 (F1.618), $15 (F2.618) and $20 (F3.618) as well as hold a Moonbag in case Pendle Moons!
We're up 70% on PENDLE already since recommending it in July and expect higher targets in the coming weeks and months, into the Bull Peak.
What are your thoughts and comments?
- Brett

PENDLEUSDT 📈 PENDLEUSDT 4H Analysis:
Price rebounded from the 2.444 demand zone after a short-term breakdown and is now stabilizing above the 200 EMA, with the bullish trendline still intact. Key resistance lies at 3.219, and breaking it could open the path to 3.602. However, a drop below 2.626 and the trendline may trigger a deeper correction.

PENDLEUSDT 2D AnalysisPENDLE ~ 2D Analysis
#PENDLE Buy when re -testing this support block or buy after successfully penetrating this resistant line with a short -term target of at least 10%+.
PENDLEUSDT 1DPENDLE ~ 1D Analysis
#PENDLE Buy gradually after successfully penetrating this resistant line with a short -term target of at least 10%+.

PENDLEUSDT 3DPENDLE ~ 3D
#PENDLE So far it still continues to maintain this support block. If you still have Conviction on this coin,. Buy from here with a minimum target of 20%++

PENDLE target $8.64h time frame
-
Entry: $3.9
TP: $8.6
SL: $3.05
RR: 5.41
-
(1) PENDLE is building a descending wedge which is a standard correction from previous pump
(2) Currently stand on a comparable low point
(3) Fibonacci provides first target at $8.6 and final target at $12.5
(4) Stop loss once going below $3.05

PENDLEUSDT 5DPENDLE Update ~ 5D
#PENDLE In the 5D Time Frame it forms a rounding bottom pattern. If you still have Conviction on this coin, Buy gradually after breaking through this resistance block. New highs are only a matter of time.

PENDLE target 74h time frame
-
Entry: $3.7
TP: $7
SL: $3.03
RR: 4.93
-
(1) Completed first wave; Doing second wave; Ready for third wave (Refer to following link)
(2) Big bottom head and shoulders pattern is creating
(3) Got support twice at fib projection 0.618, but be careful the possibility to reach 0.5
(4) Target for fib projection is $7
(5) Stop loss once going below $3.03
-
Previous Analysis-PENDLE reached target

PENDLEUSDTPENDLE ~ 3D ✅
#PENDLE On the 3D Time Frame a Bullish Pennant Pattern is formed.
✅ Make purchases gradually in this pattern. with a minimum target of 20%+

PENDLE target 4.66(short-term)4h time frame
-
Entry: $2.7
TP: $4.66
SL: $2.15
RR: 3.56
-
(1) Potential bullish flag on 4h
(2) Got support around Fib 0.382, high possibility reach 1.618 if stop falling here
(3) Fib 1.618 is also overlapped with structural resistance at $4.66
(4) Stop loss once going below $2.1

PENDLE target 8.9712h time frame
-
TP: $8.97
SL: $4.49
RR: 8.76
-
(1) Convergence pattern is be building. *two potential support lines
(2) 0.382 fibonacci projection at $3.8
(3) Target matches fibonacci projection_0.382 & fibonacci extension_2.618
(4) Stop loss while triangle bottom got breaking down

PENDLEUSD 3DPENDLE ~ 3D
#PENDLE Buy after successfully breaking the Resistance Line on this pattern or buy on retest of $3.85 support. Minimum target 20%+

PENDLE/USDT Breakout Alert! Bullish momentum for Pendle.💎 Paradisers, #PENDLE is indeed a coin worth monitoring closely.
💎 It appears that the price has successfully broken out of the falling wedge pattern, accompanied by a break of the Choch area and a reclaim of the support level. These three confirmations simultaneously signal a very bullish potential for PENDLE's movement.
💎 The price may retest the support area around 5.580 before continuing its upward trend, potentially aiming to reach the previous all-time high in our target area.
💎 However, if PENDLE fails to bounce from the support area and instead consolidates with weak volume, this could be a concerning sign.
💎 It may indicate a possible fakeout or even a breakdown below the support area. In such a scenario, PENDLE would fail to sustain its bullish movement, and the price could decline toward the demand area at $4.7.
💎 The demand area holds significant importance, so it's crucial for PENDLE to bounce from this level and reclaim the support to resume its upward movement. However, if PENDLE fails to bounce and breaks below the demand area, this could signal a bearish momentum, potentially leading to further downward movement.
MyCryptoParadise
iFeel the success🌴

PENDLE/USDT Critical area. Breakout or Breakdown the support ??💎 PENDLE has recently exhibited notable market dynamics. It is currently resting on the support line of an ascending channel pattern after facing rejection from a local resistance area. However, the indicator tools suggest bearish divergence and weak momentum.
💎 If PENDLE successfully breaks out above the resistance, there is a possibility of reaching our target area.
💎 Conversely, if PENDLE breaks down below the support pattern, it may signal a switch to a bearish trend. In such a scenario, the price could decline towards the Bullish OB area or even reach the support area.
💎 PENDLE must bounce at the support level to maintain the current upward movement. Failure to bounce could result in continued downward movement, potentially leading to further declines.

PENDLE/USDT Perfectly Break out the pattern. Very Bullish !!!💎 PENDLE has recently become a key player in the market, impressively breaking out of a bullish pennant pattern, highlighted by a robust green candle. Notably, PENDLE has managed to breach not only the pattern but also the resistance of a previous higher peak.
💎 If PENDLE maintains its position above the support level in the 8-hour closing candle, there's a high probability it will continue its upward trajectory, probability aiming for the target set by the bullish pennant.
💎 However, if PENDLE is unable to sustain its position above the support at the close of the candle, it might retreat back to the demand area, which also aligns with the support trendline. In this zone, PENDLE would need to gather new momentum to resume its upward movement.
💎 In the demand zone, a strong bounce is essential. If PENDLE only consolidates without a significant recovery, it risks losing this key support area. This could potentially lead to a further decline, taking PENDLE back towards the stronger demand area.

PENDLEUSDT Next Target $2.00PENDLEUSDT Technical Analaysis Update
PENDLEUSDT has formed a cup and handle pattern on the daily chart. Now that the price has broken through the cup and handle resistance (neckline), we can expect a 50% move from the current level.
Buy zone : Below $1.23
Stop loss : $1.10
Always Keep StopLoss
Regards
Hexa

PENDLE target 24h time frame
-
PENDLE is correcting since increasing 170% from 0.45, we can pay attention to two critical support. First one is 0.99, this is composed of previous wick lows, another is 0.618 Fibonacci Projection(0.94). Also, according to Elliot impulse wave, PENDLE is probably on the second wave. If it is, then we can target 1.7 and 2 in future.
TP: 1.7 / 2
SL: 0.8225

Pendle Is Still Strong I anticipate that the price of Pendle will continue to rise further. There could be a bullish move of at least 20-40% in the coming days.
However, please note that this is my personal opinion and not financial advice. I encourage you to conduct your own research.

PENDLEUSD: Strong buy opportunity at the bottom of the ChannelPENDLEUSD is attempting to get detached from the 1D MA50, located at the bottom of the 8 month Channel Up. The 1D MACD is in the process of forming a Bullish Cross, while the overal timeframe is neutral technically (RSI = 50.567, MACD = 0.003, ADX = 41.833) indicating strong upside potential.
As long as this holds, we are expecting this to be the start of the new HH leg. We're long aiming at at least a +400% rise (TP = 3.4000).
## If you like our free content follow our profile to get more daily ideas. ##
## Comments and likes are greatly appreciated. ##
