PENDLE/USDT at Critical Weekly Support — Reversal or Breakdown?PENDLE/USDT on the Weekly (1W) timeframe is currently moving inside a descending channel after printing its previous macro top. Price has now returned to a strong historical demand zone (yellow box) at 2.15 – 1.80, which acts as a key decision area for the next major move.
This zone previously served as a base before a strong bullish impulse, making it a critical level to watch.
---
Pattern Explanation
The price structure forms a Descending Channel (Bearish Continuation / Potential Reversal Structure) characterized by:
Consistent lower highs at the channel resistance
Gradual lower lows toward support
Current price positioned at the lower boundary of the channel + weekly demand
This confluence creates two possible outcomes:
Bullish reversal if demand holds
Further breakdown if demand fails
---
Key Levels
Major Demand Zone (Support): 2.15 – 1.80
Mid-Channel Resistance: ~3.00 – 3.30
Upper Channel Resistance: 4.80 – 5.50
Weekly High Reference: 7.53
Critical Breakdown Level: Below 1.80
---
Bullish Scenario
The bullish scenario remains valid as long as price holds above the 2.15 – 1.80 demand zone, supported by:
Strong weekly rejection or long lower wicks
Formation of a higher low on higher timeframes
A confirmed breakout and close above the mid-channel resistance
Potential Bullish Targets:
1. 3.00 – 3.30 (mid-channel reaction zone)
2. 4.80 – 5.50 (upper channel resistance)
3. 7.00+ if a full channel breakout occurs with strong volume
This area may act as a weekly accumulation zone before the next expansion phase.
---
Bearish Scenario
The bearish scenario activates if:
A weekly candle closes decisively below 1.80
Demand fails to produce meaningful buying pressure
Breakdown is confirmed with increased volume
Potential Bearish Targets:
1. 1.50 – 1.40
2. 1.10 – 1.00
3. Deeper historical support zones if overall market sentiment weakens
A breakdown below this demand would indicate distribution failure and continuation of the medium-term downtrend.
---
Conclusion
PENDLE/USDT is currently trading at a major weekly decision zone.
The 2.15 – 1.80 area will determine whether price forms a bullish reversal from demand or continues its broader bearish structure.
Waiting for weekly candle confirmation and applying proper risk management is crucial at this level.
---
#PENDLE #PENDLEUSDT #CryptoAnalysis #WeeklyChart #DescendingChannel #DemandZone #SupportResistance #AltcoinAnalysis #MarketStructure #PriceAction
Pendleusdtsignal

PENDLE/USDT - Major Reversal or Major Breakdown?Pendle is now approaching one of the most critical areas on its entire weekly chart.
After topping near 7.5 and forming a long distribution phase, price is sliding back toward the historical origin of its previous bull cycle — the 1.05–0.80 demand zone.
This yellow zone is not just another support.
It’s the level that changed Pendle’s trajectory once before.
---
🧩 Macro Structure: What’s Really Happening?
2022 → Early 2023: Long accumulation base.
2023 → 2024: Explosive breakout and trending bull phase.
2024 → 2025: Distribution, weakening structure, lower highs forming.
Now: Price retracing toward the most critical weekly demand zone.
Why is 1.05–0.80 such a big deal?
Because this is where:
The previous bullrun began
Major volume and liquidity were absorbed
Smart money positioned before the breakout
If the zone holds → history could repeat.
If it breaks → the long-term bullish structure collapses.
---
🟢 Bullish Scenario — Could This Become a New Macro Higher Low?
A bullish case activates if:
1. Price taps 1.05–0.80 and rejects strongly
– A weekly candle with a long lower wick would be a powerful early signal.
2. Weekly close stays above the zone
– Confirms that demand still dominates here.
3. Recovery targets are as follows:
First reclaim: 2.7
Structural resistance: 4.0
Full recovery region: 6.0–7.5
If this happens, the chart would form a new macro higher low, potentially triggering a long-term bullish reversal.
This is exactly where institutions and early-cycle buyers may step back in.
---
🔴 Bearish Scenario — Breakdown Toward Deeper Liquidity Zones?
A bearish continuation is confirmed if:
1. Weekly close breaks below 0.80 with conviction
– This signals full momentum shift to sellers.
2. Retest fails to reclaim the zone
– Validates a clean supply-flip.
3. Downside targets become:
0.45 → midrange structural support
0.20–0.12 → major historical demand
Below this lies deep capitulation territory
Losing 0.80 would mark the official breakdown of Pendle’s multi-year bullish structure.
---
🎯 Why the 1.05–0.80 Zone Is So Important
Because it is:
A macro decision point for market direction
A battle zone between smart money and retail liquidity
The origin of the previous bull market
The clearest weekly level on the entire chart
This is the type of zone that determines the direction of the next several months.
---
📌 Conclusion
Pendle enters one of its most critical phases.
The 1.05–0.80 zone is not merely “support” — it is the major pivot that will decide whether:
Pendle is preparing for a large-scale weekly reversal,
or
Pendle is sliding into a deeper corrective phase toward 0.45 → 0.20.
On the weekly timeframe, every reaction is amplified and highly meaningful.
---
#Pendle #PENDLEUSDT #CryptoAnalysis #MarketStructure #PriceAction #WeeklyChart #CryptoOutlook #SupportAndResistance #CryptoBreakdown #CryptoReversal

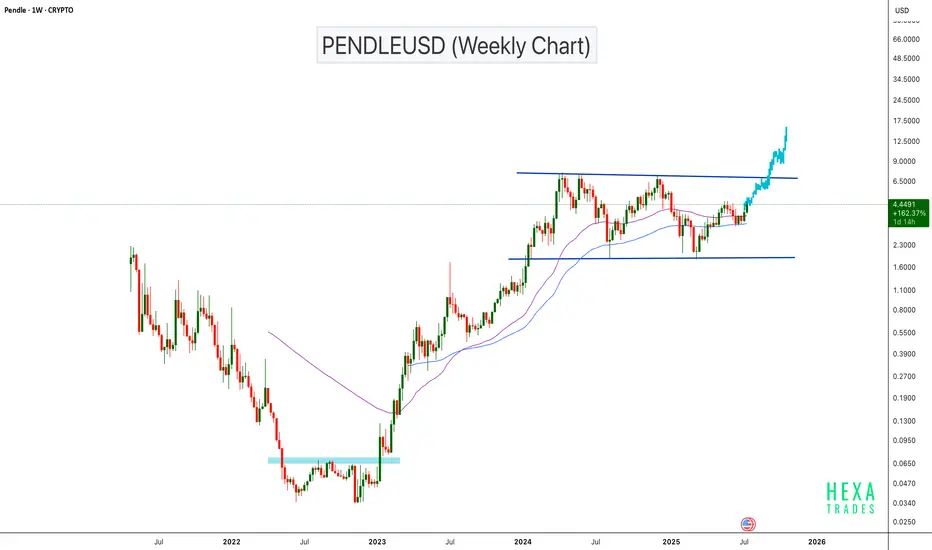
PENDLEUSD Bullish Continuation Setup!BINANCE:PENDLEUSDT has surged approximately 20,000% from its bottom, showing exceptional long-term strength. The price is now approaching a major horizontal resistance zone on the weekly chart. If the price breaks the parallel channel resistance, we can expect a bullish continuation with a psychological target of $15.
Cheers
Hexa
CRYPTOCAP:PENDLE CRYPTO:PENDLEUSD
PENDLEUSDT 📈 PENDLEUSDT 4H Analysis:
Price rebounded from the 2.444 demand zone after a short-term breakdown and is now stabilizing above the 200 EMA, with the bullish trendline still intact. Key resistance lies at 3.219, and breaking it could open the path to 3.602. However, a drop below 2.626 and the trendline may trigger a deeper correction.

PENDLEUSDT 2D AnalysisPENDLE ~ 2D Analysis
#PENDLE Buy when re -testing this support block or buy after successfully penetrating this resistant line with a short -term target of at least 10%+.
PENDLEUSDT 1DPENDLE ~ 1D Analysis
#PENDLE Buy gradually after successfully penetrating this resistant line with a short -term target of at least 10%+.

PENDLEUSDT 3DPENDLE ~ 3D
#PENDLE So far it still continues to maintain this support block. If you still have Conviction on this coin,. Buy from here with a minimum target of 20%++

PENDLE target $8.64h time frame
-
Entry: $3.9
TP: $8.6
SL: $3.05
RR: 5.41
-
(1) PENDLE is building a descending wedge which is a standard correction from previous pump
(2) Currently stand on a comparable low point
(3) Fibonacci provides first target at $8.6 and final target at $12.5
(4) Stop loss once going below $3.05

PENDLEUSDT 5DPENDLE Update ~ 5D
#PENDLE In the 5D Time Frame it forms a rounding bottom pattern. If you still have Conviction on this coin, Buy gradually after breaking through this resistance block. New highs are only a matter of time.

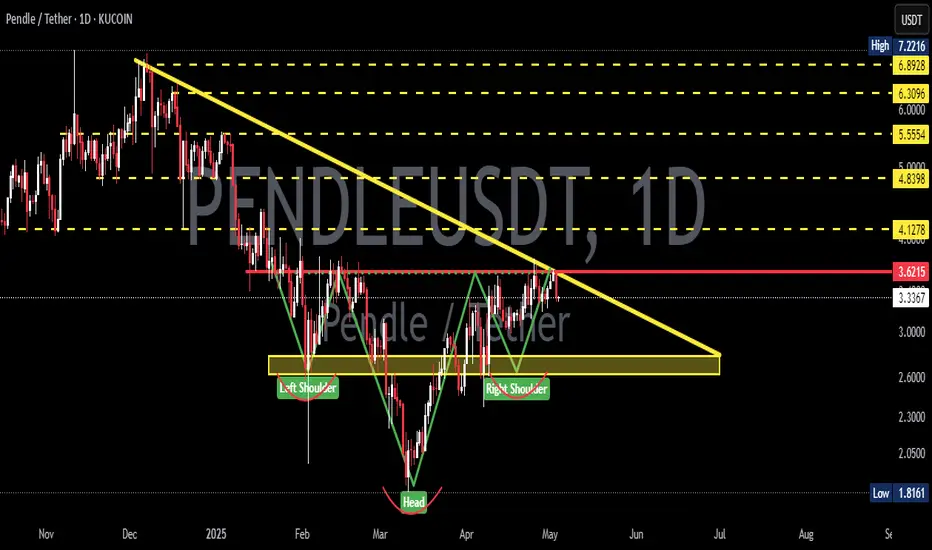
PENDLEUSDT Is a Major Breakout on the Horizon??Yello, Paradisers! Are you watching #PENDLEUSDT closely? A potential breakout could be just around the corner, but is the bullish momentum strong enough to hold? Let's break it down.
💎#PENDLE Currently eyeing an Inverted Head and Shoulders (IHNS) pattern a classic bullish reversal signal. But remember, it's not confirmed until we see a daily candle close above the key resistance. Only then can we anticipate a significant upward movement, with the price potentially testing our target areas.
💎However, if PENDLE gets rejected at this crucial resistance, the odds favor a retracement back to the demand zone around 4.07. This zone could act as a launchpad for another breakout attempt, keeping the bullish scenario alive.
💎On the flip side, things could get tricky if PENDLE fails to hold that demand zone. A breakdown here opens up the possibility of a drop toward the support at 3.575, an area that has been respected several times in the past. With the right shoulder of the IHNS also sitting in this zone, it's possible we could see a rebound, but for the bulls to stay in control, PENDLE needs to reclaim the 4.07 level and push back toward resistance.
💎If the support at 3.575 fails and a daily candle closes below it, this could confirm a lower low, potentially leading to even more downside action. In this case, the bullish setup would be invalidated, and we could see PENDLE dipping further.
If you want to be consistently profitable, you need to be extremely patient and always wait for the best, highest-probability trading opportunities. Stay focused, patient, and disciplined, Paradisers!
MyCryptoParadise
iFeel the success🌴

PENDLE target 74h time frame
-
Entry: $3.7
TP: $7
SL: $3.03
RR: 4.93
-
(1) Completed first wave; Doing second wave; Ready for third wave (Refer to following link)
(2) Big bottom head and shoulders pattern is creating
(3) Got support twice at fib projection 0.618, but be careful the possibility to reach 0.5
(4) Target for fib projection is $7
(5) Stop loss once going below $3.03
-
Previous Analysis-PENDLE reached target

PENDLEUSDTPENDLE ~ 3D ✅
#PENDLE On the 3D Time Frame a Bullish Pennant Pattern is formed.
✅ Make purchases gradually in this pattern. with a minimum target of 20%+

PENDLE target 4.66(short-term)4h time frame
-
Entry: $2.7
TP: $4.66
SL: $2.15
RR: 3.56
-
(1) Potential bullish flag on 4h
(2) Got support around Fib 0.382, high possibility reach 1.618 if stop falling here
(3) Fib 1.618 is also overlapped with structural resistance at $4.66
(4) Stop loss once going below $2.1

PENDLEUSDT is on critical Levels to Watch!Yello, Paradisers! Are you ready to uncover the potential major moves in #PENDLEUSDT? Let's break it down!
💎#PENDLE has successfully reclaimed the demand area, signaling good momentum. We anticipate a test at the 2.318 demand level, which could trigger a rebound and continue the upward movement. If this scenario plays out, we could see a significant rise in price as it tests the strong resistance area.
💎However, if PENDLE fails to rebound and breaks below the demand area again, it may drop to the strong demand zone around 1.58. This area could attract large orders, sparking a strong bullish reversal and a subsequent breakout above resistance. But beware, if PENDLE hits this strong demand and remains sideways, it could be a bad sign.
💎Bullish invalidation occurs if PENDLE breaks key support and closes daily below strong demand. In this case, the price is likely to head further downward and dip.
Discipline and patience are crucial in navigating these potential market shifts.
MyCryptoParadise
iFeel the success🌴

PENDLE target 8.9712h time frame
-
TP: $8.97
SL: $4.49
RR: 8.76
-
(1) Convergence pattern is be building. *two potential support lines
(2) 0.382 fibonacci projection at $3.8
(3) Target matches fibonacci projection_0.382 & fibonacci extension_2.618
(4) Stop loss while triangle bottom got breaking down

PENDLEUSD 3DPENDLE ~ 3D
#PENDLE Buy after successfully breaking the Resistance Line on this pattern or buy on retest of $3.85 support. Minimum target 20%+

PENDLE/USDT Keep an eye on the demand and support area!💎 Paradisers, the recent market dynamics surrounding #PENDLE have indeed been noteworthy.
💎 Experiencing rejection once more at the strong resistance area, PENDLE has retraced back downward, potentially targeting the demand zone between 5.16 and 4.67.
💎 If PENDLE reaches the demand zone, it will be crucial for it to bounce back and attempt to break above the resistance trendline to resume its upward trajectory and test our target strong resistance area.
💎 However, if PENDLE fails to find support at the demand area and even breaks below it, the next likely target will be the key support area. This area presents a favorable buying opportunity for PENDLE, as a bounce from this zone could signal a continuation of the bullish movement.
MyCryptoParadise
iFeel the success🌴
