Pudgy Penguins PENGU price analysis#PENGU has recently joined the list of outperforming memecoins, gaining over 60% in a short period.
Currently, OKX:PENGUUSDT is trading within a key technical zone:
$0.0127–0.0157
Why this zone matters:
price acceptance here may form a new accumulation range
continuation from this structure could result in a ~200% upside move
Market capitalization outlook:
Current valuation: ~$800M
Bullish expansion scenario: $2.4–2.5B
This setup remains valid as long as price holds above the lower boundary of the range.
👉 Do you believe #PENGU can become one of the strongest memecoin performers this cycle?
______________
◆ Follow us ❤️ for daily crypto insights & updates!
🚀 Don’t miss out on important market moves
🧠 DYOR | This is not financial advice, just thinking out loud
PENGU

PENGU/USDT: Critical Decision Point - Reclaim or Cascade?💡 Scenario Mapping
🚀 BULLISH Case: 3D frame :
If price holds above $0.012 and reclaims $0.0125:
Potential bounce toward the $0.025-0.028 range
Accumulation phase begins (blue box scenario)
Higher lows formation = trend reversal confirmation
⚡ Trading Gameplan
For Long-Term Holders:
Wait for confirmation: Break and retest of $0.0013 for long entry
Strong Buy: $0.0122
Stop Loss: Below $0.011
Avoid: Trading in current chop zone without clear direction ❌
____________________
🧠 The Bottom Line -
PENGU is at a crossroads. The chart shows a classic post-parabolic correction approaching historically significant support—typical behavior for meme/community tokens after initial hype. The next few weeks will determine if this is:
✅ A generational buying opportunity (if support holds)
❌ A falling knife (if support breaks)
GOOD LUCK --- * DYOR * - MANDATORY

PENGU couldn’t break out above the red resistance zone📊 PENGU Update
PENGU couldn’t break out above the red resistance zone 🔴
and got rejected again, showing sellers are still strong at this level.
As long as price stays below this resistance,
upside remains limited.

$PENGU & $MOODENG FractalsMemes are showing some relative strength. CRYPTOCAP:MOODENG climbed over 55% in the last 24 hours, lifted by renewed media buzz, a clean bullish breakout, and a heavy spike in volume. A sharp midday liquidity burst sent the price straight up. CRYPTOCAP:MOODENG carries strong speculative momentum, but as a pure memecoin, it remains highly volatile and driven by sustained hype.
On the left chart is $PENGU, and the 8-hour fractals look almost identical to MOODENG’s price action. Will $PENGU follow the same playbook and shift into a parabolic micro-trend? If volume sustains, the next potential zone sits around $0.015–$0.020, with a possible wick toward $0.025-0.030.

PENGU has now broken out above the right shoulder🚨📊 PENGU Update
PENGU has now broken out above the right shoulder
of the previous Head & Shoulders pattern 🔄 —
a structure that was originally bearish,
but this breakout invalidates the downside and shows new strength.
Right now, price looks like it’s making a pullback
after the breakout — a normal retest move before
a potential push higher again.
If momentum continues,
the next target is the green line level 🟩🎯
which lines up with the POC (Point of Control)
from the previous downtrend —
the area where sellers were most active earlier.
Key points:
❌ Bearish H&S invalidated with a right-shoulder breakout
🔁 Pullback in progress (healthy retest)
🟩 Target = Green line = POC of sellers
📈 If pullback holds, next bullish leg likely

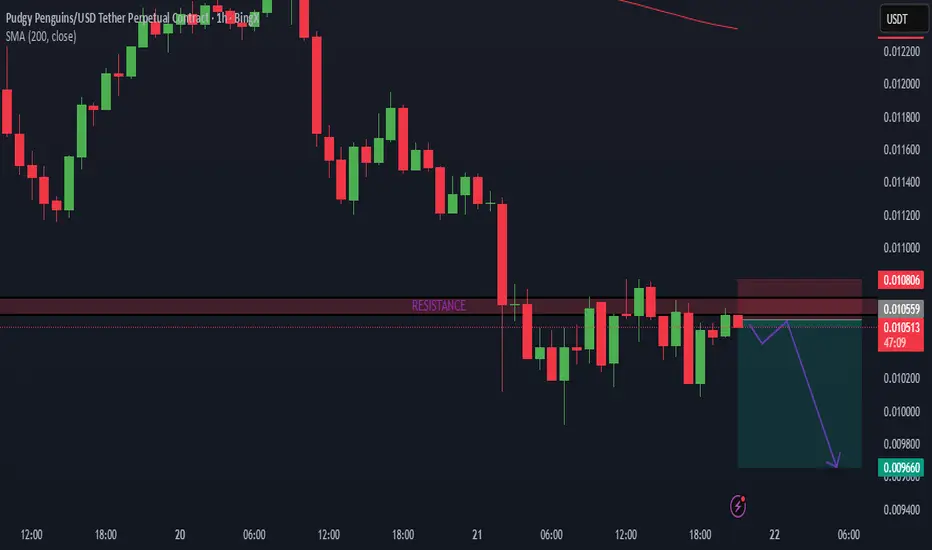
PENGU Update🚨📊 PENGU Update
PENGU is testing the blue support level right now 🔵.
If this support breaks down,
it could become a short opportunity,
with the green line level 🟢 as the main target.
If price drops from here,
we could see PENGU fall at least 40% —
this is a critical support zone and losing it would signal strong bearish momentum.

PENGU Update🚨📊 PENGU Update
PENGU has also formed a new resistance zone in red 🔴.
This level is now acting as a strong ceiling,
and price must break out above this red resistance
to show any real bullish momentum again.
Until that breakout happens,
sellers remain in control and upside stays limited.
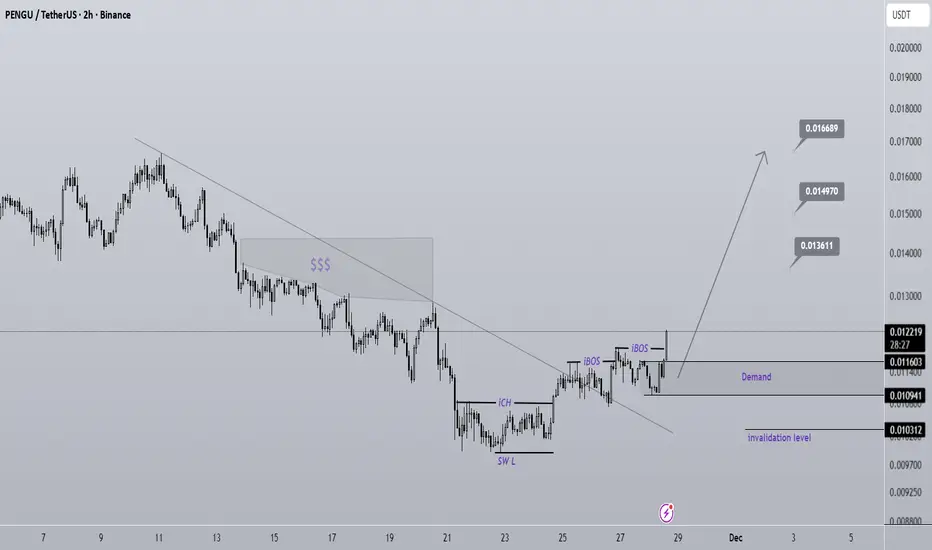
PENGU Looks Bullish (2H)Considering the iCH and the two iBOS, the lower timeframe structure has turned bullish, meaning we can look for buy/long positions within the small-timeframe order blocks.
We also have a liquidity pool on the chart that we expect to be swept soon.
The targets have been marked on the chart.
A 4-hour candle closing below the invalidation level will break this analysis.
Do not enter the position without capital management and stop setting
Comment if you have any questions
thank you
PENGU - BEARISH $PENGU - price analysis 🟥
Very bearish trend at the moment & no buy pressure📉
Price will likely continue to fall toward 0.00800$ lower key demand zone! 📉
Possible setup & key levels are in my charts.🐧
Not a financial advice.

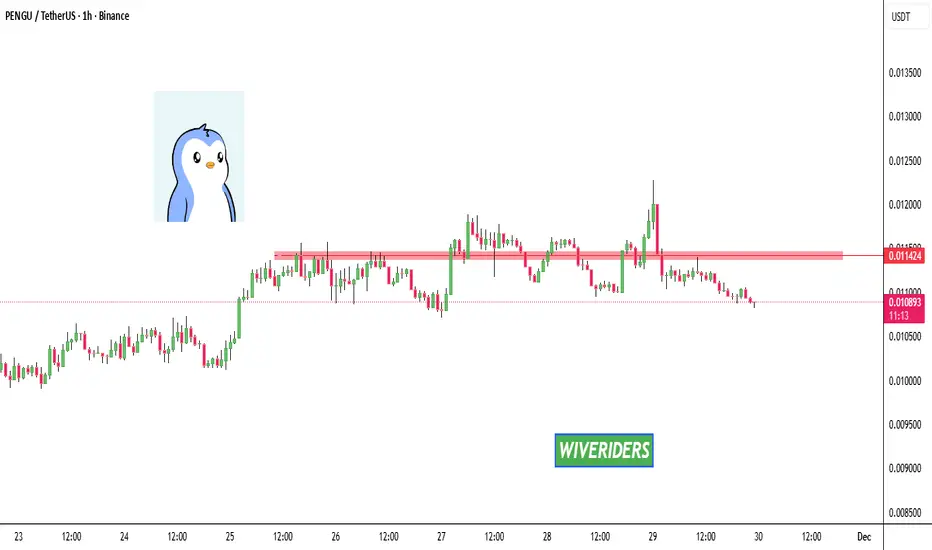
Bearish continuationPENGU has created a range between 0.0101 and 0.0107 and has been staying there for a few hours. The top of the range is serving as resistance and is still not broken so with the bearish pressure we have ssen recently price should just bounce from it and continue down.
PENGU/USDT: THE ULTIMATE FIBONACCI RETRACEMENT PLAY💎 THE GOLDEN SETUP: 5-Point Technical Confluence
1️⃣ FIBONACCI MASTERCLASS IN ACTION
0.5 Fib Level: $0.021181 (HELD PERFECTLY) ✅
0.618 Golden Ratio: $0.017920 (Strong Support Zone)
0.786 Deep Retracement: $0.013920 (Ultimate Backstop)
Current Position: Trading above 0.5 Fib = BULLISH CONTROL
__________________
❌ BEARISH
Break below $0.029 (Channel support)
Failure to hold 0.5 Fib level ($0.021)
Volume declining on any pullback
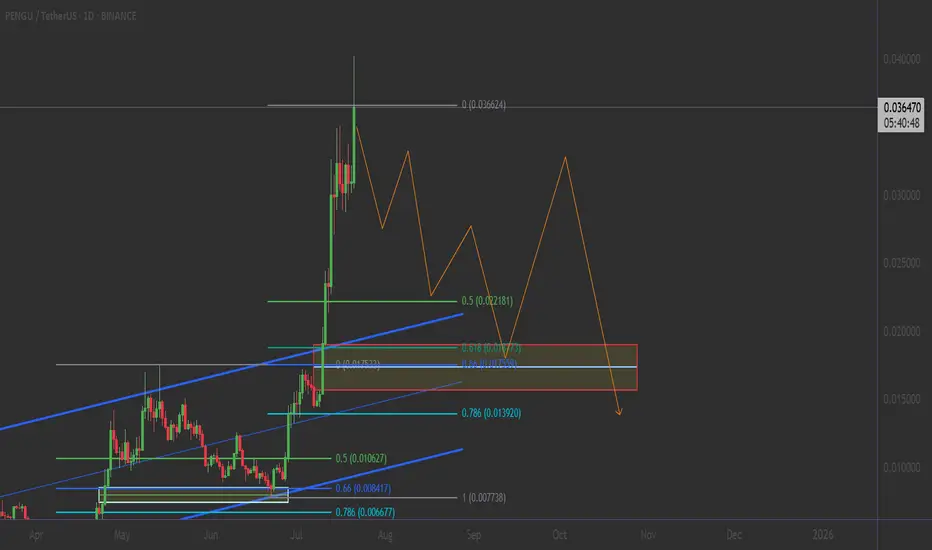
PENGU bear market started for it#PENGU / USDT
Price lost 6 months uptrend line which is breakdown bullish structure
As result this could be just the beginning of bearish market for it in the coming weeks
Invalidation: price will turn bullish if ONLY able to breakout and hold above red zone marked in my chart
Note : price wont drop as straight line it moves like waves

PENGUUSDT.P - November 1, 2025PENGUUSDT.P is showing a series of higher lows supported by an ascending trendline, indicating sustained bullish pressure. The planned long setup targets the $0.019059 profit level, with a stop placed near $0.0177738 for clear risk management. A break above the breakeven zone would confirm bullish continuation toward the upper resistance, maintaining a constructive bias while price holds above trendline support.

PENGUUSDT : BUY LIMITHello friends
Given the good growth we had and the entry of buyers, now that the price is correcting, there is a good opportunity to buy with risk and capital management and in steps at the specified supports and move with it to the specified targets.
*Trade safely with us*

PENGUUSDT.P - October 30, 2025Bullish Bias: PENGUUSDT.P is consolidating near the $0.019 support zone, showing potential accumulation after a prolonged downtrend. A breakout above $0.0269 would confirm bullish momentum and open room toward $0.0325 as the next resistance.
Bearish Bias: Price remains in a clear downtrend with lower highs and lows, and sustained weakness below $0.019 would likely trigger continuation toward the $0.009 region. Until a confirmed breakout occurs, momentum favors sellers.
The token is currently in a volatility squeeze, indicating that a big move in either direction is coming anytime soon.

$PENGU is consolidating: long opportunityThe market is expected to cool down a bit after the recent CRYPTOCAP:BTC rally — that’s our chance to catch a solid long setup. Check the green box for the entry zone!
Entry in the green box, the lowest possible
🎯 Target: $0.035, $0.038, 0.040
If CRYPTOCAP:BTC corrects to around $120,000, it could drag altcoins lower, giving us a perfect opportunity for a juicy long position.
Always DYOR! 💪 #Crypto #Altcoins #BTC #Trading #TechnicalAnalysis #MarketUpdate #DYOR

PENGU - continues to look bullishTalked about this on todays Live Stream
Broke out of side ways accumulation
and is now currently just retraced after
a nice move upward
Would like to see a retracement
( about the mid-line of the zone )
before upward continuation
Instructions on chart
NFA - Not Financial Advice
Join the Streams for Free Mentorship

$PUDGY: Watching for Flag Breakout
The CSECY:PENGU is still contained within the flag pattern, following a strong rally. While there’s upward momentum, the breakout hasn’t fully occurred yet.
Key points:
Resistance: Watch the 0.032 area as the flag's upper boundary. A breakout here could confirm a continuation of the bullish trend.
Support: The 0.026 support zone remains crucial. If price holds here, it could set up for another push higher.
For now, the price is stuck in the flag pattern, with the breakout above resistance being the next key move.
Follow us and stay tuned for more updates.
#PEACE
DYOR, NFA

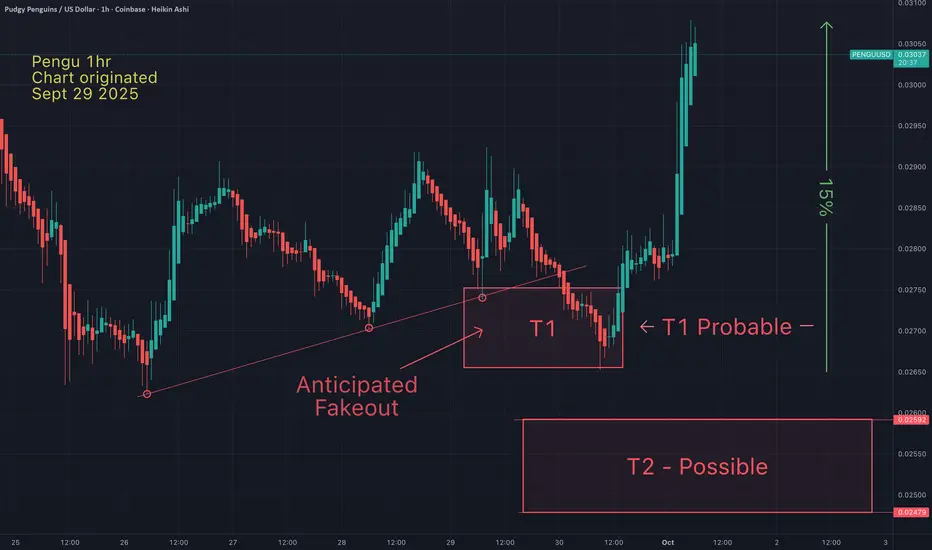
You will ask yourself, "how did he know Pengu would do that"?On Sept 29th I suggested that Pengu would drop into my T1 with "high probability"...and after the anticipated "fakeout", it would bounce. That has now played out. Congratulations to those of you that took that trade.
T2 was "possible", but has now become "unlikely".
May the trends be with you.
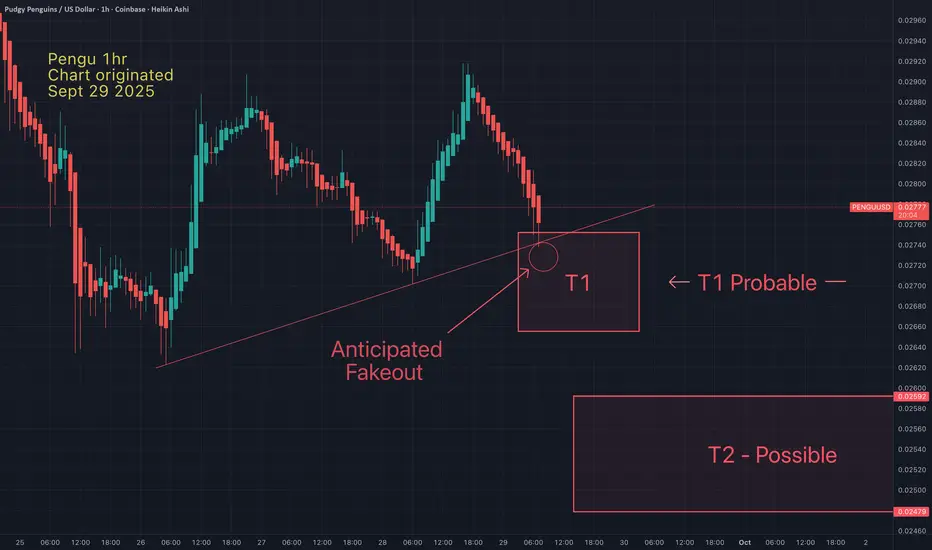
Pengu - Target 1 hit - Bounce incoming or lower low?Pengu just entered my T1, as anticipated. Fakeouts like this example (just below trendlines), are very common and may be good entry points. The only question that remains is will Pengu form a lower low. If so, it may be an even better entry point for me.
May the trend sbe with you.
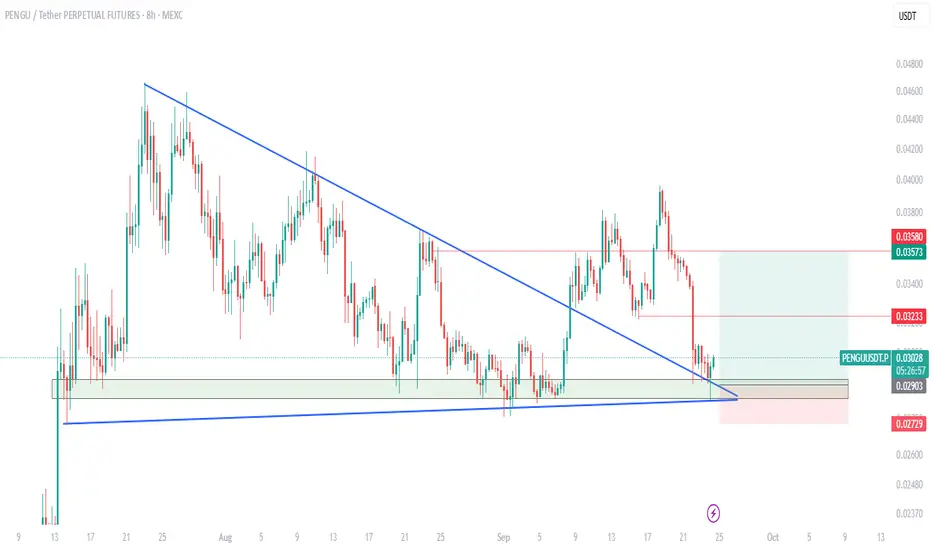
$PENGU breakout and RETEST!BINANCE:PENGUUSDT is retesting strong support around 0.029–0.030 after a sharp pullback, aligning with the previous breakout trendline. As long as this zone holds, a bounce toward resistance at 0.032 and 0.035+ looks likely.
Invalidation below 0.02729. Stop-loss in place for risk management.
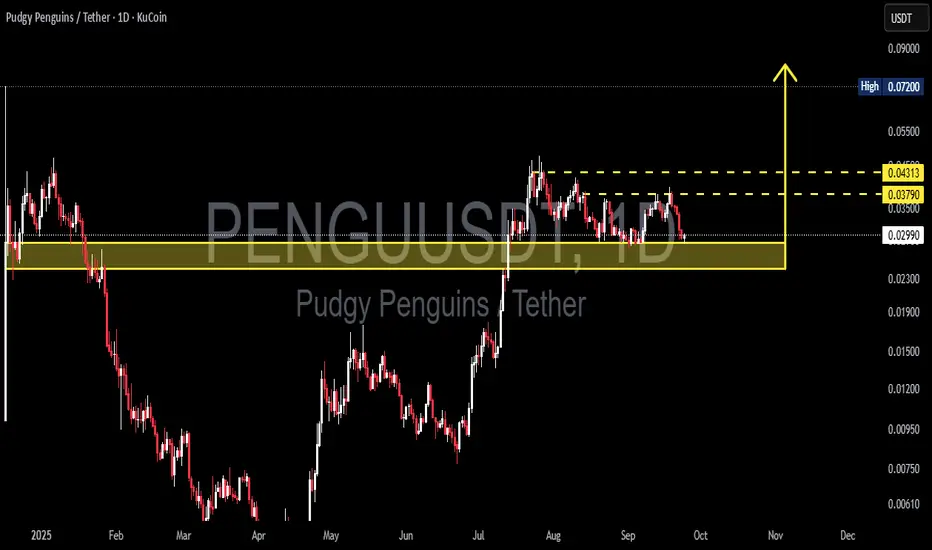
PENGU/USDT – at Key Zone: Major Accumulation or Breakdown Ahead?Current Situation
On the daily chart, PENGU/USDT is trading around ~0.0298 USDT, sitting directly above the critical support zone at 0.023 – 0.030 (highlighted in yellow). This zone is significant because:
It previously acted as strong resistance earlier in 2025.
Once broken in July, it flipped into key support (demand zone).
Now it’s being retested, making this area a decisive turning point.
---
Price Structure & Patterns
1. Range Accumulation: After a strong rally in July–August, price is consolidating, creating a potential base.
2. Resistance Cluster: Two overhead resistances are clear:
0.03790 → first minor resistance.
0.04313 → major resistance level.
3. Breakout Potential: A daily close above 0.04313 could open the path toward the structural high at 0.072.
4. Distribution vs. Accumulation: Current range could play out either way — buyers holding the zone (accumulation) or sellers unloading before a deeper breakdown (distribution).
---
Bullish Scenario (Rebound Potential)
Trigger: Daily bullish close above 0.029–0.030 with rising volume.
Short-term targets:
0.03790 → minor resistance.
0.04313 → major upside target in this range.
Mid-term target: A confirmed breakout above 0.04313 could extend to 0.072 (previous structural high).
Confirmation signals: Bullish candlestick patterns (hammer / engulfing) within the support zone would strengthen the bullish case.
---
Bearish Scenario (Breakdown Risk)
Trigger: A strong daily close below 0.023 with high selling volume.
Implication: The mid-term bullish structure fails, pushing PENGU back into a downtrend.
Targets: Deeper corrections toward historical demand zones around 0.020 → 0.015 → 0.012.
Distribution signs: A series of lower highs followed by a confirmed range breakdown.
---
Market Psychology
Buyers are defending the 0.023–0.030 zone, signaling potential accumulation.
Sellers are waiting for breakdown confirmation below support to trigger panic selling.
This is a make-or-break moment for PENGU — a classic battleground between bulls and bears.
---
Conclusion
The 0.023–0.030 zone is the decisive level for PENGU’s next big move.
Bullish if it holds → targets at 0.0379 → 0.04313 → 0.072.
Bearish if it breaks down <0.023 → opens the door to deeper corrections.
Best approach: Wait for confirmation (daily close + volume) before committing to aggressive positions.
---
#PENGU #PudgyPenguins #Crypto #Altcoins #TA #TechnicalAnalysis #CryptoTrading #PriceAction
PENGU (FREE SIGNAL)Hello friends
Given the price decline, it can now be said that sellers are gradually weakening and weakness is occurring in the trend. Given the failure to confirm the rise of 3 support areas, we have determined that the price can be well supported in these areas and if supported, it can move to the specified targets.
*Trade safely with us*
