Pudgy Penguins PENGU price analysis#PENGU has recently joined the list of outperforming memecoins, gaining over 60% in a short period.
Currently, OKX:PENGUUSDT is trading within a key technical zone:
$0.0127–0.0157
Why this zone matters:
price acceptance here may form a new accumulation range
continuation from this structure could result in a ~200% upside move
Market capitalization outlook:
Current valuation: ~$800M
Bullish expansion scenario: $2.4–2.5B
This setup remains valid as long as price holds above the lower boundary of the range.
👉 Do you believe #PENGU can become one of the strongest memecoin performers this cycle?
______________
◆ Follow us ❤️ for daily crypto insights & updates!
🚀 Don’t miss out on important market moves
🧠 DYOR | This is not financial advice, just thinking out loud
PENGUUSD

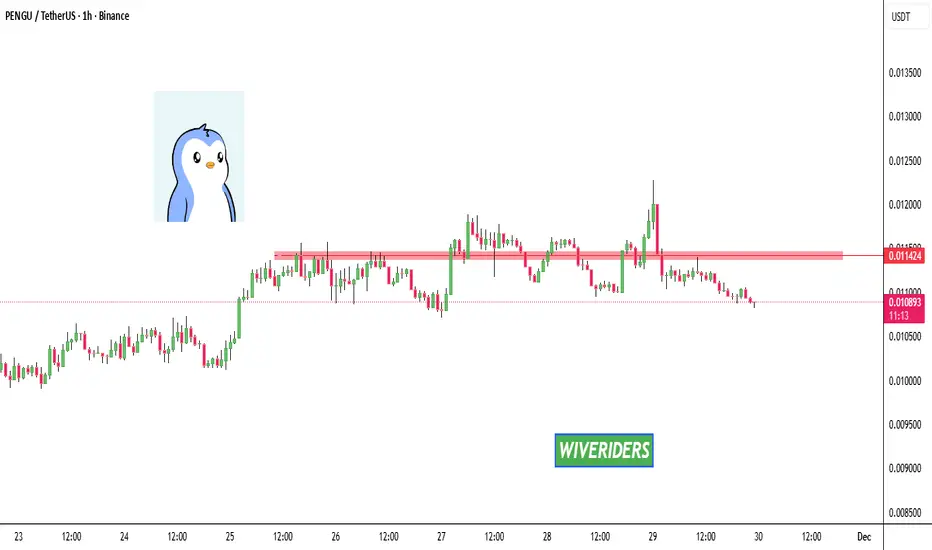
PENGU Update🚨📊 PENGU Update
PENGU has also formed a new resistance zone in red 🔴.
This level is now acting as a strong ceiling,
and price must break out above this red resistance
to show any real bullish momentum again.
Until that breakout happens,
sellers remain in control and upside stays limited.
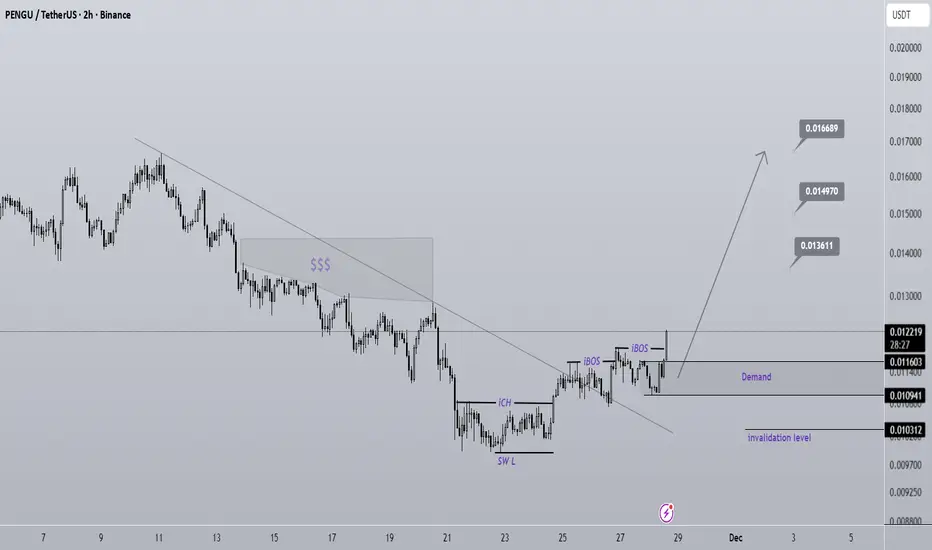
PENGU Looks Bullish (2H)Considering the iCH and the two iBOS, the lower timeframe structure has turned bullish, meaning we can look for buy/long positions within the small-timeframe order blocks.
We also have a liquidity pool on the chart that we expect to be swept soon.
The targets have been marked on the chart.
A 4-hour candle closing below the invalidation level will break this analysis.
Do not enter the position without capital management and stop setting
Comment if you have any questions
thank you
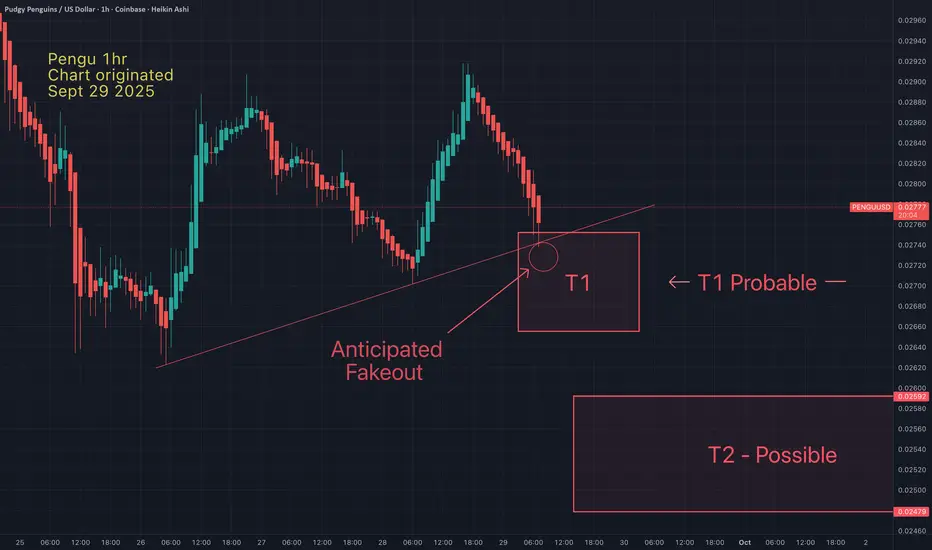
Pengu - Target 1 hit - Bounce incoming or lower low?Pengu just entered my T1, as anticipated. Fakeouts like this example (just below trendlines), are very common and may be good entry points. The only question that remains is will Pengu form a lower low. If so, it may be an even better entry point for me.
May the trend sbe with you.
$PENGU breakout and RETEST!BINANCE:PENGUUSDT is retesting strong support around 0.029–0.030 after a sharp pullback, aligning with the previous breakout trendline. As long as this zone holds, a bounce toward resistance at 0.032 and 0.035+ looks likely.
Invalidation below 0.02729. Stop-loss in place for risk management.
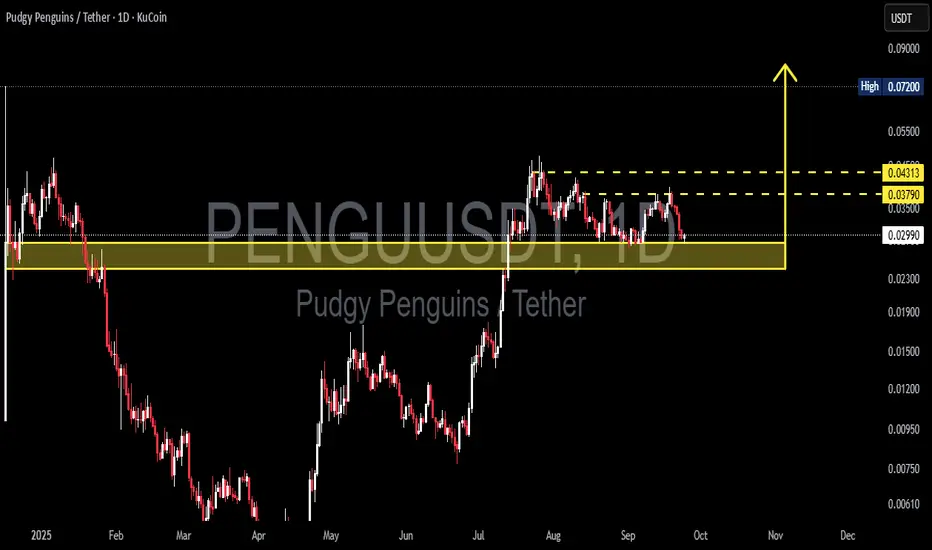
PENGU/USDT – at Key Zone: Major Accumulation or Breakdown Ahead?Current Situation
On the daily chart, PENGU/USDT is trading around ~0.0298 USDT, sitting directly above the critical support zone at 0.023 – 0.030 (highlighted in yellow). This zone is significant because:
It previously acted as strong resistance earlier in 2025.
Once broken in July, it flipped into key support (demand zone).
Now it’s being retested, making this area a decisive turning point.
---
Price Structure & Patterns
1. Range Accumulation: After a strong rally in July–August, price is consolidating, creating a potential base.
2. Resistance Cluster: Two overhead resistances are clear:
0.03790 → first minor resistance.
0.04313 → major resistance level.
3. Breakout Potential: A daily close above 0.04313 could open the path toward the structural high at 0.072.
4. Distribution vs. Accumulation: Current range could play out either way — buyers holding the zone (accumulation) or sellers unloading before a deeper breakdown (distribution).
---
Bullish Scenario (Rebound Potential)
Trigger: Daily bullish close above 0.029–0.030 with rising volume.
Short-term targets:
0.03790 → minor resistance.
0.04313 → major upside target in this range.
Mid-term target: A confirmed breakout above 0.04313 could extend to 0.072 (previous structural high).
Confirmation signals: Bullish candlestick patterns (hammer / engulfing) within the support zone would strengthen the bullish case.
---
Bearish Scenario (Breakdown Risk)
Trigger: A strong daily close below 0.023 with high selling volume.
Implication: The mid-term bullish structure fails, pushing PENGU back into a downtrend.
Targets: Deeper corrections toward historical demand zones around 0.020 → 0.015 → 0.012.
Distribution signs: A series of lower highs followed by a confirmed range breakdown.
---
Market Psychology
Buyers are defending the 0.023–0.030 zone, signaling potential accumulation.
Sellers are waiting for breakdown confirmation below support to trigger panic selling.
This is a make-or-break moment for PENGU — a classic battleground between bulls and bears.
---
Conclusion
The 0.023–0.030 zone is the decisive level for PENGU’s next big move.
Bullish if it holds → targets at 0.0379 → 0.04313 → 0.072.
Bearish if it breaks down <0.023 → opens the door to deeper corrections.
Best approach: Wait for confirmation (daily close + volume) before committing to aggressive positions.
---
#PENGU #PudgyPenguins #Crypto #Altcoins #TA #TechnicalAnalysis #CryptoTrading #PriceAction
PENGU (FREE SIGNAL)Hello friends
Given the price decline, it can now be said that sellers are gradually weakening and weakness is occurring in the trend. Given the failure to confirm the rise of 3 support areas, we have determined that the price can be well supported in these areas and if supported, it can move to the specified targets.
*Trade safely with us*

PENGU Price Jumps 10% as Meme Coin Market Gains 5%At the time of writing, PENGU is trading at $0.0376 after its 10.7% rally. The token is attempting to flip this level into support while targeting the resistance at $0.0404, which could serve as the next milestone in its upward push.
Given strong RSI and CMF readings, PENGU has a realistic chance of sustaining this momentum. The indicators suggest backing from both retail traders and market inflows, bolstering optimism for further gains beyond the immediate resistance.
However, downside risks remain. If broader market conditions turn bearish, PENGU could fail to hold current levels. A breakdown through $0.0363 could send the token lower to $0.0334, invalidating the bullish outlook and erasing part of its recent gains.

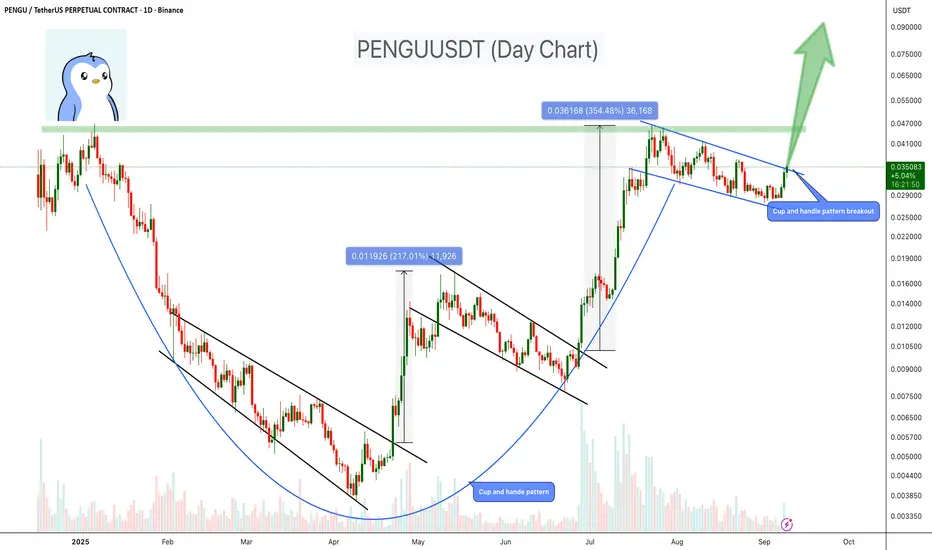
PENGU – Cup & Handle Breakout Loading?PENGU is showing a powerful technical setup with a Cup & Handle pattern forming on the daily chart – a classic bullish continuation pattern. Combined with its history of explosive moves after descending channel breakouts, this setup suggests strong upside potential.
Key Highlights:
- Cup & Handle Formation: The rounded base (cup) has formed, and the handle (descending channel) is nearly complete. A breakout above resistance would confirm the bullish pattern.
- Historical Rallies:
May breakout → +217% rally.
July breakout → +354% rally.
- Current Structure: Price is breaking out of the handle (descending channel), which aligns with the bullish continuation setup.
- Potential Target: Cup & handle breakout could project upside toward $0.07–$0.1.
- Volume Watch: Increasing volume during breakout would strengthen confirmation.
Cheers
Hexa
COINBASE:PENGUUSD BINANCE:PENGUUSDT
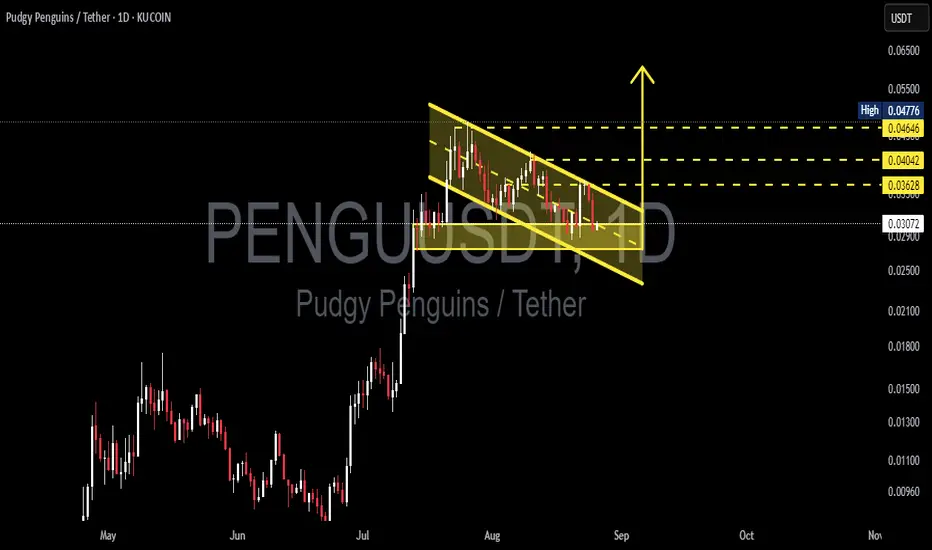
PENGU/USDT — Descending Channel!, Bull-Flag or Breakdown?🔎 Technical Analysis
Currently, PENGU/USDT is trading inside a descending channel following a sharp rally in July–August. This structure often appears as a healthy consolidation after a strong impulse move and can be classified as a bull-flag pattern — a potential bullish continuation setup waiting for confirmation.
Key Support: 0.0306 remains the critical demand zone. Multiple retests have held this level, making it an important line in the sand.
Key Resistance: The upper boundary of the channel, along with 0.03628, 0.04042, and 0.04646–0.04776, are the major upside targets if a breakout occurs.
Pattern Structure: Lower highs and lower lows forming a clean descending channel, but still within the context of a broader bullish trend.
Confirmation: A breakout above the channel with strong volume would confirm the bull-flag setup. A breakdown below 0.0306, however, would invalidate it and shift bias bearish.
---
🚀 Bullish Scenario
1. Channel Breakout: If price breaks above the descending channel and closes daily above 0.03628, upside targets include:
🎯 Target 1: 0.03628
🎯 Target 2: 0.04042
🎯 Target 3: 0.04646 – 0.04776
2. Retest Confirmation: A successful retest of the breakout level could provide a safer long entry.
---
🔻 Bearish Scenario
If price fails to hold 0.0306 and breaks down with strong selling volume, downside levels to watch:
📉 0.02500 – 0.02200
📉 possibly extending toward 0.01800 if bearish momentum accelerates.
Such a move would invalidate the bull-flag and suggest deeper correction.
---
📝 Trading Notes
Aggressive Approach: Enter near 0.0306 support with tight stop-loss below 0.028 → higher risk/reward but less safe.
Conservative Approach: Wait for a confirmed daily breakout above 0.03628 before entering → safer confirmation.
Risk Management: Always apply stop-loss and size positions properly — false breakouts remain a risk.
---
📌 Conclusion
PENGU is at a critical crossroads:
Bullish bias if it breaks out of the channel and reclaims 0.03628 → potential continuation toward 0.046+.
Bearish bias if it loses 0.0306 → downside correction likely toward 0.025–0.022 or lower.
While the overall trend remains bullish from the prior rally, confirmation is key before the next major move.
#PENGU #PudgyPenguins #Crypto #Altcoins #TechnicalAnalysis #PriceAction #BullFlag #DescendingChannel #BreakoutSetup
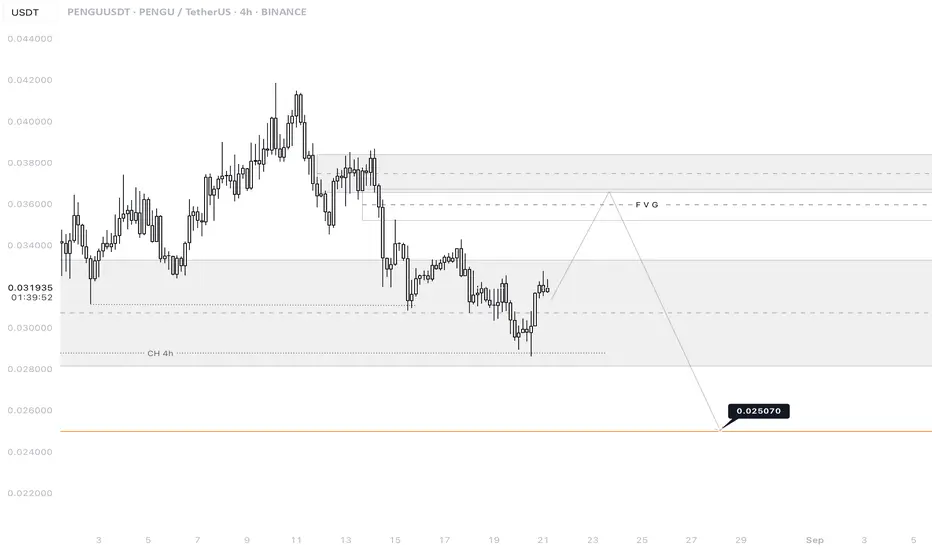
PENGUUSDT 4H✅ PENGU/USDT — 4H (Binance) | Aug 21, 2025 — Professional Technical Analysis
🔎 Chart Context
• Pair: PENGU/USDT
• Exchange: Binance
• Timeframe: 4H
• Current price: 0.03309
• Market is in a bearish corrective phase, with lower highs since the peak at 0.041867.
• Currently rebounding from a support zone, but the dominant structure remains downward until higher levels are reclaimed.
📊 Key Observations
1. Market Structure
• High: 0.041867 (local top).
• Subsequent lower highs: 0.038684 → 0.034526 → 0.034304.
• Recent low: 0.030841.
• This confirms a clear downtrend, with rallies acting as retracements.
2. Support & Demand Zones
• 0.03117 – 0.03084: Key short-term demand block where buyers stepped in.
• 0.02850 – 0.02780 (CH 4H): Mid-term liquidity support.
• 0.02507: Long-term downside target (liquidity magnet).
3. Resistance & Supply Zones
• 0.03430 – 0.03452: Immediate resistance area.
• 0.03750 – 0.03868 (FVG zone): Strong supply + fair value gap, likely to act as rejection zone.
4. Fair Value Gap (FVG)
• Located around 0.03750 – 0.03868.
• Price may retrace into this imbalance before resuming downward move.
📈 Bullish Scenario (Corrective Rally)
• Price holds above 0.03117 – 0.03084 and pushes higher.
• Likely targets:
• TP1: 0.03430
• TP2: 0.03750 – 0.03868 (FVG fill).
• Sustained breakout only possible above 0.03868, but probability remains low in current structure.
📉 Bearish Scenario (Higher Probability)
• Price rallies into 0.03430 – 0.03868 (FVG) and faces rejection.
• Expected continuation lower toward:
• TP1: 0.03117 – 0.03084
• TP2: 0.02850 (CH 4H zone)
• Final Target: 0.02507 (major liquidity sweep).
⚡ Trading Plan
• Short Setup (Preferred):
• Entry: 0.03430 – 0.03868 (supply / FVG).
• TP1: 0.03117
• TP2: 0.02850
• TP3: 0.02507
• Stop: Above 0.03900
• Long Setup (Countertrend):
• Entry: 0.03117 – 0.03084 (support defense).
• TP: 0.03430 – 0.03750
• Stop: Below 0.03050
✅ Conclusion
PENGU/USDT is in a downtrend, but showing signs of a corrective bounce. The most probable path is a rally into 0.03750 – 0.03868 (FVG), followed by a bearish continuation targeting 0.02507 in the coming sessions. Only a break and close above 0.03868 would shift the momentum to bullish.
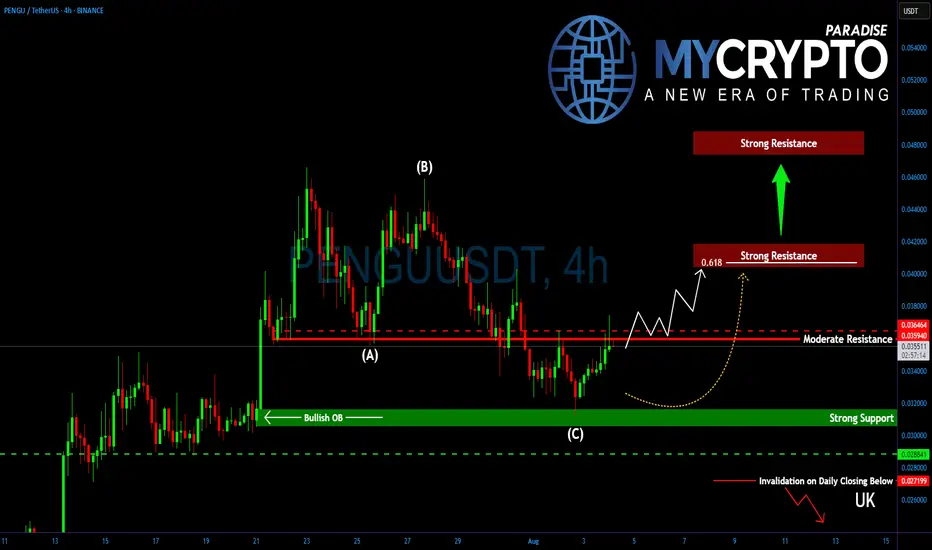
Is PENGU About to Explode or Fake Out Everyone Again?Yello, Paradisers! Have you been watching #PENGUUSDT after its recent dip? Because if you haven’t, you might be missing out on a potentially explosive setup forming right now…
💎After placing a major high around $0.0460, PENGU entered a textbook ABC corrective wave. But that correction looks to be over now, and what’s emerging could be the beginning of a powerful bottoming structure.
💎#PENGU is currently facing a critical short-term resistance at $0.0360–$0.0364, a level that bulls must flip to ignite a stronger recovery. If they succeed, all eyes shift toward the 61.8% Fibonacci retracement at $0.0405, a major confluence level that aligns with a key horizontal resistance between $0.0405 and $0.0415. Expect heavy action here. Bulls will likely face real pressure at this zone.
💎However, and this is where it gets interesting, if PENGU breaks above $0.0415 with strength, then momentum could pick up fast, paving the way for a fresh rally towards new yearly highs between $0.0480–$0.0494.
💎On the flip side, support remains solid between $0.0312 and $0.0302. This zone isn’t just an ordinary support, it also holds a bullish order block (OB), offering extra protection and confluence. This is where the market is quietly showing signs of strength while the majority are distracted elsewhere.
Paradisers, strive for consistency, not quick profits. Treat the market as a businessman, not as a gambler.
MyCryptoParadise
iFeel the success🌴
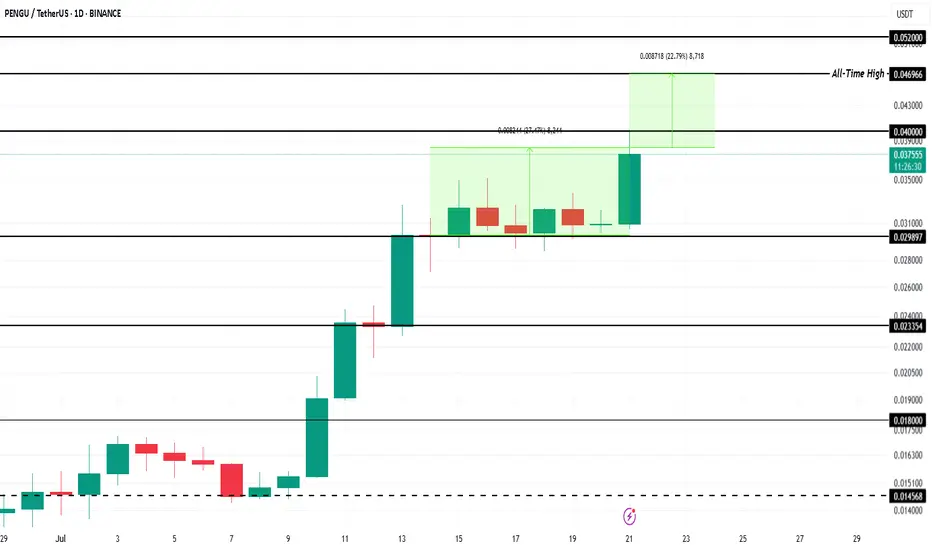
Meme Coin To Watch This Week - Pudgy Penguin (PENGU)BINANCE:PENGUUSDT price has surged 27% in the past week , currently trading at $0.038. The meme coin is inching closer to its all-time high of $0.046 . Strong bullish sentiment and market participation are fueling this rally, signaling that PENGU could soon retest resistance levels if momentum remains intact.
The meme coin is now just 22% away from hitting its record high . A Golden Cross pattern formed last week adds to the bullish outlook. If BINANCE:PENGUUSDT successfully flips $0.040 into a stable support level, the rally could continue, pushing the altcoin higher toward reclaiming its historical peak.
However, downside risks remain. If investors begin booking profits, selling pressure could drag BINANCE:PENGUUSDT lower . The critical support level of $0.029 will come into play. Losing this support could halt the upward trend and invalidate the optimistic price projection in the near term.
PENGUUSDT 50%-150% potentialBINANCE:PENGUUSDT is showing a classic cup and handle breakout on the daily chart, supported by a strong upward move and a bullish structure. Price has successfully broken out of key resistance around 0.0173, and volume is picking up. If momentum continues, the projected target points toward the $0.045 level, suggesting a potential upside of 50%-150%. The setup remains valid as long as price stays above the handle low around 0.0141.
Regards
HExa

PENGU Just Triggered a Massive Breakout! Key Levels to WatchYello, Paradisers! Are you watching what’s unfolding with #PENGU after months of quiet accumulation? Because this chart is finally waking up, and it’s happening right now.
💎After a prolonged bottoming phase that lasted approximately 162 sessions, PENGU has completed a classic cup and handle formation, and we’re now seeing the start of what could be a powerful breakout.
💎#PENGUUSDT has surged above the neckline resistance at $0.01680, and—more importantly, this breakout is backed by strong volume, giving the move real credibility. It’s not just a wick; it’s a genuine push.
💎Now that the neckline is broken, PENGU has room to push higher. But let’s be clear, price is likely to face moderate resistance at the $0.02280 level. That’s a spot where some short-term profit-taking can’t be ruled out, especially from early entries. It’s a natural reaction zone and a moment to watch for how price behaves under pressure.
💎Still, if momentum holds, the pattern suggests a potential move toward the $0.02820 to $0.03200 region. That zone is no joke. It includes the 61.8% and 78.6% Fibonacci retracement levels, two of the most powerful technical resistance points in any market cycle. This makes that area a major decision zone and one that should be approached with caution.
💎On the other side, support is now established between $0.01680 and $0.01500. This is the previous resistance zone, and any retest into this range is likely to see strong demand stepping in. It would not be surprising to see buyers defend this area aggressively, especially if the retest is clean and orderly.
Strive for consistency, not quick profits. Treat the market as a businessman, not as a gambler. This is the only way you will make it far in your crypto trading journey. Be a PRO.
MyCryptoParadise
iFeel the success🌴

PENGU/USDT Breakout Power — Start of a New Bullish Wave?
📌 Technical Overview:
The chart of PENGU/USDT on the daily timeframe has just printed a very strong bullish signal. After months of downward movement, the price has successfully broken out from a well-formed Falling Wedge — a classic bullish reversal pattern.
🧠 Pattern Analysis:
📉 Falling Wedge:
The wedge started forming since January 2025, marked by a series of lower highs and lower lows. Price action was squeezed into a narrowing range, indicating weakening bearish pressure.
The breakout in early July came with strong momentum, confirming bullish intent.
🟨 Key Demand Zone (Highlighted Box):
Between 0.0113 – 0.0124 USDT, this area aligns with key Fibonacci retracement levels:
0.5 @ 0.01248
0.618 @ 0.01138
0.786 @ 0.00981
This zone now acts as critical support, offering a possible buy-the-dip opportunity.
📏 Major Resistance Levels (Targets):
TP1: 0.02520 USDT – Minor resistance, first breakout confirmation
TP2: 0.03044 USDT – Structural mid-level resistance
TP3: 0.04316 USDT – Major psychological and structural barrier
TP4: 0.07000 USDT – Former high, potential long-term target
🟢 Bullish Scenario:
Price has cleanly broken above the wedge resistance and is now retesting or consolidating above the prior resistance zone.
As long as the price holds above 0.012 USDT, the bullish structure remains intact.
The ideal bullish path would be:
1. Minor pullback or retest to the yellow box area (demand)
2. Strong rally toward 0.025 USDT, followed by gradual climb toward 0.030 – 0.043 USDT
3. With sustained volume, 0.07 USDT becomes a realistic mid-term target
🔴 Bearish Scenario:
Failure to hold the 0.012 – 0.011 USDT demand zone would trigger a warning sign.
Breakdown below 0.0098 USDT (Fibo 0.786) would invalidate the breakout, and potentially resume the bearish trend.
If this happens, watch for price to revisit lower supports around 0.0075 – 0.0050 USDT
🧩 Volume and Momentum Watch:
The breakout was supported by a clear uptick in volume – a strong confirmation signal.
Keep an eye on RSI and MACD on your platform — if bullish divergence continues, it could fuel a sustained breakout.
💬 Summary:
> “PENGU is no longer hibernating — the breakout from a long-term falling wedge pattern signals the beginning of a new trend. With a confirmed breakout, solid support at Fibonacci levels, and clearly defined targets ahead, PENGU/USDT could be setting up for a powerful bullish leg — but caution remains essential at support levels.”
📣 Join the Momentum Early!
If the bullish scenario plays out, this could be a high-reward setup — but always manage your risk!
#PENGU #AltcoinSeason #CryptoBreakout #FallingWedge #BullishCrypto #CryptoTA #TradingViewAnalysis #USDT #AltcoinAlert #ChartPattern #TechnicalBreakout

PENGUUSDT - strong signal to buy!PENGU is giving a very strong buy signal on the 3-day timeframe.
The main trend has been bearish for almost a full year, and this is the first time the coin shows a solid signal of a trend reversal — the red trendline has been broken, and the previous high (marked on the chart) has been taken out.
Breaking the trendline with a massive green candle is a strong confirmation for buyers' momentum in this area.
Taking out the high indicates a shift from a downtrend to an uptrend.
It’s crucial that the blue line (the broken high) does not get lost to the downside.
Best regards Ceciliones 🎯

Is now the perfect time to trade Pengu’s 0.040$ gain?Hello and greetings to all the crypto enthusiasts, ✌
In several of my previous analyses, I have accurately identified and hit all of the gain targets. In this analysis, I aim to provide you with a comprehensive overview of the future price potential for Pengu , 📚💡
At present, the market is experiencing a period of consolidation, characterized by a range-bound structure and a general downward trend. As such, it is entirely normal for the price to form red candles, particularly as it approaches our critical support level. This behavior aligns with the current market conditions. 📚💡
Once this support is tested and held, we expect the price to reverse course, potentially seeing an upward surge of up to 40%. Such a move would bring the price to approximately $0.040, signaling a strong recovery and growth potential. This scenario suggests a favorable opportunity for those looking to enter the market at these levels. 📚✨
🧨 Our team's main opinion is: 🧨
The market is currently range-bound and slightly bearish, with red candles expected as it approaches key support. Once support holds, we anticipate a potential 40% rise, reaching $0.040.
Give me some energy !!
✨We invest countless hours researching opportunities and crafting valuable ideas. Your support means the world to us! If you have any questions, feel free to drop them in the comment box.
Cheers, Mad Whale. 🐋

PENGUUSDT 6HPENGU ~ 6H
#PENGU if you still have Conviction on this coin,. Buy gradually when retesting this support level,.

Pudgy Penguins Best Level to BUY/HOLD 300%+ gains🔸Hello guys, today let's review 2h price chart for PENGU . Currently locked inside trading range expecting more range bound price action before accumulation completes later and we get another strong bull run.
🔸Ongoing accumulation in progress indicates further gains later this month. currently trading near range highs so no trades recommended at the market price.
🔸Recommended strategy bulls: bullish structure accumulation in progress. Accumulate near 0.025, TP bulls is +300%+ gains, final exit at 10 cents. good luck traders!
🎁Please hit the like button and
🎁Leave a comment to support our team!
RISK DISCLAIMER:
Trading Futures , Forex, CFDs and Stocks involves a risk of loss.
Please consider carefully if such trading is appropriate for you.
Past performance is not indicative of future results.
Always limit your leverage and use tight stop loss.

PENGU is a chosen one.PENGU energizes the Pudgy Penguins community by promoting teamwork, encouraging active involvement, and backing creative projects within the ecosystem. It enhances liquidity and streamlines transactions, ensuring the project remains competitive in the bustling blockchain arena.
Conclusion
The introduction of PENGU on Solana represents a pivotal moment for Pudgy Penguins, showcasing its dedication to expansion and innovation. This token acts as a connector between the project and its community, nurturing stronger connections and paving the way for a thriving ecosystem.
