PENGU/USDT – at Key Zone: Major Accumulation or Breakdown Ahead?Current Situation
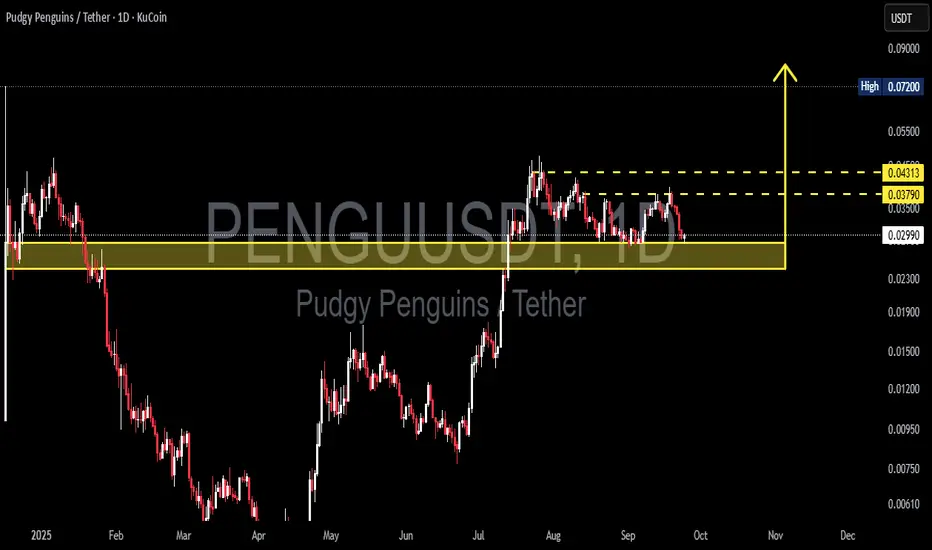
On the daily chart, PENGU/USDT is trading around ~0.0298 USDT, sitting directly above the critical support zone at 0.023 – 0.030 (highlighted in yellow). This zone is significant because:
It previously acted as strong resistance earlier in 2025.
Once broken in July, it flipped into key support (demand zone).
Now it’s being retested, making this area a decisive turning point.
---
Price Structure & Patterns
1. Range Accumulation: After a strong rally in July–August, price is consolidating, creating a potential base.
2. Resistance Cluster: Two overhead resistances are clear:
0.03790 → first minor resistance.
0.04313 → major resistance level.
3. Breakout Potential: A daily close above 0.04313 could open the path toward the structural high at 0.072.
4. Distribution vs. Accumulation: Current range could play out either way — buyers holding the zone (accumulation) or sellers unloading before a deeper breakdown (distribution).
---
Bullish Scenario (Rebound Potential)
Trigger: Daily bullish close above 0.029–0.030 with rising volume.
Short-term targets:
0.03790 → minor resistance.
0.04313 → major upside target in this range.
Mid-term target: A confirmed breakout above 0.04313 could extend to 0.072 (previous structural high).
Confirmation signals: Bullish candlestick patterns (hammer / engulfing) within the support zone would strengthen the bullish case.
---
Bearish Scenario (Breakdown Risk)
Trigger: A strong daily close below 0.023 with high selling volume.
Implication: The mid-term bullish structure fails, pushing PENGU back into a downtrend.
Targets: Deeper corrections toward historical demand zones around 0.020 → 0.015 → 0.012.
Distribution signs: A series of lower highs followed by a confirmed range breakdown.
---
Market Psychology
Buyers are defending the 0.023–0.030 zone, signaling potential accumulation.
Sellers are waiting for breakdown confirmation below support to trigger panic selling.
This is a make-or-break moment for PENGU — a classic battleground between bulls and bears.
---
Conclusion
The 0.023–0.030 zone is the decisive level for PENGU’s next big move.
Bullish if it holds → targets at 0.0379 → 0.04313 → 0.072.
Bearish if it breaks down <0.023 → opens the door to deeper corrections.
Best approach: Wait for confirmation (daily close + volume) before committing to aggressive positions.
---
#PENGU #PudgyPenguins #Crypto #Altcoins #TA #TechnicalAnalysis #CryptoTrading #PriceAction
PENGUUSDC
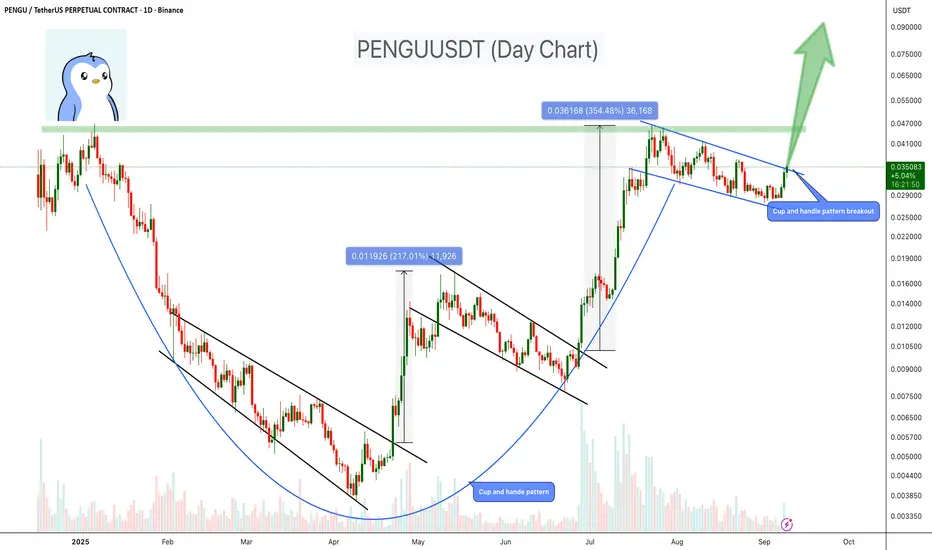
PENGU – Cup & Handle Breakout Loading?PENGU is showing a powerful technical setup with a Cup & Handle pattern forming on the daily chart – a classic bullish continuation pattern. Combined with its history of explosive moves after descending channel breakouts, this setup suggests strong upside potential.
Key Highlights:
- Cup & Handle Formation: The rounded base (cup) has formed, and the handle (descending channel) is nearly complete. A breakout above resistance would confirm the bullish pattern.
- Historical Rallies:
May breakout → +217% rally.
July breakout → +354% rally.
- Current Structure: Price is breaking out of the handle (descending channel), which aligns with the bullish continuation setup.
- Potential Target: Cup & handle breakout could project upside toward $0.07–$0.1.
- Volume Watch: Increasing volume during breakout would strengthen confirmation.
Cheers
Hexa
COINBASE:PENGUUSD BINANCE:PENGUUSDT
PENGU/USDT — Descending Channel!, Bull-Flag or Breakdown?🔎 Technical Analysis
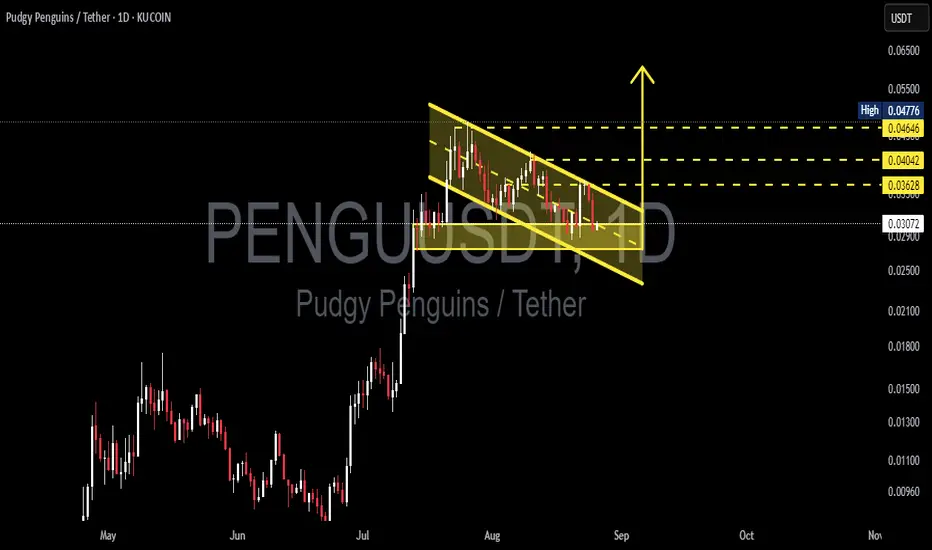
Currently, PENGU/USDT is trading inside a descending channel following a sharp rally in July–August. This structure often appears as a healthy consolidation after a strong impulse move and can be classified as a bull-flag pattern — a potential bullish continuation setup waiting for confirmation.
Key Support: 0.0306 remains the critical demand zone. Multiple retests have held this level, making it an important line in the sand.
Key Resistance: The upper boundary of the channel, along with 0.03628, 0.04042, and 0.04646–0.04776, are the major upside targets if a breakout occurs.
Pattern Structure: Lower highs and lower lows forming a clean descending channel, but still within the context of a broader bullish trend.
Confirmation: A breakout above the channel with strong volume would confirm the bull-flag setup. A breakdown below 0.0306, however, would invalidate it and shift bias bearish.
---
🚀 Bullish Scenario
1. Channel Breakout: If price breaks above the descending channel and closes daily above 0.03628, upside targets include:
🎯 Target 1: 0.03628
🎯 Target 2: 0.04042
🎯 Target 3: 0.04646 – 0.04776
2. Retest Confirmation: A successful retest of the breakout level could provide a safer long entry.
---
🔻 Bearish Scenario
If price fails to hold 0.0306 and breaks down with strong selling volume, downside levels to watch:
📉 0.02500 – 0.02200
📉 possibly extending toward 0.01800 if bearish momentum accelerates.
Such a move would invalidate the bull-flag and suggest deeper correction.
---
📝 Trading Notes
Aggressive Approach: Enter near 0.0306 support with tight stop-loss below 0.028 → higher risk/reward but less safe.
Conservative Approach: Wait for a confirmed daily breakout above 0.03628 before entering → safer confirmation.
Risk Management: Always apply stop-loss and size positions properly — false breakouts remain a risk.
---
📌 Conclusion
PENGU is at a critical crossroads:
Bullish bias if it breaks out of the channel and reclaims 0.03628 → potential continuation toward 0.046+.
Bearish bias if it loses 0.0306 → downside correction likely toward 0.025–0.022 or lower.
While the overall trend remains bullish from the prior rally, confirmation is key before the next major move.
#PENGU #PudgyPenguins #Crypto #Altcoins #TechnicalAnalysis #PriceAction #BullFlag #DescendingChannel #BreakoutSetup
PENGUUSDT 50%-150% potentialBINANCE:PENGUUSDT is showing a classic cup and handle breakout on the daily chart, supported by a strong upward move and a bullish structure. Price has successfully broken out of key resistance around 0.0173, and volume is picking up. If momentum continues, the projected target points toward the $0.045 level, suggesting a potential upside of 50%-150%. The setup remains valid as long as price stays above the handle low around 0.0141.
Regards
HExa
