PENGU/USDT – at Key Zone: Major Accumulation or Breakdown Ahead?Current Situation
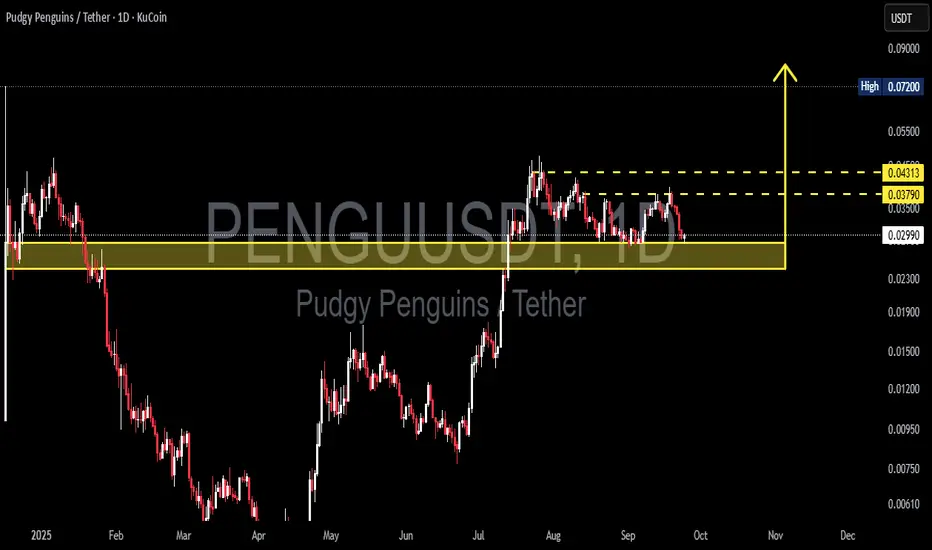
On the daily chart, PENGU/USDT is trading around ~0.0298 USDT, sitting directly above the critical support zone at 0.023 – 0.030 (highlighted in yellow). This zone is significant because:
It previously acted as strong resistance earlier in 2025.
Once broken in July, it flipped into key support (demand zone).
Now it’s being retested, making this area a decisive turning point.
---
Price Structure & Patterns
1. Range Accumulation: After a strong rally in July–August, price is consolidating, creating a potential base.
2. Resistance Cluster: Two overhead resistances are clear:
0.03790 → first minor resistance.
0.04313 → major resistance level.
3. Breakout Potential: A daily close above 0.04313 could open the path toward the structural high at 0.072.
4. Distribution vs. Accumulation: Current range could play out either way — buyers holding the zone (accumulation) or sellers unloading before a deeper breakdown (distribution).
---
Bullish Scenario (Rebound Potential)
Trigger: Daily bullish close above 0.029–0.030 with rising volume.
Short-term targets:
0.03790 → minor resistance.
0.04313 → major upside target in this range.
Mid-term target: A confirmed breakout above 0.04313 could extend to 0.072 (previous structural high).
Confirmation signals: Bullish candlestick patterns (hammer / engulfing) within the support zone would strengthen the bullish case.
---
Bearish Scenario (Breakdown Risk)
Trigger: A strong daily close below 0.023 with high selling volume.
Implication: The mid-term bullish structure fails, pushing PENGU back into a downtrend.
Targets: Deeper corrections toward historical demand zones around 0.020 → 0.015 → 0.012.
Distribution signs: A series of lower highs followed by a confirmed range breakdown.
---
Market Psychology
Buyers are defending the 0.023–0.030 zone, signaling potential accumulation.
Sellers are waiting for breakdown confirmation below support to trigger panic selling.
This is a make-or-break moment for PENGU — a classic battleground between bulls and bears.
---
Conclusion
The 0.023–0.030 zone is the decisive level for PENGU’s next big move.
Bullish if it holds → targets at 0.0379 → 0.04313 → 0.072.
Bearish if it breaks down <0.023 → opens the door to deeper corrections.
Best approach: Wait for confirmation (daily close + volume) before committing to aggressive positions.
---
#PENGU #PudgyPenguins #Crypto #Altcoins #TA #TechnicalAnalysis #CryptoTrading #PriceAction
Penguusdtperp
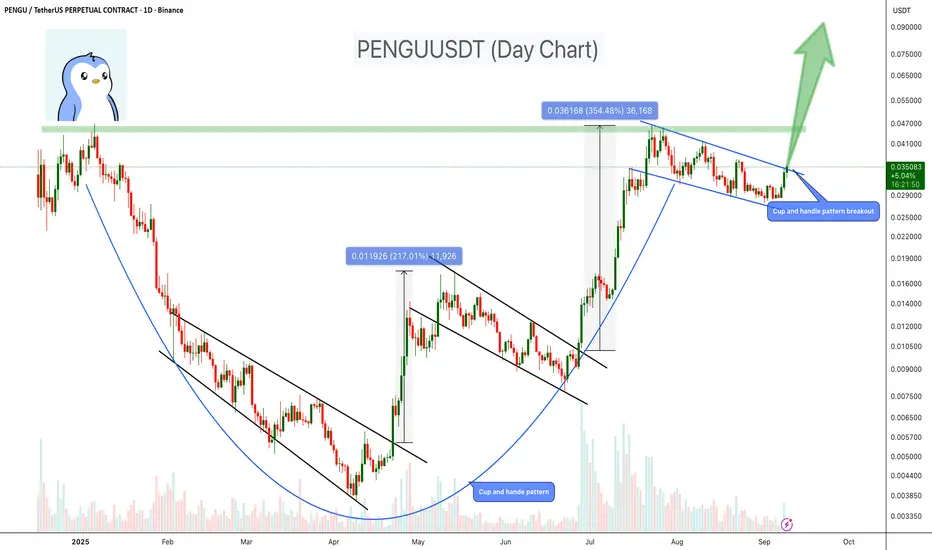
PENGU – Cup & Handle Breakout Loading?PENGU is showing a powerful technical setup with a Cup & Handle pattern forming on the daily chart – a classic bullish continuation pattern. Combined with its history of explosive moves after descending channel breakouts, this setup suggests strong upside potential.
Key Highlights:
- Cup & Handle Formation: The rounded base (cup) has formed, and the handle (descending channel) is nearly complete. A breakout above resistance would confirm the bullish pattern.
- Historical Rallies:
May breakout → +217% rally.
July breakout → +354% rally.
- Current Structure: Price is breaking out of the handle (descending channel), which aligns with the bullish continuation setup.
- Potential Target: Cup & handle breakout could project upside toward $0.07–$0.1.
- Volume Watch: Increasing volume during breakout would strengthen confirmation.
Cheers
Hexa
COINBASE:PENGUUSD BINANCE:PENGUUSDT
PENGU/USDT — Descending Channel!, Bull-Flag or Breakdown?🔎 Technical Analysis
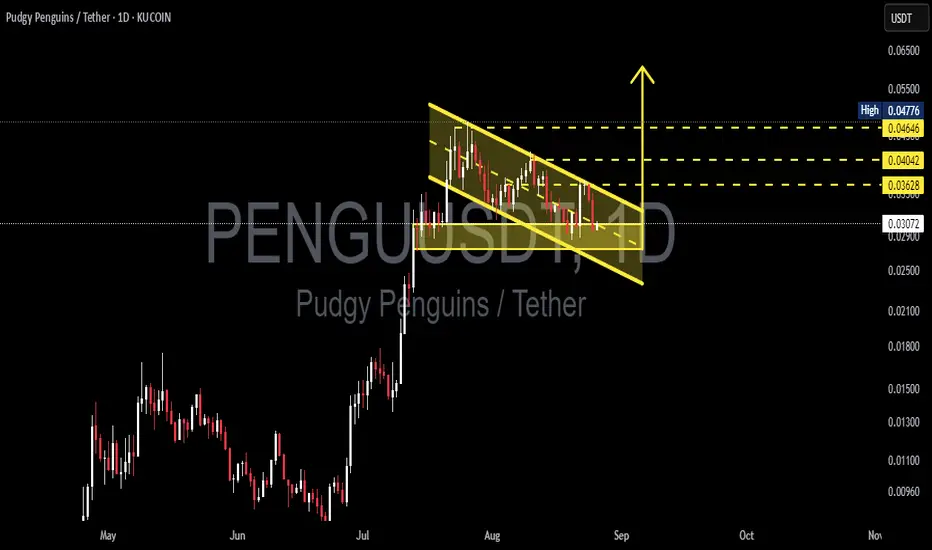
Currently, PENGU/USDT is trading inside a descending channel following a sharp rally in July–August. This structure often appears as a healthy consolidation after a strong impulse move and can be classified as a bull-flag pattern — a potential bullish continuation setup waiting for confirmation.
Key Support: 0.0306 remains the critical demand zone. Multiple retests have held this level, making it an important line in the sand.
Key Resistance: The upper boundary of the channel, along with 0.03628, 0.04042, and 0.04646–0.04776, are the major upside targets if a breakout occurs.
Pattern Structure: Lower highs and lower lows forming a clean descending channel, but still within the context of a broader bullish trend.
Confirmation: A breakout above the channel with strong volume would confirm the bull-flag setup. A breakdown below 0.0306, however, would invalidate it and shift bias bearish.
---
🚀 Bullish Scenario
1. Channel Breakout: If price breaks above the descending channel and closes daily above 0.03628, upside targets include:
🎯 Target 1: 0.03628
🎯 Target 2: 0.04042
🎯 Target 3: 0.04646 – 0.04776
2. Retest Confirmation: A successful retest of the breakout level could provide a safer long entry.
---
🔻 Bearish Scenario
If price fails to hold 0.0306 and breaks down with strong selling volume, downside levels to watch:
📉 0.02500 – 0.02200
📉 possibly extending toward 0.01800 if bearish momentum accelerates.
Such a move would invalidate the bull-flag and suggest deeper correction.
---
📝 Trading Notes
Aggressive Approach: Enter near 0.0306 support with tight stop-loss below 0.028 → higher risk/reward but less safe.
Conservative Approach: Wait for a confirmed daily breakout above 0.03628 before entering → safer confirmation.
Risk Management: Always apply stop-loss and size positions properly — false breakouts remain a risk.
---
📌 Conclusion
PENGU is at a critical crossroads:
Bullish bias if it breaks out of the channel and reclaims 0.03628 → potential continuation toward 0.046+.
Bearish bias if it loses 0.0306 → downside correction likely toward 0.025–0.022 or lower.
While the overall trend remains bullish from the prior rally, confirmation is key before the next major move.
#PENGU #PudgyPenguins #Crypto #Altcoins #TechnicalAnalysis #PriceAction #BullFlag #DescendingChannel #BreakoutSetup
#PENGU #PENGUUSDT #PENGUINS #LONG #AMD #PO3 #Analysis #Eddy#PENGU #PENGUUSDT #PENGUINS #LONG #AMD #PO3 #Setup #Analysis #Eddy
PENGUUSDT.P Scalping Long Setup
This Setup & Analysis is based on a combination of different styles, including the volume style with the ict style. (( AMD SETUP )) "PO3"
Based on your strategy and style, get the necessary confirmations for this scalping setup to enter the trade.
Don't forget risk and capital management.
The entry point are indicated on the chart along with their amounts.
The responsibility for the transaction is yours and I have no responsibility for not observing your risk and capital management.
Note: The price can go much higher than the specified target and have a very good pump.
Be successful and profitable.
