PePe: Falling Wedge Breakout, Trendline BrokenHi,
PEPE formed a clear falling wedge, which is typically a bullish pattern.
Price has now broken the descending trendline with strong momentum, confirming the breakout.
Previous resistance zone is now acting as support
As long as price holds above this area, upside continuation is likely
A short pullback is possible before the next leg up
Pepeanalysis

PEPE/USDT – Daily Timeframe AnalysisBias: Bullish Reversal → Momentum Building
PEPE/USDT is showing strong signs of a trend reversal after an extended bearish phase.
Price has formed a clear base around the 0.40e-5 demand zone, followed by a decisive bullish reaction, indicating that sellers are losing control and buyers are stepping in aggressively.
Technical Confluence
Price has reclaimed short-term structure after prolonged distribution.
RSI (14) has surged into the 70+ region, confirming strong bullish momentum.
The recent impulse suggests a change in market character (ChoCH) from bearish to bullish.
Key Levels to Watch
Major Support: 0.40e-5 – 0.42e-5
Immediate Resistance: 0.72e-5 – 0.80e-5
Higher Resistance Target: 0.94e-5
Bullish Scenario
Holding above 0.42e-5 keeps the bullish structure valid.
A confirmed breakout above 0.80e-5 could trigger continuation toward 0.94e-5 and above.
Bearish Invalidation
A breakdown below 0.40e-5 would invalidate the bullish bias and signal potential continuation of the broader downtrend.
Conclusion
PEPE is transitioning from accumulation to expansion.
Momentum currently favors the bulls, but continuation requires holding above key demand levels.
Trade with confirmation. Risk management remains essential.

Breaking: $PEPE Spike 37% Gearing for 300% SurgeThe price of the notable memecoin on ethereum chain- CRYPTOCAP:PEPE saw its value rise by 37% for the past 24 hours breaking above a bullish symmetrical triangle setting the stage for 300% breakout albeit market drawback.
The memecoin has loss over 72% of its market value for the past 9 months consolidating in a tight symmetrical triangle pattern.
As of the time of writing, CRYPTOCAP:PEPE is up 16% with its RSI at 72, there is more room for CRYPTOCAP:PEPE to capitalise on the bullish symmetrical triangle pattern.
About Pepe
What Is PEPE?
PEPE is a deflationary memecoin launched on Ethereum. The cryptocurrency was created as a tribute to the Pepe the Frog internet meme, created by Matt Furie, which gained popularity in the early 2000s.
The project aims to capitalize on the popularity of meme coins, like Shiba Inu and Dogecoin, and strives to establish itself as one of the top meme-based cryptocurrencies. PEPE appeals to the cryptocurrency community by instituting a no-tax policy and being up-front about its lack of utility, keeping things pure and simple as a memecoin.
Pepe Price Data
The Pepe price today is $0.000006 USD with a 24-hour trading volume of $1,348,293,008 USD. Pepe is up 37.49% in the last 24 hours. The current CoinMarketCap ranking is #36, with a market cap of $2,406,442,835 USD. It has a circulating supply of 420,689,899,653,543 PEPE coins and a max. supply of 420,689,899,653,543 PEPE coins.

PEPEUSDTWe are currently in a corrective phase after the latest bull trend. I believe the price is in the final steps of this downward correction, and if the market breaks above the 0.00000600 level, it could trigger a strong upward move in the next phase.
#pepe #pepeusdt CRYPTOCAP:PEPE KRAKEN:PEPEUSD BINANCE:PEPEUSDT

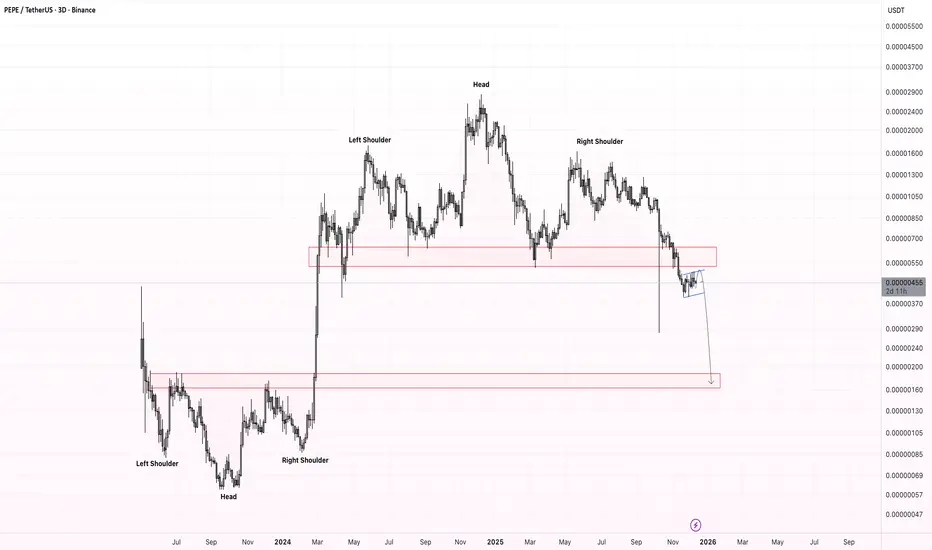
PEPE: Bearish Structure After Major Reversal PatternInitially, PEPE showed a powerful impulsive rally formed through an inverse Head and Shoulders reversal pattern. However, at the top a clear Head and Shoulders pattern has appeared, signaling a potential macro reversal.
Locally, the price is forming a bearish flag , which supports the continuation of the downtrend. Based on the current market structure, I do not recommend buying PEPE at these levels.
My expected downside target:
➡️ 0.000002 – 0.0000016 USDT zone
PEPE Roadmap (3D)If we want to see what PEPE is doing on higher timeframes, we need to analyze it on larger timeframes.
It appears that Wave A of the new cycle will end within the green zone, and the price will enter a retracement for Wave B.
Wave B has two targets, which we have marked on the chart.
Let’s see what happens this movement will take time, as it is on the 3D timeframe.
For risk management, please don't forget stop loss and capital management
When we reach the first target, save some profit and then change the stop to entry
Comment if you have any questions
Thank You

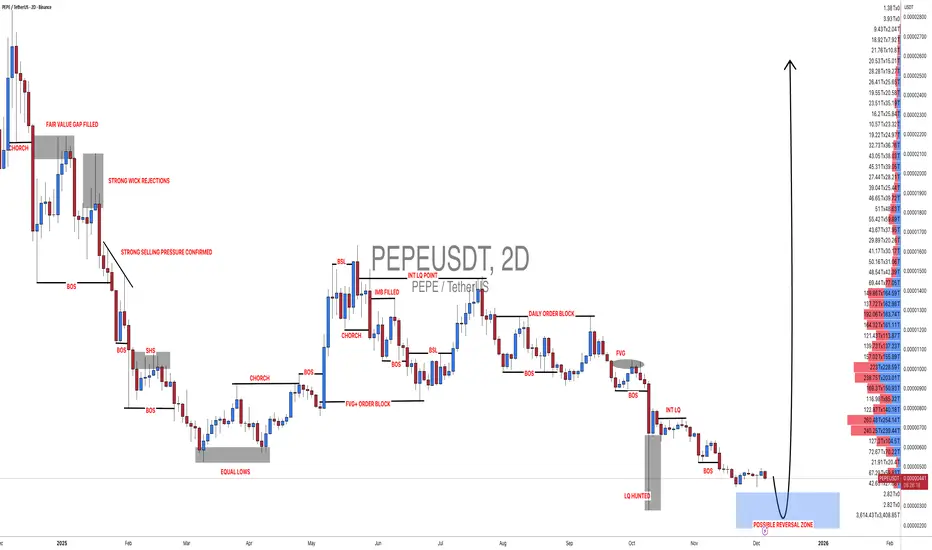
#PEPEUSDT: Big Move Is Coming, Comment Down Your ViewsI hope you are having a good weekend.
Let us focus on the current state of the cryptocurrency market. We have identified a key pattern in the BINANCE:PEPEUSDT which suggests a potential transition from an accumulation phase to a distribution phase.
We recommend waiting for price confirmation such as a break through the straight trend line and subsequent liquidity. Once this is confirmed, we suggest waiting for a price retracement and retesting the area which would serve as the second confirmation.
This is our analysis and not a guaranteed move. Please conduct your own research before making any changes.
Team Setupsfx_
PEPE Buy/Long Signal (2H)PEPE has reached a strong support zone at the bottom of the hourly timeframe.
After the first sweep, it moved downward again, collected liquidity, and then swept the key level.
We have marked two entry points on the chart, which are our intended entries.
We expect the upper liquidity pool to be taken out, or at least for the first target to be hit after the entries are triggered.
The targets are marked on the chart.
If the stop-loss is touched, this setup will be invalidated.
Do not enter the position without capital management and stop setting
Comment if you have any questions
thank you

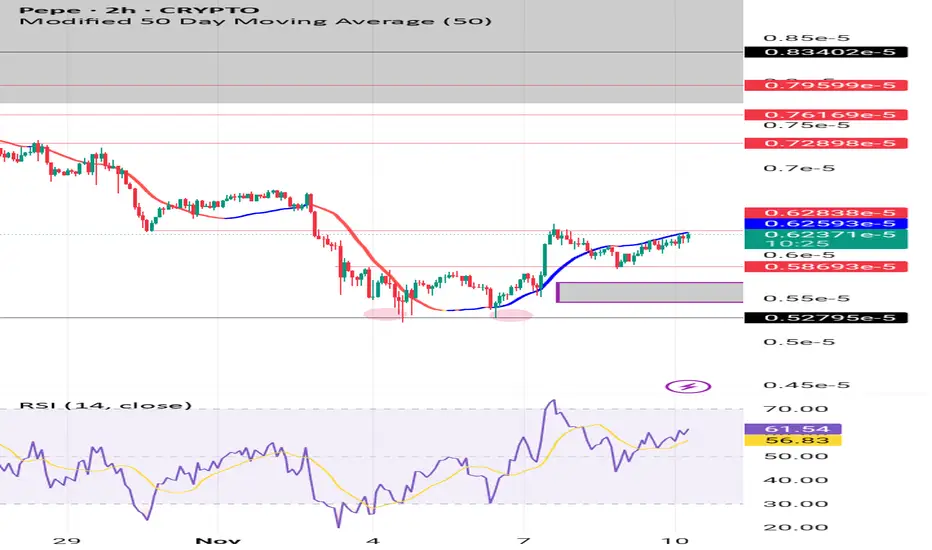
PEPE/USD (2 hour chart Analysis)🟢 PEPE/USD (2-Hour Chart Analysis)
PEPE is currently trading around $0.00000620, sitting slightly below its 50-period moving average, which shows that the short-term trend is still under pressure. The RSI on the 2-hour chart is hovering below 50 — meaning momentum remains weak, but not oversold enough to confirm exhaustion. Price has formed a shallow base near the $0.00000590-$0.00000600 zone, an area that also aligns with a small fair value gap (FVG), suggesting it could act as short-term support if buyers step back in. This area will likely determine whether the next move is a bounce or another slide.
My bias is mildly bullish, but only if confirmation steps in. If PEPE breaks above the 50-period MA with convincing volume, it could trigger a short-term upside move toward $0.00000640-$0.00000650. However, if the price fails to reclaim that moving average and loses support near $0.00000590, a deeper correction could follow. The best move here is patience — let the market show its hand before reacting. As always, PEPE is a high-volatility meme token, so manage risk wisely and never trade with emotions.
PEPEUSDT - The real market indicator?Did you know that PEPE’s chart gave a very strong early signal of the massive crash that happened on October 10th?
It had formed a huge Head and Shoulders pattern, and the target of that pattern was exactly the lowest point reached on October 10th.
Not only that — there was also a massive Death Cross on the 3-day chart, where the 100 EMA crossed below the 25 EMA — a textbook bearish confirmation.
The result?
The pattern played out perfectly, leading straight to the crash on October 10th.
Now, if we use PEPE as a market indicator, things don’t look good — its main trendline (starting from October 23rd two years ago ) has broken, retested, and is heading lower, signaling more downside pressure.
So what do you think?
— have we officially entered a bear market? , or is PEPE just moving independently from the rest of the market?
Drop your thoughts in the comments 👇
Best Regards:
Ceciliones🎯

PEPEUSDT ( BINANCE:PEPEUSDT ) We have a bullish trend because broke latest trendline and pollback to breakeven.
Please control risk management for buy.
Targets: 0.00001200 - 0.00001280 - 0.00001370 - 0.00001550

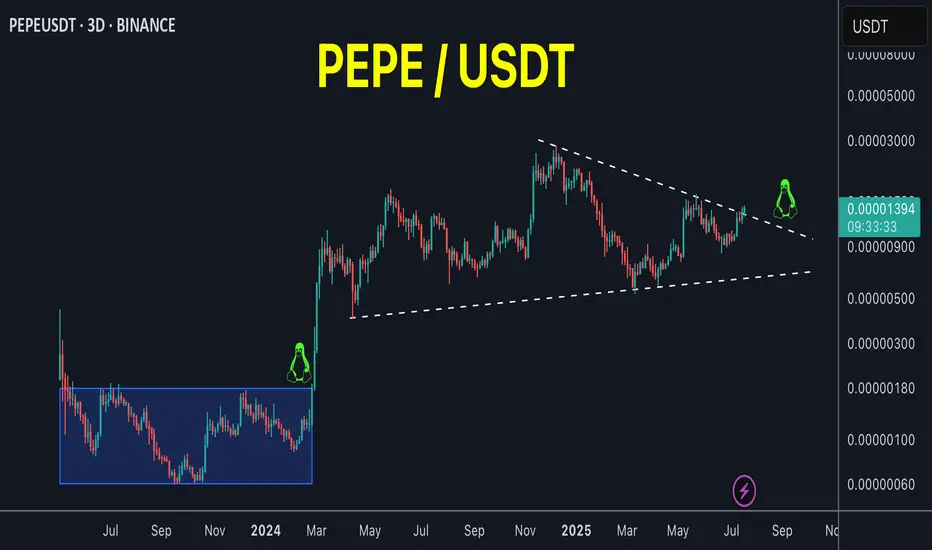
PEPEUSDT -the easiest way to get ur capital Tripled!Let me tell you the fastest way to triple your capital at the beginning of 2026.
The CRYPTOCAP:PEPE chart looks extremely tempting right now, and since it’s one of the coins with insane price action, you really don’t want to miss this opportunity.
On the 3D timeframe , PEPE has formed a symmetrical triangle three times already—just like the one you see here—and every single time it broke out, it did so with a massive green candle that gave no chance for late entries or deep pullbacks.
Another key point: PEPE is currently in a consolidation range very similar to the one it had in 2024 before its explosive rally. But this time, the accumulation has lasted over 550 days, which makes it even stronger.
Now, here’s the real kicker—the part I’ve highlighted in green for you. If you look closely, you’ll notice that before every major breakout, the EMA 25 and EMA 50 always squeezed tightly together. That exact setup is happening again right now.
PEPE is sitting on strong support, inside a long consolidation range. Don’t miss it. Mark my words: a 3x from here is an easy target by the end of 2025.
Best Regards:
Ceciliones🎯

#PEPE/USDT or Breakdown? PEPE Eyes 0.00001166 Target !#PEPE
The price is moving within a descending channel on the 1-hour frame and is expected to break and continue upward.
We have a trend to stabilize above the 100 moving average once again.
We have a downtrend on the RSI indicator that supports the upward break.
We have a support area at the lower boundary of the channel at 0.00000980, acting as a strong support from which the price can rebound.
We have a major support area in green that pushed the price upward at 0.00000990.
Entry price: 0.00001030.
First target: 0.00001075.
Second target: 0.00001120.
Third target: 0.00001166.
To manage risk, don't forget stop loss and capital management.
When you reach the first target, save some profits and then change the stop order to an entry order.
For inquiries, please comment.
Thank you.

PEPE on the verge of breakout!PEPE / USDT
Price is trying to breakout massive downtrend line since 7 months
Incase of breakout we will see strong bullish momentum
Keep an eye on it
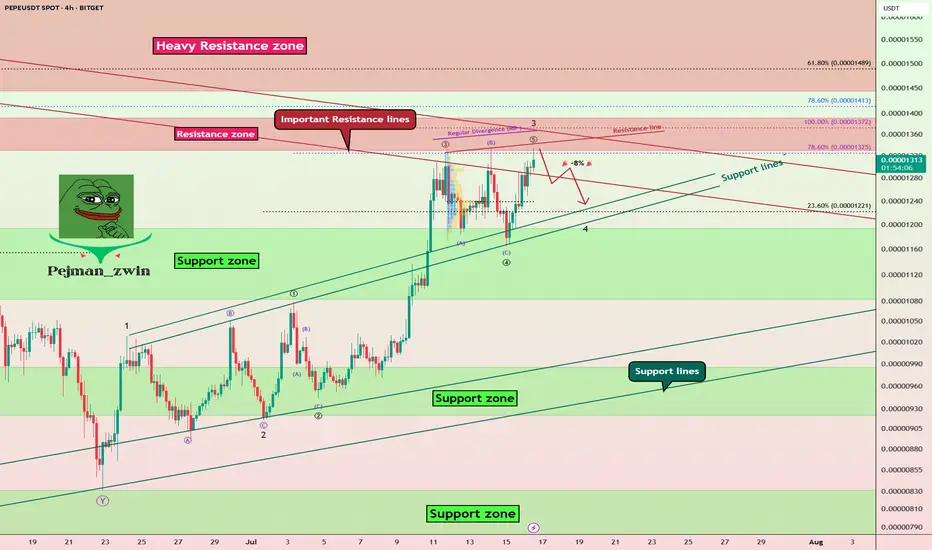
PEPE Faces Key Resistances – Is a -8% Pullback Coming?The PEPE memecoin ( BINANCE:PEPEUSDT ) is currently near the Resistance zone($0.00001392-$0.00001330) and Important Resistance lines . This is the third time that PEPE has attacked the Important Resistance lines .
In terms of Elliott wave theory , it seems that PEPE is completing the microwave 5 of the main wave 3 , so that the main wave 3 is of the extended type .
Also, we can see the Regular Divergence(RD-) between Consecutive Peaks.
I expect a -8% drop for PEPE in the coming hours.
First Target: $0.00001251
Second Target: $0.00001212
Note: Stop Loss(SL)= $0.00001400
Please respect each other's ideas and express them politely if you agree or disagree.
PEPE Analyze (PEPEUSDT), 4-hour time frame.
Be sure to follow the updated ideas.
Do not forget to put a Stop loss for your positions (For every position you want to open).
Please follow your strategy and updates; this is just my Idea, and I will gladly see your ideas in this post.
Please do not forget the ✅' like '✅ button 🙏😊 & Share it with your friends; thanks, and Trade safe.
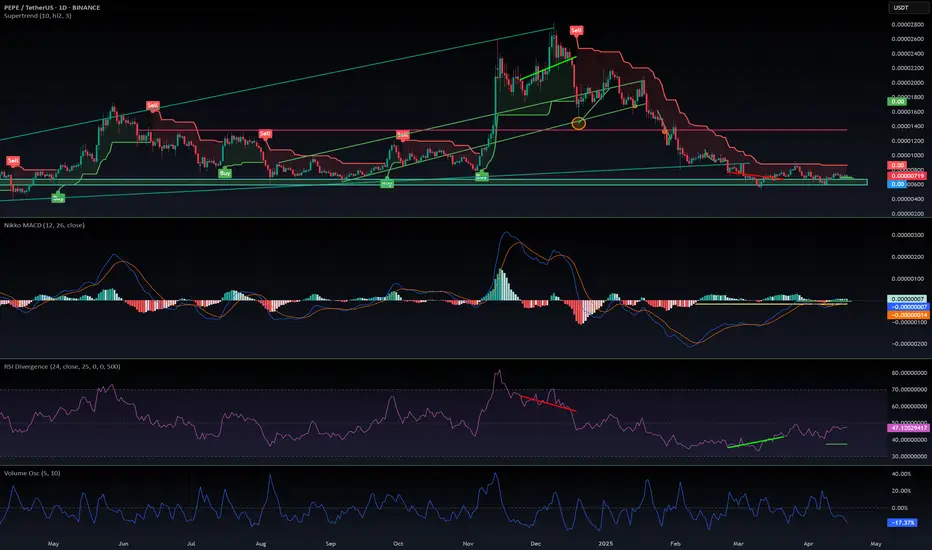
$PEPE looks ready to leap again!CRYPTOCAP:PEPE looks ready to leap again! 🐸
After its massive December 2024 rally, CRYPTOCAP:PEPE has undergone an equally strong correction — but signs suggest the bottom is in.
✅ Strong support at 0.0000700 and 0.0000650
✅ MACD stabilizing
✅ RSI showing a huge bullish divergence
Momentum is building — don’t lose sight of the frog! 🐸🚀
DYOR
#PEPE #Altcoins #CryptoTrading #BullishSetup #RSIDivergence #MemeCoinSeason #CryptoAlert #PEPEArmy
PEPE Ready to Rip? 3 Take-Profits Lined Up from This Key SupportPEPEUSD is currently forming a potential bullish reversal near the key support zone between 0.00001060 and 0.00001099. This level has acted as a solid demand zone previously, with price bouncing off this range multiple times in the recent past. The current price action suggests consolidation above this level, hinting at potential accumulation by buyers.
We can observe a compression in volatility, with recent candles showing smaller bodies and longer wicks near support—classic signs of weakening bearish momentum. The prior price rejection from the 0.00001318 zone and the smooth retracement to support further confirm this as a healthy correction rather than a trend breakdown.
The DPO (Detrended Price Oscillator) is hovering close to zero, suggesting the asset is entering a potential pivot zone. A move into positive territory would support the bullish scenario, ideally confirmed by an increase in volume on the breakout above short-term resistance.
This setup is particularly attractive for scalpers or short-term traders, aiming to capture quick momentum surges across multiple resistance levels.
📌 Trade Setup
• Entry Zone: 0.00001167–0.00001177
• Stop-Loss (SL1): 0.00001060
• Take-Profit 1 (TP1): 0.00001318
• Take-Profit 2 (TP2): 0.00001443
• Take-Profit 3 (TP3): 0.00001603
Strategy Note: The risk-to-reward ratio is highly favorable, particularly for TP2 and TP3. The setup allows for flexible scaling of positions as price hits each resistance level. With no immediate macro threats on the 4H structure and price defending support, this setup offers a clean bullish opportunity.

PEPE at Key Reversal Zone — Support Test Coming Soon?Today I want to look at the PEPE token ( BINANCE:PEPEUSDT ), which is part of the memecoin category, and provide you with a short-term analysis on the 1-hour timeframe .
PEPE token is trading in Potential Reversal Zone(PRZ) .
In terms of Elliott wave theory , the PEPE token appears to be completing the microwave 5 of the main wave C . The structure is a Zigzag Correction(ABC/5-3-5) .
Also, we can see the Regular Divergence(RD-) between Consecutive Peaks .
I expect the PEPE token to attack the Support zone($0.0000120-$0.0000108) after completing the main wave C .
Note: Stop Loss = $0.0000362
Please respect each other's ideas and express them politely if you agree or disagree.
Pepe Analyze (PEPEUSDT), 1-hour time frame.
Be sure to follow the updated ideas.
Do not forget to put a Stop loss for your positions (For every position you want to open).
Please follow your strategy and updates; this is just my Idea, and I will gladly see your ideas in this post.
Please do not forget the ✅' like '✅ button 🙏😊 & Share it with your friends; thanks, and Trade safe.

Is PEPE Ready for Its Next Leg Up? Key Support Levels to Watch! PEPE/USDT Analysis: Bullish Trend, Pullback, and Opportunity 🚀🐸
👋 Today, I’m taking a look at the PEPE/USDT chart. We’ve seen PEPE in a strong bullish trend lately, riding a strong momentum wave. Theres a shift at the moment when you look at the broader market—US dollar strength is still in play, and we’re seeing some pullbacks in Bitcoin and other major cryptos. 💵📉
PEPE is starting to pull back. This isn’t a bad thing—in fact, healthy pullbacks are what set up the next big moves. What I’m watching for is a retracement down into a key support zone. If price can hold there and we see a bullish break of structure, that’s my cue to look for a buy opportunity. 🛑➡️📈
The key here is patience. I want to see confirmation that buyers are stepping back in—i.e. strong bullish candles, a clear break of the recent lower high (BoS), or even a spike in volume. If we get that, I’ll be ready to ride the next leg up. Until then, I’m biding my time and letting the market come to me. 🕰️
Remember, no FOMO—let the setup come to you, and always manage your risk.🍀

#PEPEUSDT: Ready to launch | Will price hit previous high? EPEUSDT’s price has accumulated and is currently in the distribution phase, where we can anticipate a bullish impulse pattern. There are three targets, but our long-term objective is for the price to surpass its previous record high. We anticipate the price to reach or even surpass the previous high.
Wishing you good luck and safe trading!
Thank you for your unwavering support! 😊
If you’d like to contribute, here are a few ways you can help us:
- Like our ideas
- Comment on our ideas
- Share our ideas
Team Setupsfx_
❤️🚀

PEPE / USDT : rebounding from support, prepping for breakout PEPE/USDT: Rebounding Strongly from Trendline Support, Prepping for a Breakout
PEPE/USDT is showing signs of strength 📈 as it rebounds from a critical trendline support zone 📊. The pair is forming a bullish setup, indicating a potential breakout 💥 in the coming days. If this breakout materializes, we could witness a powerful bullish rally 🚀. Stay vigilant 👀 and wait for confirmation before taking action.
Key Insights:
1. Trendline Support: PEPE/USDT is respecting a long-standing trendline support, providing a solid foundation for a potential upward move. A breakout above resistance could trigger a strong bullish trend.
2. Volume Surge: Monitor trading volume closely—a significant increase during the breakout will confirm buyer strength 🔥.
3. Bullish Signals: Momentum indicators such as RSI and MACD are turning upward ⚡, supporting the likelihood of a bullish breakout.
Steps to Confirm the Breakout:
Wait for a decisive 4H or daily candle closing above the immediate resistance level 📍.
A noticeable spike in volume during the breakout will confirm strong buying activity 📊.
A successful retest of the broken resistance as a new support zone adds credibility to the move ✅.
Watch out for fake breakouts, such as wicks above the resistance or sudden reversals ⚠️.
Risk Management Strategies:
Set stop-loss orders below the trendline support to protect your capital 🔒.
Position sizing should align with your overall trading plan and risk tolerance 🎯.
This analysis is for educational purposes only and not financial advice. Always conduct your own research (DYOR) 🔍 before making investment decisions.

pepe coin can be legend?"🌟 Welcome to Golden Candle! 🌟
We're a team of 📈 passionate traders 📉 who love sharing our 🔍 technical analysis insights 🔎 with the TradingView community. 🌎
Our goal is to provide 💡 valuable perspectives 💡 on market trends and patterns, but 🚫 please note that our analyses are not intended as buy or sell recommendations. 🚫
Instead, they reflect our own 💭 personal attitudes and thoughts. 💭
Follow along and 📚 learn 📚 from our analyses! 📊💡"

PEPE. Smart Money Is Betting Big on PEPE. 12/14/24On December 10th, nine wallets (likely belonging to the same investor) invested 13.8 million DAI to purchase 555 billion PEPE, with an average buying price of $0.000025.
I believe that #PEPE is a dark horse that could deliver a major surprise by the end of this cycle. However, always keep in mind the potential scenario where we may drop to retest the mirrored level at any moment.
A possible strategy: allocate 25% of your intended investment at the current price and set 2-3 limit orders down to the support level marked on the chart. The target is also indicated on the chart.
DYOR.
