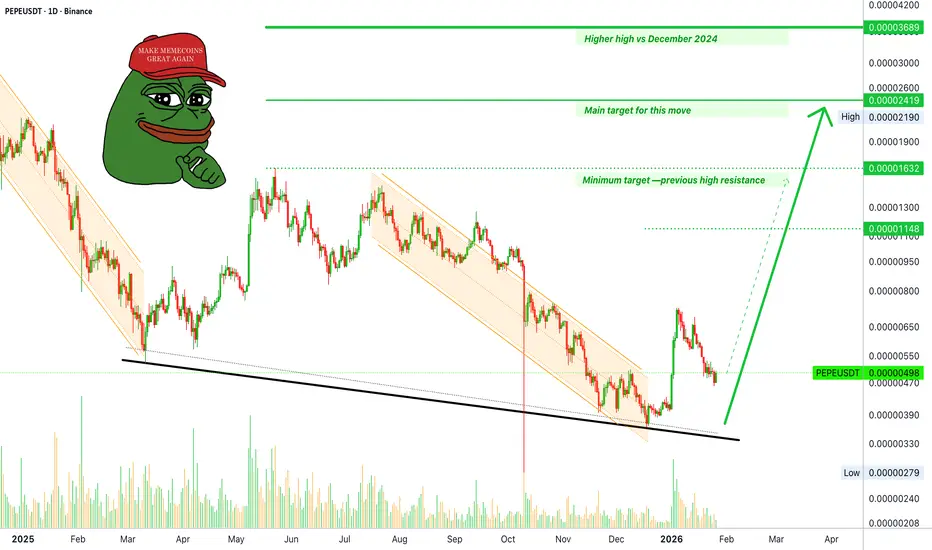
PEPEUSDT 1,930% profits potential with 5X leverage —LONG tradeThis is another powerful chart setup. Good for PEPEUSDT is the fact that the action is already confirmed bullish. There was a strong bullish breakout, with high volume, very recently, and the retrace is ending yesterday with a higher low.
Nothing more needs to be said. A higher low will lead to a higher high and this opens up an opportunity for us to trade.
Full trade-numbers below:
_____
LONG PEPEUSDT
Leverage: 5X
Potential: 1930%
Allocation: 5%
Entry zone: 0.00000430 - 0.00000510
Targets:
1) 0.00000550
2) 0.00000663
3) 0.00000848
4) 0.00001148
5) 0.00001362
6) 0.00001625
7) 0.00001933
8) 0.00002119
9) 0.00002419
Stop: Close weekly below 0.00000420
_____
Thank you for reading.
Namaste.
Pepelong
PePe: Falling Wedge Breakout, Trendline BrokenHi,
PEPE formed a clear falling wedge, which is typically a bullish pattern.
Price has now broken the descending trendline with strong momentum, confirming the breakout.
Previous resistance zone is now acting as support
As long as price holds above this area, upside continuation is likely
A short pullback is possible before the next leg up

Breaking: $PEPE Spike 37% Gearing for 300% SurgeThe price of the notable memecoin on ethereum chain- CRYPTOCAP:PEPE saw its value rise by 37% for the past 24 hours breaking above a bullish symmetrical triangle setting the stage for 300% breakout albeit market drawback.
The memecoin has loss over 72% of its market value for the past 9 months consolidating in a tight symmetrical triangle pattern.
As of the time of writing, CRYPTOCAP:PEPE is up 16% with its RSI at 72, there is more room for CRYPTOCAP:PEPE to capitalise on the bullish symmetrical triangle pattern.
About Pepe
What Is PEPE?
PEPE is a deflationary memecoin launched on Ethereum. The cryptocurrency was created as a tribute to the Pepe the Frog internet meme, created by Matt Furie, which gained popularity in the early 2000s.
The project aims to capitalize on the popularity of meme coins, like Shiba Inu and Dogecoin, and strives to establish itself as one of the top meme-based cryptocurrencies. PEPE appeals to the cryptocurrency community by instituting a no-tax policy and being up-front about its lack of utility, keeping things pure and simple as a memecoin.
Pepe Price Data
The Pepe price today is $0.000006 USD with a 24-hour trading volume of $1,348,293,008 USD. Pepe is up 37.49% in the last 24 hours. The current CoinMarketCap ranking is #36, with a market cap of $2,406,442,835 USD. It has a circulating supply of 420,689,899,653,543 PEPE coins and a max. supply of 420,689,899,653,543 PEPE coins.

PEPEUSDTWe are currently in a corrective phase after the latest bull trend. I believe the price is in the final steps of this downward correction, and if the market breaks above the 0.00000600 level, it could trigger a strong upward move in the next phase.
#pepe #pepeusdt CRYPTOCAP:PEPE KRAKEN:PEPEUSD BINANCE:PEPEUSDT

#PEPEUSDT: Big Move Is Coming, Comment Down Your ViewsI hope you are having a good weekend.
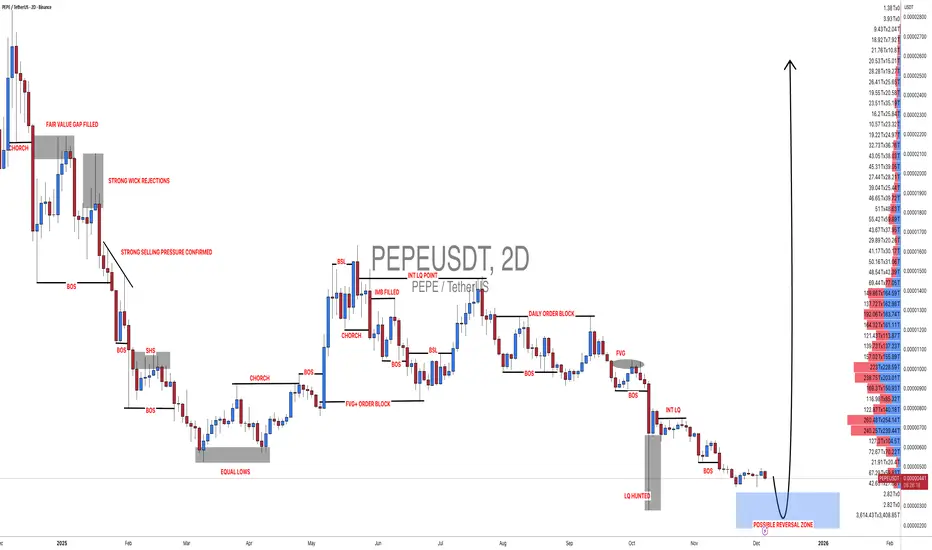
Let us focus on the current state of the cryptocurrency market. We have identified a key pattern in the BINANCE:PEPEUSDT which suggests a potential transition from an accumulation phase to a distribution phase.
We recommend waiting for price confirmation such as a break through the straight trend line and subsequent liquidity. Once this is confirmed, we suggest waiting for a price retracement and retesting the area which would serve as the second confirmation.
This is our analysis and not a guaranteed move. Please conduct your own research before making any changes.
Team Setupsfx_
BUY AND HOLDHello friends
Given the potential and good support that this currency has, with the growth of Ethereum, it can experience another upward rally. Now that the price has corrected, you can buy in steps with capital and risk management and move with it to the specified goals.
Note that the holding period is at least 3 months, so be patient and observe capital management.
*Trade safely with us*

PEPE; FREE SIGNAL!!!Hello friends
Given the buyers' support for the price and the downtrend breakdown, if the two specified supports are maintained, the price can move to the specified targets.
*Trade safely with us*

PEPEUSDT ( BINANCE:PEPEUSDT ) We have a bullish trend because broke latest trendline and pollback to breakeven.
Please control risk management for buy.
Targets: 0.00001200 - 0.00001280 - 0.00001370 - 0.00001550

PEPEUSDT -the easiest way to get ur capital Tripled!Let me tell you the fastest way to triple your capital at the beginning of 2026.
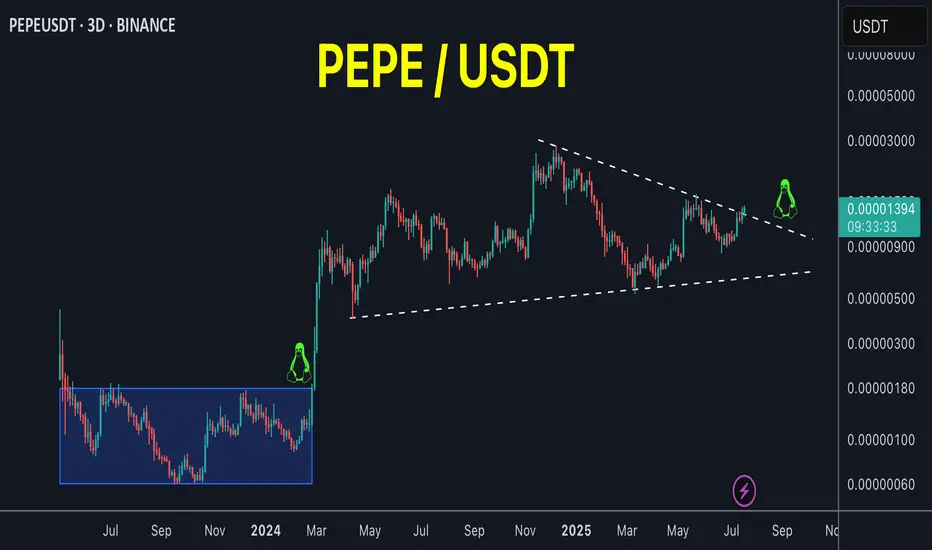
The CRYPTOCAP:PEPE chart looks extremely tempting right now, and since it’s one of the coins with insane price action, you really don’t want to miss this opportunity.
On the 3D timeframe , PEPE has formed a symmetrical triangle three times already—just like the one you see here—and every single time it broke out, it did so with a massive green candle that gave no chance for late entries or deep pullbacks.
Another key point: PEPE is currently in a consolidation range very similar to the one it had in 2024 before its explosive rally. But this time, the accumulation has lasted over 550 days, which makes it even stronger.
Now, here’s the real kicker—the part I’ve highlighted in green for you. If you look closely, you’ll notice that before every major breakout, the EMA 25 and EMA 50 always squeezed tightly together. That exact setup is happening again right now.
PEPE is sitting on strong support, inside a long consolidation range. Don’t miss it. Mark my words: a 3x from here is an easy target by the end of 2025.
Best Regards:
Ceciliones🎯

PEPE UPDATEHello friends
considering the decline we had, we seem to have a buying volume, but it is not yet fully confirmed and we must wait for the support or resistance to break. The targets are specified.
*Trade safely with us*

PEPE : GOOD POINTHello friends
Given the good growth we had, the price has now corrected and is in a good support area.
I think if this range is maintained, the price will grow to the specified targets.
*Trade safely with us*

Pepe looks ready to blast off [long]Pepe is equip to blast off into the metasphere. Just look at the squeeze moment indicator on the two week. Would you look at that. Just look at it. Look at it. Just look at it. Would you look at that.
Even on the weekly time frame PepeUSDT looks ready for a large green D.
I like to use that pmar to get a feel for what it's really going to do. It looks like it has A LOT of room to move
The daily time frame doesn't look so hot. The squeeze is in the green already. However Every other time frame less than one day so 14 hours 12 hours 10 hours etcetera etcetera they're all pointing to the fact that we're going into the green.
GOOD NEWS! Have you found a paid indicator that works wonderfully? Let me know and I will recreate it for you by it and I'll invite you to have access to. I won't give it out freely To everyone. It will just be myself and you that has it. so send me with the indicator and I'll code it up for you! Send me a DM with to the paid version like their website which tells about it and I will recreate it for you.
MORE GOOD NEWS!
I'm going to be calling hot solana meme coins very soon so MAKE SURE TO FOLLOW ME! The fact is there's a secret... I won't be just blatantly writing a message like this with an analysis I will only be changing my profile picture to the coin's name. so you'll have to visit my profile often. I will leave the date in my bio and I will write "updated 08/18/25 6:16PM" As an example so you know exactly when the signal was called. so make sure to follow me!
Make sure to like this post. That way it will help me to gain more followers and it will help all of us. do your part to help me and I will help you immensely.
Sincerely,
rocket

#PEPE/USDT or Breakdown? PEPE Eyes 0.00001166 Target !#PEPE
The price is moving within a descending channel on the 1-hour frame and is expected to break and continue upward.
We have a trend to stabilize above the 100 moving average once again.
We have a downtrend on the RSI indicator that supports the upward break.
We have a support area at the lower boundary of the channel at 0.00000980, acting as a strong support from which the price can rebound.
We have a major support area in green that pushed the price upward at 0.00000990.
Entry price: 0.00001030.
First target: 0.00001075.
Second target: 0.00001120.
Third target: 0.00001166.
To manage risk, don't forget stop loss and capital management.
When you reach the first target, save some profits and then change the stop order to an entry order.
For inquiries, please comment.
Thank you.

High R:R Play on PEPE — 3.2X Reward WaitingThe PEPEUSDT 4H chart clearly shows that the market has been in a downtrend since late July, forming consistent lower highs and lower lows. The trend indicator lines (red above price, blue below) suggest that bearish momentum has been dominant for several sessions.
From July 28 onwards, price tested the short-term moving average multiple times but failed to break above it, confirming that sellers remain in control. However, over the past few candles, we can see that price has started to slow its decline and is now consolidating near the 0.00001145 support zone. This is an area where buyers have previously stepped in, making it a potential pivot point for a short-term bounce.
The marked trade idea on the chart suggests a countertrend long trade. This makes sense because the market is oversold on lower timeframes and showing signs of accumulation. The upside target is set just below a prior reaction level at 0.00001289, which has historically acted as resistance. This creates an opportunity for a clean bounce if buying pressure increases.
Trade Setup
• Entry: 0.00001145 (at current support)
• Stop Loss: 0.00001100 (below recent swing low)
• Take Profit: 0.00001289 (targeting prior resistance)
• Risk-to-Reward Ratio: ~1:3.2
• Trade Bias: Short-term countertrend long

PEPE on the verge of breakout!PEPE / USDT
Price is trying to breakout massive downtrend line since 7 months
Incase of breakout we will see strong bullish momentum
Keep an eye on it
PEPEUSD going to moon according to my analysis. {08/june/2025}Educational Analysis says that PEPEUSD may give trend Trading opportunities from this range, according to my technical analysis.
Broker - binance
So, my analysis is based on a top-down approach from weekly to trend range to internal trend range.
So my analysis comprises of two structures: 1) Break of structure on weekly range and 2) Trading Range to fill the remaining fair value gap
Let's see what this pair brings to the table for us in the future.
Please check the comment section to see how this turned out.
DISCLAIMER:-
This is not an entry signal. THIS IS FOR EDUCATIONAL PURPOSES ONLY.
I HAVE NO CONCERNS WITH YOUR PROFIT OR LOSS,
Happy Trading, Fx Dollars.

Pepe update hello friends✋️
Considering the drop we had, you can see that the price was well supported in the specified area and buyers came in. Now in the return of the price, we can buy step by step in the specified support areas and move with it until the specified goals, of course, with the management of shame and risk...
*Trade safely with us*

PEPE Ready to Rip? 3 Take-Profits Lined Up from This Key SupportPEPEUSD is currently forming a potential bullish reversal near the key support zone between 0.00001060 and 0.00001099. This level has acted as a solid demand zone previously, with price bouncing off this range multiple times in the recent past. The current price action suggests consolidation above this level, hinting at potential accumulation by buyers.
We can observe a compression in volatility, with recent candles showing smaller bodies and longer wicks near support—classic signs of weakening bearish momentum. The prior price rejection from the 0.00001318 zone and the smooth retracement to support further confirm this as a healthy correction rather than a trend breakdown.
The DPO (Detrended Price Oscillator) is hovering close to zero, suggesting the asset is entering a potential pivot zone. A move into positive territory would support the bullish scenario, ideally confirmed by an increase in volume on the breakout above short-term resistance.
This setup is particularly attractive for scalpers or short-term traders, aiming to capture quick momentum surges across multiple resistance levels.
📌 Trade Setup
• Entry Zone: 0.00001167–0.00001177
• Stop-Loss (SL1): 0.00001060
• Take-Profit 1 (TP1): 0.00001318
• Take-Profit 2 (TP2): 0.00001443
• Take-Profit 3 (TP3): 0.00001603
Strategy Note: The risk-to-reward ratio is highly favorable, particularly for TP2 and TP3. The setup allows for flexible scaling of positions as price hits each resistance level. With no immediate macro threats on the 4H structure and price defending support, this setup offers a clean bullish opportunity.

Don't miss today's signal.Hello friends
Given the good growth we had, the price has corrected and now we can buy in steps in the specified areas with capital and risk management and move with it to the set goals.
*Trade safely with us*

High R/R Swing Setup on PEPE – Eyes on 100%+ MoveThe 1D chart for PEPEUSDT is showing a clean bullish structure, supported by repeated rejections from a key support level and a recent breakout above short-term resistance. This setup offers a simple yet potentially high-reward trade opportunity for swing traders.
📊 Trade Setup
Entry: 0.00001269 USDT
Price has confirmed a bullish reversal and is currently hovering above a minor consolidation range, presenting a strong opportunity for a long position.
Stop Loss: 0.00001079 USDT
Placed just below the previous local lows to invalidate the setup in case of a breakdown.
Take Profit 1 (TP1): 0.00002135 USDT
This level represents a previous high and a clear horizontal resistance zone.
Take Profit 2 (TP2): 0.00002844 USDT
A higher resistance level, also aligning with historical price action, offering a potential 103% gain from entry.
📈 Technical Justification
Key Support Holding: Price has shown multiple rejections near the 0.00000565 USDT level, forming a strong support base. Each rejection has resulted in a higher low, indicating increasing bullish momentum.
Trendline Confirmation: The ascending trendline shows sustained bullish pressure and confirms the strength of the ongoing trend.
Breakout Setup: Current price action indicates a breakout from consolidation, supported by volume. The bullish structure remains intact as long as the price holds above the 0.00001079 SL region.
Risk-to-Reward: The setup offers an attractive 4.5 R/R ratio, making it highly favorable for swing trading.
📌 Summary
This is a clean, trend-continuation trade with defined risk and strong technical backing. Traders looking for a mid-term opportunity should keep an eye on volume and price action around TP1 for potential partial exits or trailing stop adjustments.

PEPE 80% Profit🚀 BINANCE:PEPEUSDT just made a big move!
It surged from 0.00000820 to 0.00001244 and then corrected to 0.00000956 📉
Now it’s sitting on strong support — and if it holds, another rally could be on the way! 💥
🎯 Next resistance levels:
0.00001244 (recent high)
0.00001719 (next key level)
0.00002317 (major long-term target) 🏁
📌 Key support zones:
0.00000956 (current support)
0.00000820 (late May support)

#PEPE/USDT#PEPE
The price is moving within a descending channel on the 1-hour frame, adhering well to it, and is on its way to breaking it strongly upwards and retesting it.
We are seeing a bounce from the lower boundary of the descending channel. This support is at 0.00000570.
We have a downtrend on the RSI indicator that is about to break and retest, supporting the upward trend.
We are looking for stability above the 100 moving average.
Entry price: 0.00000700
First target: 0.00000751
Second target: 0.00000798
Third target: 0.00000871

PEPEUSDT - Now waiting for another 100% move.It already made a 100% move from the zone we mentioned earlier, breaking the downtrend line with a massive bullish candle on the 3-day timeframe.
It’s now on its way to forming a new all-time high (ATH).
Best regards Ceciliones 🎯
