Will You Miss PEPE’s Next Explosion? Smart Money Is Already In!Yello Paradisers! Are you watching this closely enough? Because #PEPE respecting critical ascending support, and if you're not prepared, you might miss out on a huge opportunity. Additionally, we are seeing selling climax has been formed, a classic probability that institutional buyers are stepping in. This is where things start to get exciting.
💎#PEPE has just formed a classic selling climax, followed by a climactic action candle with ultra-high volume a textbook sign of accumulation. This is the kind of behaviour we’ve seen over and over again when smart money starts positioning quietly before the real move begins.
💎After the selling climax, #PEPE successfully swept liquidity of selling climax with effort vs result test a strong possibility that weak hands are out and stronger ones are stepping in. If momentum sustained, the next probability of potential target lies at 4760, a major structural and resistance zone.
💎#PEPE overall structure is bullish on higher time frames and on retracement it respecting the ascending support. #PEPE holds momentum within the within the order block zone the setup remains high probability targeting an initial upside move toward 4500, a key moderate resistance and structural level.
💎If #PEPE fails to hold bullish momentum and a momentum candle closes below 3800, the current bullish probability becomes invalid. In that case, we could see further downside pressure.
That is why Paradisers, we are playing it safe right now. If you want to be consistently profitable, you need to be extremely patient and always wait only for the best, highest probability trading opportunities only on confirmations.
MyCryptoParadise
iFeel the success🌴
Pepeusd

PEPE/USDT Pullback After Breakout — Next Move Loading!PEPE is consolidating after a clear structure shift from the previous downtrend. The descending trendline has already been broken and momentum has flipped, which is a good sign.
Price is now pulling back into a strong demand area. This looks like a healthy retracement, not weakness. As long as this zone holds, the bias stays bullish and PEPE has room to continue higher after consolidation.
If this demand fails, the structure becomes weak again and a deeper pullback is likely. Until then, this is simply a reset before the next move.

Trade The Structure On PEPE, Not The Green Candles (8H)Considering the strong breakout of price above the long-term bearish trendline and the successful reclaim of key structural levels, the overall market structure of PEPE has shifted to bullish. This move was impulsive and backed by strong momentum, which usually signals a change in market sentiment rather than a simple short-term reaction.
At this stage, we are not chasing price. Instead, the focus is on finding buy or long opportunities from the origin of the move and well-defined support zones. These areas are where smart money and market makers typically defend price after a breakout. Market makers often manipulate price by creating pullbacks or short-term sell pressure to shake out late buyers, absorb liquidity, and build long positions at better prices.
For this reason, we have identified two potential entry zones that can be executed using a DCA approach. This allows traders to manage risk more effectively and avoid emotional entries during temporary volatility. A pullback into these zones does not invalidate the bullish structure; on the contrary, it can be part of a healthy retracement engineered to trap impatient traders before continuation.
The targets have been clearly marked on the chart based on structure projections and previous resistance levels. As long as price holds above the key support and respects the reclaimed structure, the bullish scenario remains valid.
However, it is important to stay disciplined. A daily candle close below the invalidation level would signal that market makers have shifted behavior, the structure has failed, and this setup is no longer valid. Until then, patience is key and reacting to manipulation instead of chasing candles will provide the best trading opportunities.
If you have a coin or altcoin you want analyzed, first hit the like button and then comment its name so I can review it for you.
This is not a trade setup, as it has no precise stop loss, stop, or target. I do not publish my trade setups here.

ABOUT PEPE, BEARISH MOVEMENTS WITHOUT GOVERMENTS ^) Hello dear traders! It's Nika...
Today I want to share with you this trading idea, about purpose.
As this technical analysis shows, our indicator has these yellow-marked circles.
This movement of price may happen so easily... So soon.
There are so many support levels that can be checked.
So, my personal opinion is market is bearish, and we can see downfall of a price decline.
Wishing you a profitable day.
Good Luck!

Crypto: Risk on! Memes gonna lead, PEPE on the way!Crypto appears to have formed a local bottom, with reversal structures developing across the majority of major assets.
Bitcoin is currently constrained in terms of upside expansion, which increases the probability of capital rotation into altcoins. In this environment, select altcoins are likely to significantly outperform BTC on a relative basis.
Liquidity is stacked higher, and if momentum accelerates, the market may expand aggressively without offering deep pullbacks. From a positioning standpoint, this creates a clear choice: enter at current levels with defined risk, or remain patient and wait for a shallow retracement that may never materialize.
Meme coins are likely to lead the initial phase of the move. While they carry the highest risk profile in the market, they also offer the strongest short-term returns. These should be approached strictly as momentum trades — enter during expansion and exit into strength, as seen in previous cycles (PONKE being a recent example).
Follow for more trading ideas

PEPE. Frogy bout to leap to SKY again after 12 months. Seed!PEPE, has taken an impressive extraordinary leap during its runup season spanning 12 months, from December 2023 to December 2024 -- reaching stratospheric heights, surging 25x from its base price. Talk about the peak of meme season. As with any parabolic event, comes a heavy drop -- and so it happened, 12 months of painful price trims, 10x from its peak.
And after 12 months of straight selling, bears was met with a strong saturation point. This time buyers coming back in the scene again.
The frog coin seems to have a penchant for the month of December as evident of its structural cycles since December 2023. December 2025 was another key month where the big baseline shift also transpired -- this is where bargain hunters began to converge again and positioned quite nicely from the bottom in anticipation of the BIG SHIFT (bull season).
As new year comes, and 2026 slowly unfolds -- froggie gets excited again, new confidence sparks. This time, hinting of a shift in cycle -- back to bullish, ending its 12 month painful correction.
Based on our current long term metrics, PEPE found its strong foothold support and is now breaking its 12 month descending resistance line that started on January 2025. This rare event doesnt come often, it only comes after 12 months cycle so opening 2026 with this bang is very special.
Expect a solidified price baseline from here as it ascends its way to series of high HIGHS again this 2026 -- and yes targeting another ATH on this new cycle.
You know what to do. It's a no brainer seeding season.
Ride the froggie -- prepare to leap HIGH.
Spotted at 0.00000600
Mid Target: ATH 0.00002836
Long Term Target: NEW ATH
TAYOR.
Trade mindfully.

PePe: Falling Wedge Breakout, Trendline BrokenHi,
PEPE formed a clear falling wedge, which is typically a bullish pattern.
Price has now broken the descending trendline with strong momentum, confirming the breakout.
Previous resistance zone is now acting as support
As long as price holds above this area, upside continuation is likely
A short pullback is possible before the next leg up

PEPE price analysis🐸 “Altseason is here!” — at least that’s what the CRYPTOCAP:PEPE market maker decided, printing +46% on a single 3D candle.
📊 With a market cap around $2.4B and daily trading volume close to $1.2B, liquidity is clearly not an issue anymore.
📈 From a technical perspective, OKX:PEPEUSDT still has room for a step-by-step (“saw-like”) continuation higher.
The key zone to watch is $0.0000090, where:
a descending trendline
and a strong historical mirror level intersect.
⚠️ This area could easily become a decision point
🤔 What do you think — is this just a hype-driven spike, or the beginning of a new impulsive leg for CRYPTOCAP:PEPE ?
______________
◆ Follow us ❤️ for daily crypto insights & updates!
🚀 Don’t miss out on important market moves
🧠 DYOR | This is not financial advice, just thinking out loud

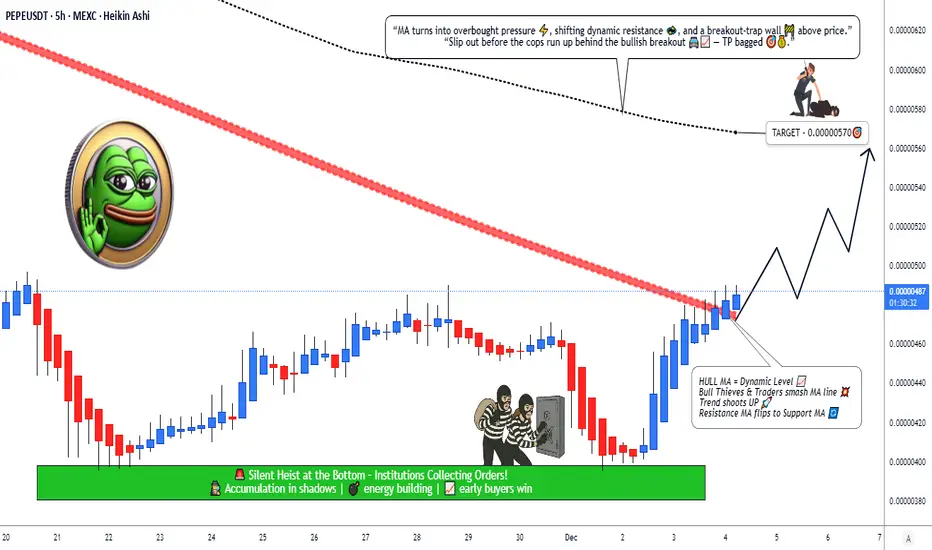
PEPE/USDT Trend Shift? Hull MA Break Signals Possible Upside🔥 PEPE/USDT – Hull Breakout Bullish Blueprint | Swing Trade Masterplan 🐸🚀
Asset: PEPE/USDT — “PEPE vs Tether”
Crypto Market Opportunity Blueprint (Swing Trade)
📈 PLAN — Bullish Plan confirmed with Hull Moving Average Breakout 💚⚡
Entry: YOU CAN ENTRY ANY PRICE LEVEL
Stop Loss: This is thief SL @ 0.00000440
Dear Ladies & Gentleman (Thief OG's) Adjust your SL based on your startergy & own risk.
PLACE SL AFTER THE BREAKOUT CONFIRMATION ONLY.
Note: Dear Ladies & Gentleman (Thief OG's) iam not recommended to set only my SL. its your own choice you can make money then take money at your own risk.
🎯 TARGET — Following SMA Resistance + Overbought Zone + Trap Alert ⚠️🔰
Simple Moving Average act as a strong resistance + overbought + trap is there
→ OUR target @ 0.00000570
Note: Dear Ladies & Gentleman (Thief OG's) iam not recommended to set only my TP. its your own choice you can make money then take money at your own risk.
📡 Related Pairs to Watch (Correlation + Key Points) 🔍📊
1️⃣ BINANCE:SHIBUSDT 🐕🔥
High correlation with meme-coin liquidity flows.
When SHIB pumps aggressively, PEPE usually follows due to risk-on behavior in the meme sector.
Watch for SHIB breakout above local resistance → signals strong liquidity returning to meme coins.
2️⃣ BINANCE:DOGEUSDT 🐶⚡
DOGE is the macro driver of meme-coin sentiment.
If DOGE shows HMA / SMA breakout, PEPE often mirrors with delayed volatility.
Large spikes in DOGE funding rates = PEPE momentum probability increases.
3️⃣ BINANCE:FLOKIUSDT 🐺💥
FLOKI often leads mid-cap meme rotation cycles.
When FLOKI rallies, PEPE tends to follow after short consolidation → swing traders use this correlation.
4️⃣ CRYPTO:WIFUSD (Solana Meme Leader) 🐕🦺🚀
A strong SOL ecosystem rally pulls meme funds from multiple exchanges.
PEPE benefits from cross-chain meme rotation once WIF volatility cools off.
5️⃣ BINANCE:BTCUSDT & BINANCE:ETHUSDT (Macro Drivers) 🧠📉📈
If BTC ranges & ETH strengthens → altcoins, esp. memes, get liquidity boost.
PEPE breakout success rate increases when:
BTC volatility is low
ETH shows positive funding rates
🧩 Summary for Traders (High Engagement Style)
PEPE preparing bullish continuation with Hull MA breakout 🔥
SMA resistance near target = take profits wisely
SL only after confirmation—Thief OG style 🕶️💼
Watch correlated meme-pairs for early signals
Liquidity rotation across SHIB → FLOKI → PEPE remains strong
PEPEUSDTWe are currently in a corrective phase after the latest bull trend. I believe the price is in the final steps of this downward correction, and if the market breaks above the 0.00000600 level, it could trigger a strong upward move in the next phase.
#pepe #pepeusdt CRYPTOCAP:PEPE KRAKEN:PEPEUSD BINANCE:PEPEUSDT

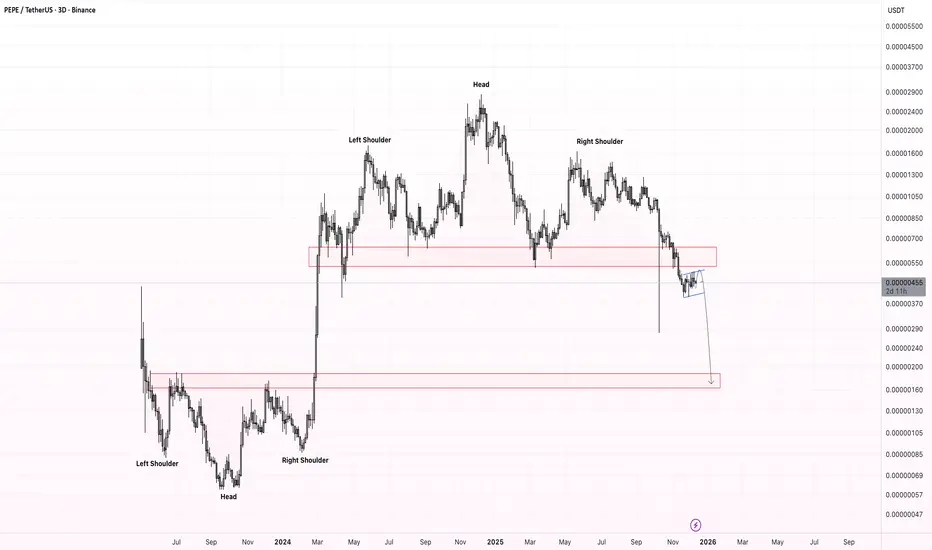
PEPE: Bearish Structure After Major Reversal PatternInitially, PEPE showed a powerful impulsive rally formed through an inverse Head and Shoulders reversal pattern. However, at the top a clear Head and Shoulders pattern has appeared, signaling a potential macro reversal.
Locally, the price is forming a bearish flag , which supports the continuation of the downtrend. Based on the current market structure, I do not recommend buying PEPE at these levels.
My expected downside target:
➡️ 0.000002 – 0.0000016 USDT zone
PEPE Roadmap (3D)If we want to see what PEPE is doing on higher timeframes, we need to analyze it on larger timeframes.
It appears that Wave A of the new cycle will end within the green zone, and the price will enter a retracement for Wave B.
Wave B has two targets, which we have marked on the chart.
Let’s see what happens this movement will take time, as it is on the 3D timeframe.
For risk management, please don't forget stop loss and capital management
When we reach the first target, save some profit and then change the stop to entry
Comment if you have any questions
Thank You

PEPE Buy/Long Signal (2H)PEPE has reached a strong support zone at the bottom of the hourly timeframe.
After the first sweep, it moved downward again, collected liquidity, and then swept the key level.
We have marked two entry points on the chart, which are our intended entries.
We expect the upper liquidity pool to be taken out, or at least for the first target to be hit after the entries are triggered.
The targets are marked on the chart.
If the stop-loss is touched, this setup will be invalidated.
Do not enter the position without capital management and stop setting
Comment if you have any questions
thank you

PEPE/USDT : BUY LIMITHello friends
Well, you can see that after the price fell, it was able to rise by buyers. Now we have an important area where this resistance needs to be broken for the trend to change and the price to rise.
This analysis is purely technically reviewed and is not a buy or sell recommendation, so avoid emotional behavior.
*Trade safely with us*

PEPE/USDT : LIVE TRDEHello friends
Given the growth we had, the price has now formed lower floors and ceilings, which we have identified as sellers most likely pushing the price down.
Observe risk and capital management and avoid emotional behavior.
*Trade safely with us*

$PEPE: MAJOR HEAD and SHOULDERS BREAKDOWN WARNING.🐸🐸🐸
⚠️⚠️⚠️
Pattern formed, Big Move Ahead?
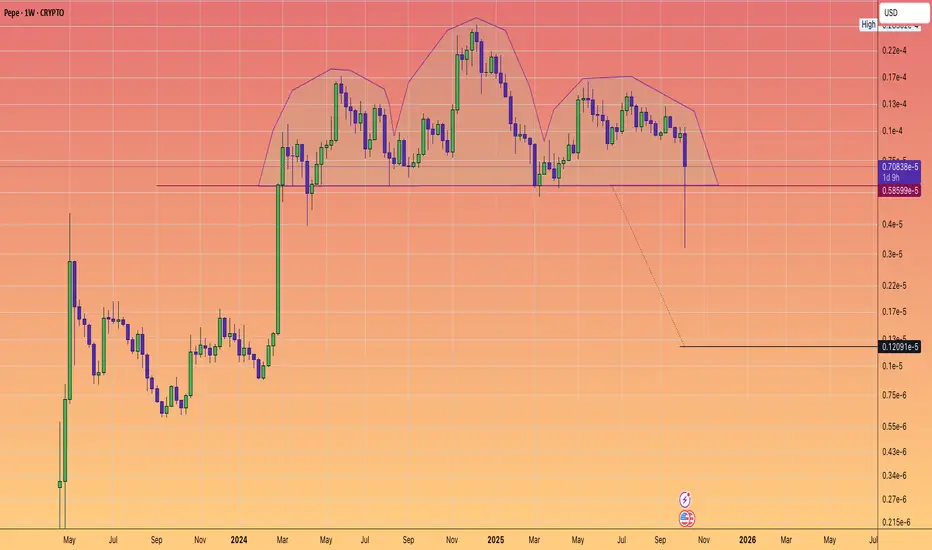
The weekly chart of #Pepe has confirmed a classic head and shoudlers pattern - a powerful bearish setup.
After over 1.5 years of building this structure, price decisively pierced the neckline with a sharp drop.
Suggesting that a weekly close below the neckline could trigger an accelerative towards the pattern target.
Key Levels
Neckline: $0.0000058599
Target: $0.0000012091
Why does it matter?
Head and shoulders are the most trusted reversal technical patterns. Coupled with declining and weakening sentiment. This pattern warns of more downside--- unless buyers can mount a quick rescue.
What's your strategy?
Are you shorting the breakdown, waiting for the target, or looking for a fake-out reversal?
Drop your thoughts/Analysis or questions in the comments!
PEPE BUY!Hello friends
Due to the good growth we had, the price has corrected and formed a flag pattern and this pattern has been broken by buyers and now with risk capital management and in a stepwise manner, you can buy and move with it to the specified targets.
*Trade safely with us*

$Pepe on the verge of the ascension phase.Pepe found support at the lower band of the ascending channel.
Momentum is slowly reviving…
This lull could be the first breath of a new run.
Are you ready?

PEPEUSDT - The real market indicator?Did you know that PEPE’s chart gave a very strong early signal of the massive crash that happened on October 10th?
It had formed a huge Head and Shoulders pattern, and the target of that pattern was exactly the lowest point reached on October 10th.
Not only that — there was also a massive Death Cross on the 3-day chart, where the 100 EMA crossed below the 25 EMA — a textbook bearish confirmation.
The result?
The pattern played out perfectly, leading straight to the crash on October 10th.
Now, if we use PEPE as a market indicator, things don’t look good — its main trendline (starting from October 23rd two years ago ) has broken, retested, and is heading lower, signaling more downside pressure.
So what do you think?
— have we officially entered a bear market? , or is PEPE just moving independently from the rest of the market?
Drop your thoughts in the comments 👇
Best Regards:
Ceciliones🎯

PEPEUSDT: Bearish Outlook After Internal Trendline BreakHello guys.
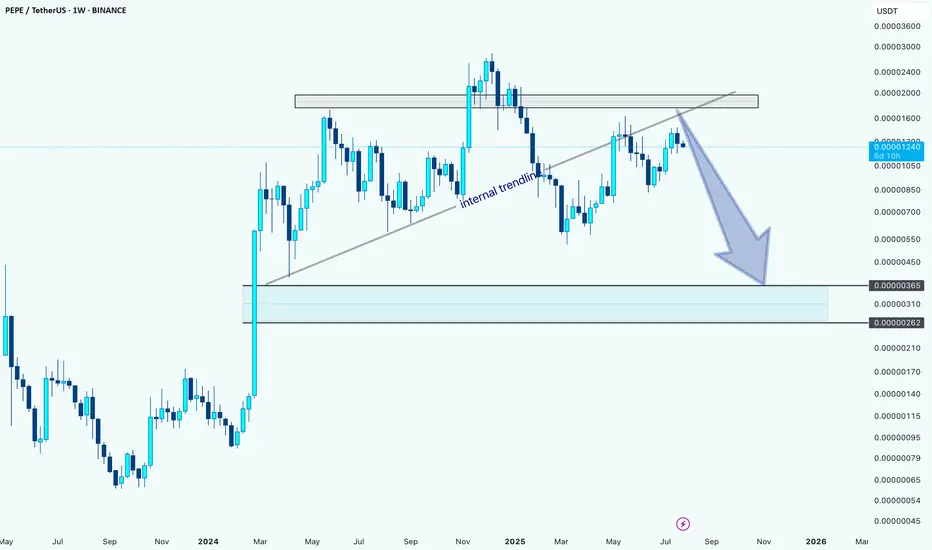
PEPE has tested the internal trendline multiple times and finally broke below it, signaling potential weakness. Price also failed to reclaim the key supply zone above.
Internal trendline broken
Rejection from a key supply zone
Potential move toward the demand zone around 0.00000262–0.00000365
Unless bulls reclaim the broken trendline and break above the recent highs, the bias remains bearish with a possible continuation to the downside.
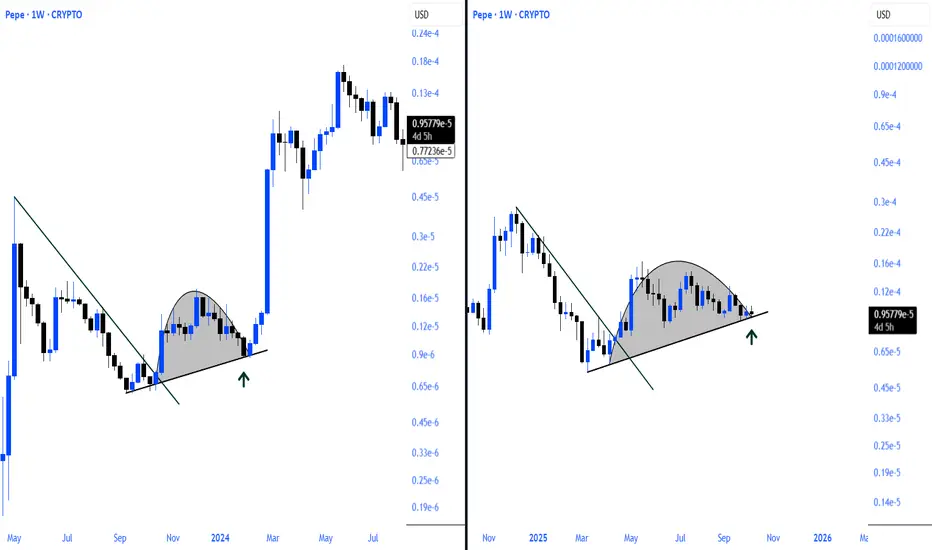
Is the same cycle starting again for $PEPE ?Pepe is forming a new base structure that closely resembles the one seen before its previous major rally.
Once the formation is complete, the door to a parabolic phase will open once again, as it did in the past.
The silence is deep but this chart looks like it did before.
Pepecoin🐸
BUY AND HOLDHello friends
Given the potential and good support that this currency has, with the growth of Ethereum, it can experience another upward rally. Now that the price has corrected, you can buy in steps with capital and risk management and move with it to the specified goals.
Note that the holding period is at least 3 months, so be patient and observe capital management.
*Trade safely with us*

PEPE; FREE SIGNAL!!!Hello friends
Given the buyers' support for the price and the downtrend breakdown, if the two specified supports are maintained, the price can move to the specified targets.
*Trade safely with us*
