Pepe: Where can I buy a frog?The asset showed strong momentum growth, so it is safe to buy in the areas indicated on the chart.
The most important thing is to look at the LTF before entering. If there is a long model, enter. Otherwise, skip it and wait for a lower price.
OKX:PEPEUSDT.P
PEPEUSDT

Crypto: Risk on! Memes gonna lead, PEPE on the way!Crypto appears to have formed a local bottom, with reversal structures developing across the majority of major assets.
Bitcoin is currently constrained in terms of upside expansion, which increases the probability of capital rotation into altcoins. In this environment, select altcoins are likely to significantly outperform BTC on a relative basis.
Liquidity is stacked higher, and if momentum accelerates, the market may expand aggressively without offering deep pullbacks. From a positioning standpoint, this creates a clear choice: enter at current levels with defined risk, or remain patient and wait for a shallow retracement that may never materialize.
Meme coins are likely to lead the initial phase of the move. While they carry the highest risk profile in the market, they also offer the strongest short-term returns. These should be approached strictly as momentum trades — enter during expansion and exit into strength, as seen in previous cycles (PONKE being a recent example).
Follow for more trading ideas

What a perfect update!!😱 What a perfect update!! 😱
🔥 CRYPTOCAP:PEPE +20% up
✅0,000660 - 0,000670
✅0,000700 - 0,000730
🎯0,000795
Don't forget to like this one 👍

PEPE. Frogy bout to leap to SKY again after 12 months. Seed!PEPE, has taken an impressive extraordinary leap during its runup season spanning 12 months, from December 2023 to December 2024 -- reaching stratospheric heights, surging 25x from its base price. Talk about the peak of meme season. As with any parabolic event, comes a heavy drop -- and so it happened, 12 months of painful price trims, 10x from its peak.
And after 12 months of straight selling, bears was met with a strong saturation point. This time buyers coming back in the scene again.
The frog coin seems to have a penchant for the month of December as evident of its structural cycles since December 2023. December 2025 was another key month where the big baseline shift also transpired -- this is where bargain hunters began to converge again and positioned quite nicely from the bottom in anticipation of the BIG SHIFT (bull season).
As new year comes, and 2026 slowly unfolds -- froggie gets excited again, new confidence sparks. This time, hinting of a shift in cycle -- back to bullish, ending its 12 month painful correction.
Based on our current long term metrics, PEPE found its strong foothold support and is now breaking its 12 month descending resistance line that started on January 2025. This rare event doesnt come often, it only comes after 12 months cycle so opening 2026 with this bang is very special.
Expect a solidified price baseline from here as it ascends its way to series of high HIGHS again this 2026 -- and yes targeting another ATH on this new cycle.
You know what to do. It's a no brainer seeding season.
Ride the froggie -- prepare to leap HIGH.
Spotted at 0.00000600
Mid Target: ATH 0.00002836
Long Term Target: NEW ATH
TAYOR.
Trade mindfully.

PePe: Falling Wedge Breakout, Trendline BrokenHi,
PEPE formed a clear falling wedge, which is typically a bullish pattern.
Price has now broken the descending trendline with strong momentum, confirming the breakout.
Previous resistance zone is now acting as support
As long as price holds above this area, upside continuation is likely
A short pullback is possible before the next leg up

PEPE/USDT – Daily Timeframe AnalysisBias: Bullish Reversal → Momentum Building
PEPE/USDT is showing strong signs of a trend reversal after an extended bearish phase.
Price has formed a clear base around the 0.40e-5 demand zone, followed by a decisive bullish reaction, indicating that sellers are losing control and buyers are stepping in aggressively.
Technical Confluence
Price has reclaimed short-term structure after prolonged distribution.
RSI (14) has surged into the 70+ region, confirming strong bullish momentum.
The recent impulse suggests a change in market character (ChoCH) from bearish to bullish.
Key Levels to Watch
Major Support: 0.40e-5 – 0.42e-5
Immediate Resistance: 0.72e-5 – 0.80e-5
Higher Resistance Target: 0.94e-5
Bullish Scenario
Holding above 0.42e-5 keeps the bullish structure valid.
A confirmed breakout above 0.80e-5 could trigger continuation toward 0.94e-5 and above.
Bearish Invalidation
A breakdown below 0.40e-5 would invalidate the bullish bias and signal potential continuation of the broader downtrend.
Conclusion
PEPE is transitioning from accumulation to expansion.
Momentum currently favors the bulls, but continuation requires holding above key demand levels.
Trade with confirmation. Risk management remains essential.

PEPE price analysis🐸 “Altseason is here!” — at least that’s what the CRYPTOCAP:PEPE market maker decided, printing +46% on a single 3D candle.
📊 With a market cap around $2.4B and daily trading volume close to $1.2B, liquidity is clearly not an issue anymore.
📈 From a technical perspective, OKX:PEPEUSDT still has room for a step-by-step (“saw-like”) continuation higher.
The key zone to watch is $0.0000090, where:
a descending trendline
and a strong historical mirror level intersect.
⚠️ This area could easily become a decision point
🤔 What do you think — is this just a hype-driven spike, or the beginning of a new impulsive leg for CRYPTOCAP:PEPE ?
______________
◆ Follow us ❤️ for daily crypto insights & updates!
🚀 Don’t miss out on important market moves
🧠 DYOR | This is not financial advice, just thinking out loud

Breaking: $PEPE Spike 37% Gearing for 300% SurgeThe price of the notable memecoin on ethereum chain- CRYPTOCAP:PEPE saw its value rise by 37% for the past 24 hours breaking above a bullish symmetrical triangle setting the stage for 300% breakout albeit market drawback.
The memecoin has loss over 72% of its market value for the past 9 months consolidating in a tight symmetrical triangle pattern.
As of the time of writing, CRYPTOCAP:PEPE is up 16% with its RSI at 72, there is more room for CRYPTOCAP:PEPE to capitalise on the bullish symmetrical triangle pattern.
About Pepe
What Is PEPE?
PEPE is a deflationary memecoin launched on Ethereum. The cryptocurrency was created as a tribute to the Pepe the Frog internet meme, created by Matt Furie, which gained popularity in the early 2000s.
The project aims to capitalize on the popularity of meme coins, like Shiba Inu and Dogecoin, and strives to establish itself as one of the top meme-based cryptocurrencies. PEPE appeals to the cryptocurrency community by instituting a no-tax policy and being up-front about its lack of utility, keeping things pure and simple as a memecoin.
Pepe Price Data
The Pepe price today is $0.000006 USD with a 24-hour trading volume of $1,348,293,008 USD. Pepe is up 37.49% in the last 24 hours. The current CoinMarketCap ranking is #36, with a market cap of $2,406,442,835 USD. It has a circulating supply of 420,689,899,653,543 PEPE coins and a max. supply of 420,689,899,653,543 PEPE coins.

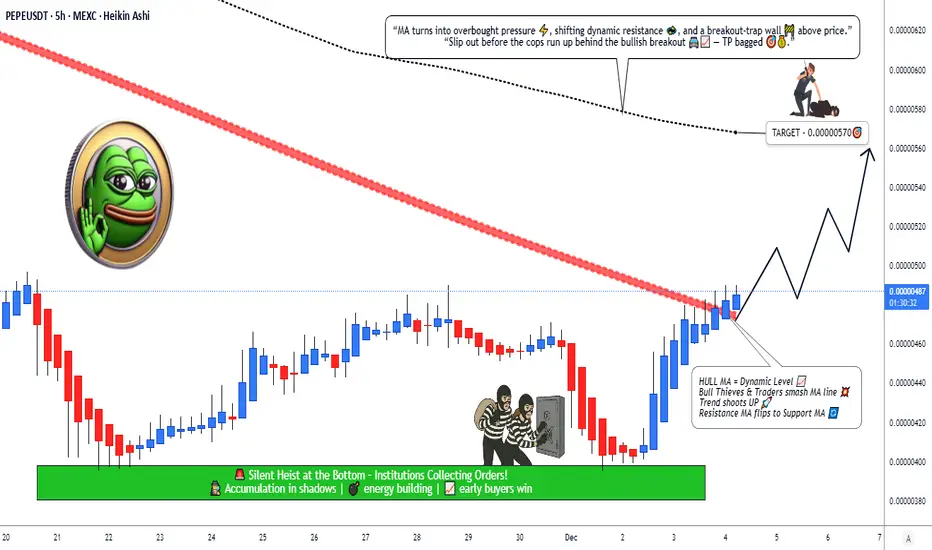
PEPE/USDT Trend Shift? Hull MA Break Signals Possible Upside🔥 PEPE/USDT – Hull Breakout Bullish Blueprint | Swing Trade Masterplan 🐸🚀
Asset: PEPE/USDT — “PEPE vs Tether”
Crypto Market Opportunity Blueprint (Swing Trade)
📈 PLAN — Bullish Plan confirmed with Hull Moving Average Breakout 💚⚡
Entry: YOU CAN ENTRY ANY PRICE LEVEL
Stop Loss: This is thief SL @ 0.00000440
Dear Ladies & Gentleman (Thief OG's) Adjust your SL based on your startergy & own risk.
PLACE SL AFTER THE BREAKOUT CONFIRMATION ONLY.
Note: Dear Ladies & Gentleman (Thief OG's) iam not recommended to set only my SL. its your own choice you can make money then take money at your own risk.
🎯 TARGET — Following SMA Resistance + Overbought Zone + Trap Alert ⚠️🔰
Simple Moving Average act as a strong resistance + overbought + trap is there
→ OUR target @ 0.00000570
Note: Dear Ladies & Gentleman (Thief OG's) iam not recommended to set only my TP. its your own choice you can make money then take money at your own risk.
📡 Related Pairs to Watch (Correlation + Key Points) 🔍📊
1️⃣ BINANCE:SHIBUSDT 🐕🔥
High correlation with meme-coin liquidity flows.
When SHIB pumps aggressively, PEPE usually follows due to risk-on behavior in the meme sector.
Watch for SHIB breakout above local resistance → signals strong liquidity returning to meme coins.
2️⃣ BINANCE:DOGEUSDT 🐶⚡
DOGE is the macro driver of meme-coin sentiment.
If DOGE shows HMA / SMA breakout, PEPE often mirrors with delayed volatility.
Large spikes in DOGE funding rates = PEPE momentum probability increases.
3️⃣ BINANCE:FLOKIUSDT 🐺💥
FLOKI often leads mid-cap meme rotation cycles.
When FLOKI rallies, PEPE tends to follow after short consolidation → swing traders use this correlation.
4️⃣ CRYPTO:WIFUSD (Solana Meme Leader) 🐕🦺🚀
A strong SOL ecosystem rally pulls meme funds from multiple exchanges.
PEPE benefits from cross-chain meme rotation once WIF volatility cools off.
5️⃣ BINANCE:BTCUSDT & BINANCE:ETHUSDT (Macro Drivers) 🧠📉📈
If BTC ranges & ETH strengthens → altcoins, esp. memes, get liquidity boost.
PEPE breakout success rate increases when:
BTC volatility is low
ETH shows positive funding rates
🧩 Summary for Traders (High Engagement Style)
PEPE preparing bullish continuation with Hull MA breakout 🔥
SMA resistance near target = take profits wisely
SL only after confirmation—Thief OG style 🕶️💼
Watch correlated meme-pairs for early signals
Liquidity rotation across SHIB → FLOKI → PEPE remains strong
PEPEUSDTWe are currently in a corrective phase after the latest bull trend. I believe the price is in the final steps of this downward correction, and if the market breaks above the 0.00000600 level, it could trigger a strong upward move in the next phase.
#pepe #pepeusdt CRYPTOCAP:PEPE KRAKEN:PEPEUSD BINANCE:PEPEUSDT

PEPE/USDT - Break the Trendline or Continue Lower?Structurally, PEPE is still in a bearish trend after a strong rejection from its previous high area. Price continues to move below a descending trendline, which acts as a major dynamic resistance. Each approach toward this trendline has resulted in rejection, confirming that selling pressure remains dominant.
At the current level, price is attempting to form a base (consolidation), but no valid trend reversal has been confirmed yet.
---
📐 Pattern Analysis (Detailed Explanation)
🔻 Descending Trendline (Downtrend Structure)
The yellow diagonal line represents consistent lower highs
This structure confirms a clear downtrend
A break above the trendline would indicate a potential trend shift
📊 Bearish Continuation Structure
After a sharp drop, price moves sideways with a bearish bias
This often represents a distribution or continuation phase
Without a breakout, the probability favors further downside
---
📉 Resistance Zones (Supply Areas)
Key resistance levels marked by yellow dashed lines:
0.00000495
0.00000550
0.00000650
0.00000735
0.00001025
These levels previously acted as strong reaction zones and may cause price rejection if retested.
---
🟢 Bullish Scenario (If Breakout Occurs)
Bullish momentum is only valid if:
1. Price breaks and closes above the descending trendline on the daily timeframe
2. The breakout is supported by increasing volume
Bullish Targets (Step by Step):
🎯 0.00000495 (nearest resistance)
🎯 0.00000550
🎯 0.00000650
🎯 0.00000735
🎯 0.00001025 (optimistic target with strong momentum)
📌 As long as price remains below the trendline, any upside move should be considered a relief rally, not a trend reversal.
---
🔴 Bearish Scenario (Primary Bias)
If price:
Fails to break the descending trendline, or
Breaks down below current support
Bearish Targets:
🔻 Retest of 0.00000360
🔻 Previous low around 0.00000278
A breakdown below this level may open room for further downside continuation
📌 The lower-high & lower-low structure remains intact → bearish trend is still active.
---
🧠 Conclusion
Primary trend: Bearish
Price remains below the descending trendline
Bullish bias only becomes valid after a confirmed daily breakout
Until then, the best approach is wait and react, not predict
#PEPEUSDT #PEPE #CryptoAnalysis #CryptoTrading #TradingView #Downtrend #BearishMarket #Altcoin #MemeCoin #SupportResistance #Trendline #PriceAction #DailyChart #Breakout #TechnicalAnalysis

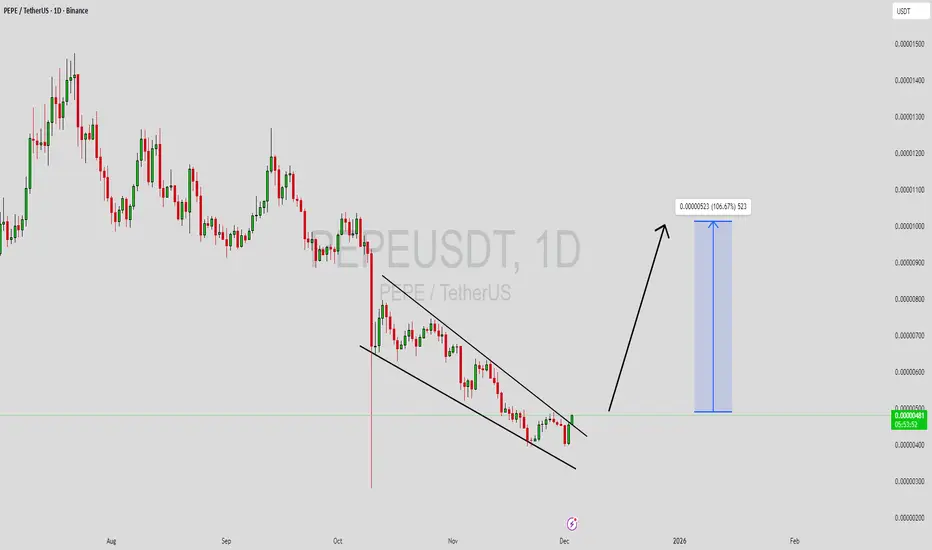
PEPE: Weekly Downtrend; Breakout or Fade?PEPE bounced from the demand zone and is pushing into the weekly downtrend line. Plan is to wait for a clean breakout, then ride momentum higher instead of guessing the reversal early.
Entry (long):
👉 Anywhere inside / just above the grey box, around 0.00000034–0.00000038.
Stop‑loss:
❌ Below the demand zone and last wick low, around 0.00000030.
Take‑profit:
🎯 At, or slightly below, the blue trendline resistance, around 0.00000048–0.00000052.
DISCLAIMER
The plan is a short‑term long from support into that trendline, but this is a counter‑trend move and therefore high risk, it should be treated with extra caution and small size.

PEPEFull Elliott Wave cycle is completed on PEPE
But is it going to start a new one? For me is a question
Reversal and some bounce will happen for sure
Lets look how it will be structured
Probably I will like to see Wave 1 as Leading Diagonal

PEPE: Bearish Structure After Major Reversal PatternInitially, PEPE showed a powerful impulsive rally formed through an inverse Head and Shoulders reversal pattern. However, at the top a clear Head and Shoulders pattern has appeared, signaling a potential macro reversal.
Locally, the price is forming a bearish flag , which supports the continuation of the downtrend. Based on the current market structure, I do not recommend buying PEPE at these levels.
My expected downside target:
➡️ 0.000002 – 0.0000016 USDT zone
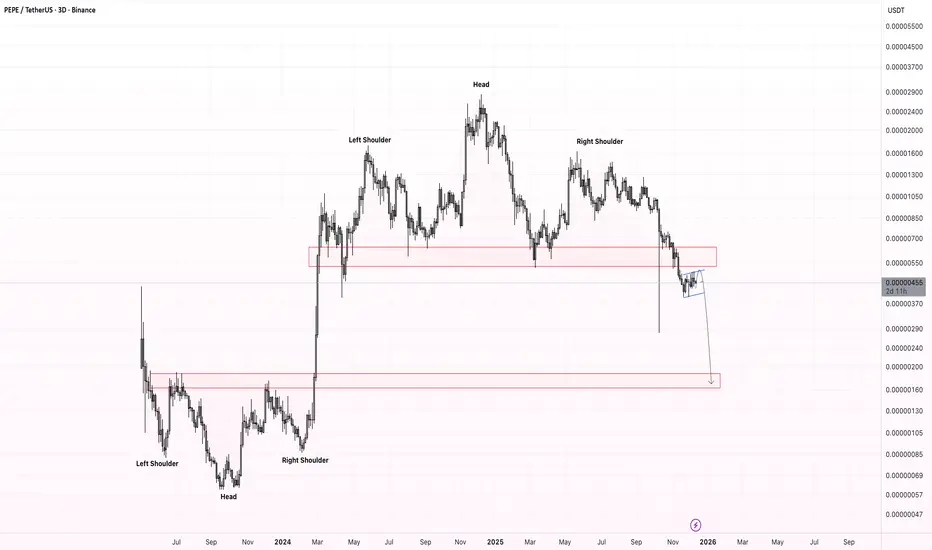
PEPE Roadmap (3D)If we want to see what PEPE is doing on higher timeframes, we need to analyze it on larger timeframes.
It appears that Wave A of the new cycle will end within the green zone, and the price will enter a retracement for Wave B.
Wave B has two targets, which we have marked on the chart.
Let’s see what happens this movement will take time, as it is on the 3D timeframe.
For risk management, please don't forget stop loss and capital management
When we reach the first target, save some profit and then change the stop to entry
Comment if you have any questions
Thank You

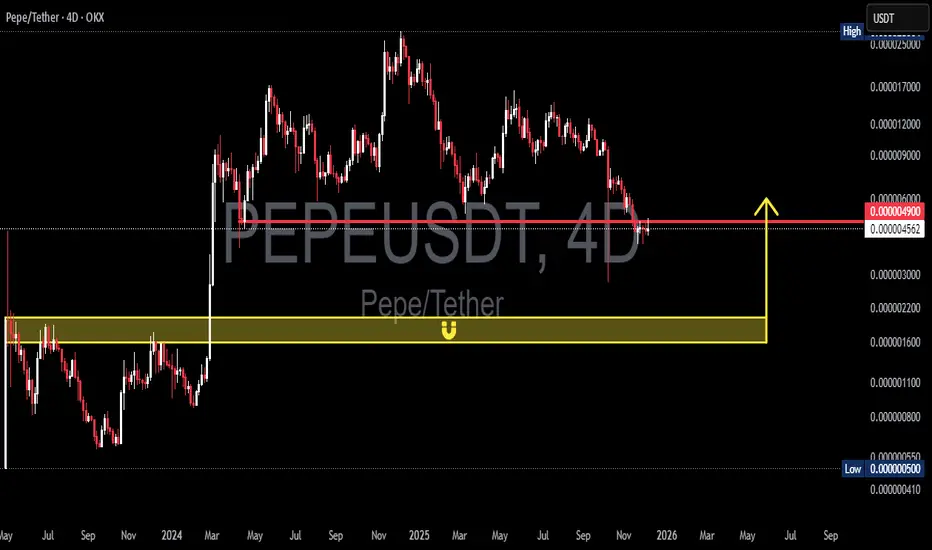
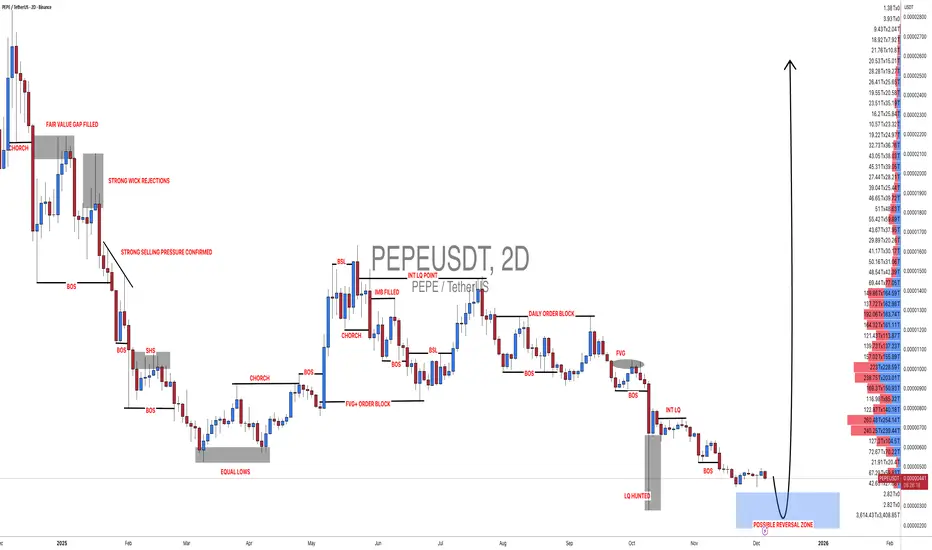
PEPE at a Critical Decision Point: Reversal or Deeper Breakdown?PEPE is approaching one of its most critical decision points since the major rally of 2024–2025. After forming a clean sequence of lower highs and sliding into a broader distribution phase, the market recently printed a deep liquidity sweep below local support — a signature move often associated with smart-money positioning.
Now the price is pulling back toward the 0.0000049 key resistance, a level that has historically acted as a battlefield between buyers and sellers. This level will decide whether PEPE regains momentum or continues its mid-term downtrend.
But the real story is below:
The yellow demand zone at 0.0000020 – 0.0000016 is the strongest structural support on the chart.
This area previously sparked a powerful upside reversal and will once again act as the final defensive wall if the market continues to drop.
---
✨ Bullish Scenario — The Reversal Signal Everyone Is Watching
A bullish reversal is not confirmed by a simple bounce.
It becomes valid only when PEPE can:
1. Close a 4D candle ABOVE 0.0000049
→ Indicates buyers taking structural control.
2. Retest the level successfully without breaking back below
→ Confirms the breakout is real and not a fakeout.
If these two conditions occur, the natural upside targets are:
0.0000060 (TP1) — minor supply
0.0000090 (TP2) — historical magnet
0.0000120 (TP3) — potential trend-shift zone
With proper volume, the structure can transition from bearish → neutral → bullish.
---
🔥 Bearish Scenario — Path Toward the Yellow Box
If the price gets rejected again at 0.0000049, bearish pressure remains dominant.
This opens two likely moves:
1. A controlled decline into the 0.0000020 – 0.0000016 demand zone
→ This zone is where large buyers typically step in.
2. A breakdown below 0.0000016
→ Signals a deeper structural flush
→ Indicates the market is cleaning liquidity before forming a new macro base.
In short:
0.0000020 – 0.0000016 is the battlefield that decides PEPE’s next major trend.
---
🎯 Pattern & Market Structure Insights
Well-defined downtrend with consistent lower highs
Clear liquidity sweep signaling institutional presence
Price currently trading between two extreme decision levels:
Key Resistance: 0.0000049
Major Demand: 0.0000020 – 0.0000016
This is a classic “decision point setup.”
The next move from here can define PEPE’s next multi-week or multi-month trend.
---
#PEPE #PEPEUSDT #CryptoAnalysis #MarketStructure #AltcoinAnalysis #DemandZone #LiquiditySweep #PriceAction #CryptoTA
#PEPEUSDT: Big Move Is Coming, Comment Down Your ViewsI hope you are having a good weekend.
Let us focus on the current state of the cryptocurrency market. We have identified a key pattern in the BINANCE:PEPEUSDT which suggests a potential transition from an accumulation phase to a distribution phase.
We recommend waiting for price confirmation such as a break through the straight trend line and subsequent liquidity. Once this is confirmed, we suggest waiting for a price retracement and retesting the area which would serve as the second confirmation.
This is our analysis and not a guaranteed move. Please conduct your own research before making any changes.
Team Setupsfx_
PEPE Update🚨📊 PEPE Update
PEPE is testing the red resistance zone 🔴.
If breakout happens, first target = green line level 🟩🎯.

PEPEUSDT Forming Falling WedgePEPEUSDT is forming a clear falling wedge pattern, a classic bullish reversal signal that often indicates an upcoming breakout. The price has been consolidating within a narrowing range, suggesting that selling pressure is weakening while buyers are beginning to regain control. With consistent volume confirming accumulation at lower levels, the setup hints at a potential bullish breakout soon. The projected move could lead to an impressive gain of around 90% to 100% once the price breaks above the wedge resistance.
This falling wedge pattern is typically seen at the end of downtrends or corrective phases, and it represents a potential shift in market sentiment from bearish to bullish. Traders closely watching PEPEUSDT are noting the strengthening momentum as it nears a breakout zone. The good trading volume adds confidence to this pattern, showing that market participants are positioning early in anticipation of a reversal.
Investors’ growing interest in PEPEUSDT reflects rising confidence in the project’s long-term fundamentals and current technical strength. If the breakout confirms with sustained volume, this could mark the start of a fresh bullish leg. Traders might find this a valuable setup for medium-term gains, especially as the wedge pattern completes and buying momentum accelerates.
✅ Show your support by hitting the like button and
✅ Leaving a comment below! (What is your opinion about this Coin?)
Your feedback and engagement keep me inspired to share more insightful market analysis with you!
PEPE Buy/Long Signal (2H)PEPE has reached a strong support zone at the bottom of the hourly timeframe.
After the first sweep, it moved downward again, collected liquidity, and then swept the key level.
We have marked two entry points on the chart, which are our intended entries.
We expect the upper liquidity pool to be taken out, or at least for the first target to be hit after the entries are triggered.
The targets are marked on the chart.
If the stop-loss is touched, this setup will be invalidated.
Do not enter the position without capital management and stop setting
Comment if you have any questions
thank you

PEPEUSDT Bullish setup 4HBINANCE:PEPEUSDT is showing early signs of a trend reversal on the 4H timeframe. Price has reclaimed the mid-band of the volatility channel and is holding above the short-term EMA ribbon – a key bullish confluence suggesting buyers are slowly regaining control. Momentum is shifting upward with higher lows building and volatility compression hinting at an upcoming expansion.
I’ve aligned my targets with the Fibonacci extension levels:
🔹 TP1 – 38.2% Fib: ~0.000004948
🔹 TP2 – 61.8% Fib: ~0.000005176
🔹 TP3 – 100% Fib: ~0.000005400–0.000005540 zone
As long as price stays above the lower channel support and maintains its ascending structure, the upside remains favored. A break and close above the mid-range resistance could accelerate the move toward the 100% Fib target at 54.

PEPE/USDT : BUY LIMITHello friends
Well, you can see that after the price fell, it was able to rise by buyers. Now we have an important area where this resistance needs to be broken for the trend to change and the price to rise.
This analysis is purely technically reviewed and is not a buy or sell recommendation, so avoid emotional behavior.
*Trade safely with us*

PEPE/USDT : LIVE TRDEHello friends
Given the growth we had, the price has now formed lower floors and ceilings, which we have identified as sellers most likely pushing the price down.
Observe risk and capital management and avoid emotional behavior.
*Trade safely with us*
