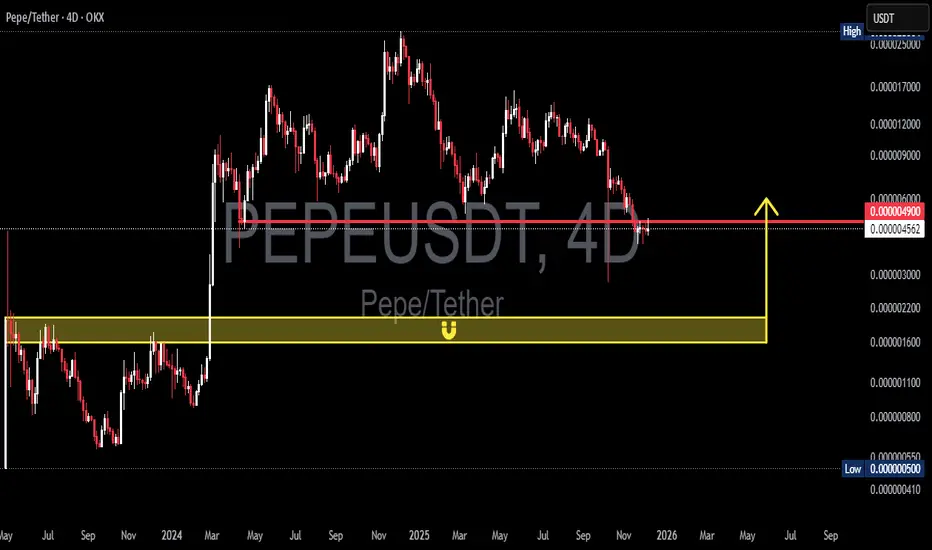
PEPE at a Critical Decision Point: Reversal or Deeper Breakdown?PEPE is approaching one of its most critical decision points since the major rally of 2024–2025. After forming a clean sequence of lower highs and sliding into a broader distribution phase, the market recently printed a deep liquidity sweep below local support — a signature move often associated with smart-money positioning.
Now the price is pulling back toward the 0.0000049 key resistance, a level that has historically acted as a battlefield between buyers and sellers. This level will decide whether PEPE regains momentum or continues its mid-term downtrend.
But the real story is below:
The yellow demand zone at 0.0000020 – 0.0000016 is the strongest structural support on the chart.
This area previously sparked a powerful upside reversal and will once again act as the final defensive wall if the market continues to drop.
---
✨ Bullish Scenario — The Reversal Signal Everyone Is Watching
A bullish reversal is not confirmed by a simple bounce.
It becomes valid only when PEPE can:
1. Close a 4D candle ABOVE 0.0000049
→ Indicates buyers taking structural control.
2. Retest the level successfully without breaking back below
→ Confirms the breakout is real and not a fakeout.
If these two conditions occur, the natural upside targets are:
0.0000060 (TP1) — minor supply
0.0000090 (TP2) — historical magnet
0.0000120 (TP3) — potential trend-shift zone
With proper volume, the structure can transition from bearish → neutral → bullish.
---
🔥 Bearish Scenario — Path Toward the Yellow Box
If the price gets rejected again at 0.0000049, bearish pressure remains dominant.
This opens two likely moves:
1. A controlled decline into the 0.0000020 – 0.0000016 demand zone
→ This zone is where large buyers typically step in.
2. A breakdown below 0.0000016
→ Signals a deeper structural flush
→ Indicates the market is cleaning liquidity before forming a new macro base.
In short:
0.0000020 – 0.0000016 is the battlefield that decides PEPE’s next major trend.
---
🎯 Pattern & Market Structure Insights
Well-defined downtrend with consistent lower highs
Clear liquidity sweep signaling institutional presence
Price currently trading between two extreme decision levels:
Key Resistance: 0.0000049
Major Demand: 0.0000020 – 0.0000016
This is a classic “decision point setup.”
The next move from here can define PEPE’s next multi-week or multi-month trend.
---
#PEPE #PEPEUSDT #CryptoAnalysis #MarketStructure #AltcoinAnalysis #DemandZone #LiquiditySweep #PriceAction #CryptoTA
Pepeusdtsignal
#PEPEUSDT: Big Move Is Coming, Comment Down Your ViewsI hope you are having a good weekend.
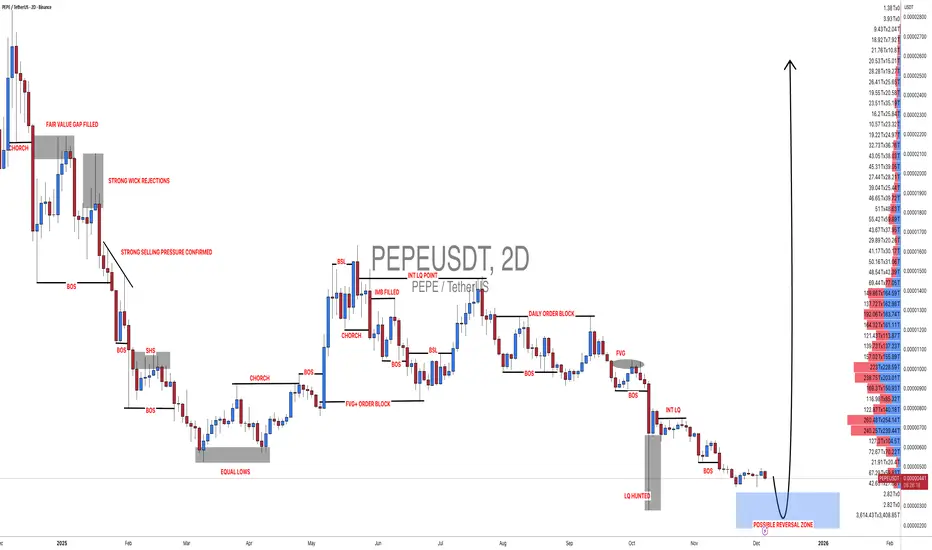
Let us focus on the current state of the cryptocurrency market. We have identified a key pattern in the BINANCE:PEPEUSDT which suggests a potential transition from an accumulation phase to a distribution phase.
We recommend waiting for price confirmation such as a break through the straight trend line and subsequent liquidity. Once this is confirmed, we suggest waiting for a price retracement and retesting the area which would serve as the second confirmation.
This is our analysis and not a guaranteed move. Please conduct your own research before making any changes.
Team Setupsfx_
PEPE — Will This Golden Zone Spark the Next Reversal?Overview
The PEPE/USDT 2D chart is now standing at a critical inflection point — right inside the major support zone (yellow area) that has repeatedly acted as the foundation for rallies since 2024.
After a deep liquidity sweep down to 0.00000266, price quickly recovered and is now holding above the same zone.
In short: liquidity has been cleared, and the market is preparing for its next move.
---
Pattern & Market Structure
Golden Zone = Key Demand Area:
This yellow block has absorbed significant buying interest in the past. As long as it holds, the potential for a rebound remains high.
Liquidity sweep (long lower wick):
A classic sign of a fake breakdown — often a precursor to bullish reversals.
Mid-term structure:
Still forming lower highs, but a potential base-building phase seems to be developing.
In other words, this could be the calm before the storm.
---
Bullish Scenario — The Start of a Comeback
If the 2D candle closes decisively above 0.00000913, momentum could flip bullish.
That breakout would signal the beginning of a new re-accumulation phase, opening the path toward the following upside targets:
🎯 Target 1: 0.00001208 → initial resistance and first take-profit zone.
🎯 Target 2: 0.00001418 – 0.00001556 → mid-range resistance area.
🎯 Target 3: 0.00002105 – 0.00002662 → high momentum zone if buyers fully regain control.
📈 Extra confirmation: rising volume + strong-bodied breakout candle = early sign of trend reversal.
---
Bearish Scenario — If the Zone Fails to Hold
However, if PEPE closes below the yellow zone (around 0.0000071 – 0.0000060), the major support will officially break down.
That would open the door for a deeper correction toward:
⚠️ 0.00000266 (previous low) — the last strong demand area.
Below this level, a capitulation wave could emerge.
A bearish setup strengthens if the price retests the broken support and fails to reclaim it.
---
Trading Strategy & Risk Management
Aggressive traders: scale in within the yellow zone with tight stops below the extreme wick.
Conservative traders: wait for a confirmed 2D close above 0.00000913 before entering.
Take profits progressively at each resistance level and move stop-loss to breakeven after TP1.
🎯 Risk-to-reward: minimum 1:2 recommended.
⚙️ Key rule: never fight strong candles with volume confirmation.
---
Conclusion
PEPE is currently at a make-or-break level.
If the golden zone holds, a major reversal could begin from here.
If it breaks, expect a retest of the previous lows near 0.00000266.
Watch for 2D candle closes and volume confirmation — big market shifts often start quietly, just like this.
---
#PEPE #PEPEUSDT #CryptoAnalysis #MarketReversal #SupportZone #CryptoTrading #AltcoinSeason #SwingTrade #TechnicalSetup #SmartMoney

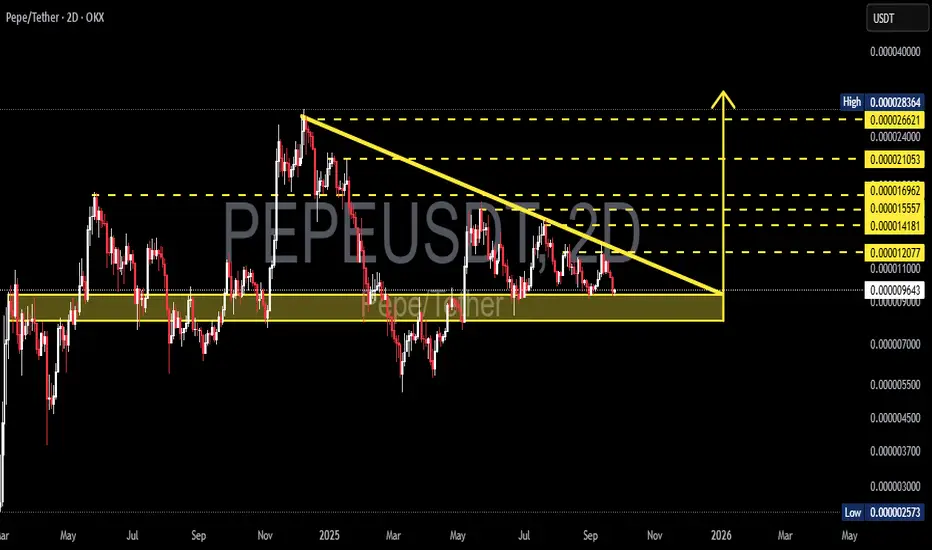
PEPE/USDT — Descending Triangle: Breakout or Breakdown?🟡 Chart Structure
PEPE is currently in a critical phase. The price has been forming a descending triangle (lower highs + horizontal support) for several months.
Current price: 0.000009638
Major Support Zone: 0.000007000 – 0.000011100 (yellow box)
Key Downtrend Resistance: descending yellow trendline from 2025 highs
Upside Levels: 0.000012077 → 0.000014181 → 0.000015557 → 0.000016962 → 0.000021053 → 0.000024000 → 0.000026621
Extreme Low: 0.000002573
---
🟢 Bullish Scenario — The Big Breakout
If PEPE breaks above the downtrend line and closes above 0.000012077 with strong volume, then:
1. The descending triangle breakout will be confirmed.
2. Measured Move Target:
Pattern height = (High 0.000028364 − Support 0.000009638) = 0.000018726
Added to breakout level (0.000012077 + 0.000018726) = 0.000030803
Potential upside: +220% from current levels.
3. Likely progression step by step:
Short-term resistance: 0.000014 – 0.000017
Next milestones: 0.000021 – 0.000024 → 0.000026+ toward the final target.
4. If confirmed, this could be one of the strongest rallies of the year for PEPE.
---
🔴 Bearish Scenario — Breakdown Risk
Statistically, descending triangles tend to lean bearish. If the yellow support zone (0.000007000 – 0.000009000) breaks with volume, then:
1. The structure fails and selling pressure accelerates.
2. Downside targets:
0.000005000 → 0.000003000 → extreme low at 0.000002573.
3. From current price to 0.000002573 = -73% downside risk.
4. Failure to hold support could trigger a sharp continuation of the bearish trend.
---
📐 Technical Pattern — Descending Triangle
Meaning: sellers keep pushing lower highs, while buyers defend one horizontal area.
Bias: bearish continuation by default.
But… if bulls break the trendline, it flips into a powerful bullish reversal signal → often followed by rapid rallies.
---
🧠 Key Notes for Traders
Don’t enter trades just because price touches support or resistance → always wait for a 2D candle close + volume confirmation.
Breakout: avoid FOMO, wait for a retest of the breakout area for a safer entry.
Breakdown: avoid holding longs → prepare for deeper support tests.
Risk management is crucial: use stop-loss and proper position sizing.
---
✨ Conclusion
PEPE is at a major crossroads:
Breakout → upside potential to 0.000030803 (+220%).
Breakdown → downside risk to the historical low around 0.000002573 (−73%).
This is not just sideways consolidation — it’s a decision zone that could define PEPE’s next big move for the months ahead. Traders should be prepared for both scenarios with strict discipline.
---
#PEPE #PEPEUSDT #Crypto #Altcoins #TechnicalAnalysis #Breakout #SupportResistance #DescendingTriangle #CryptoTrading
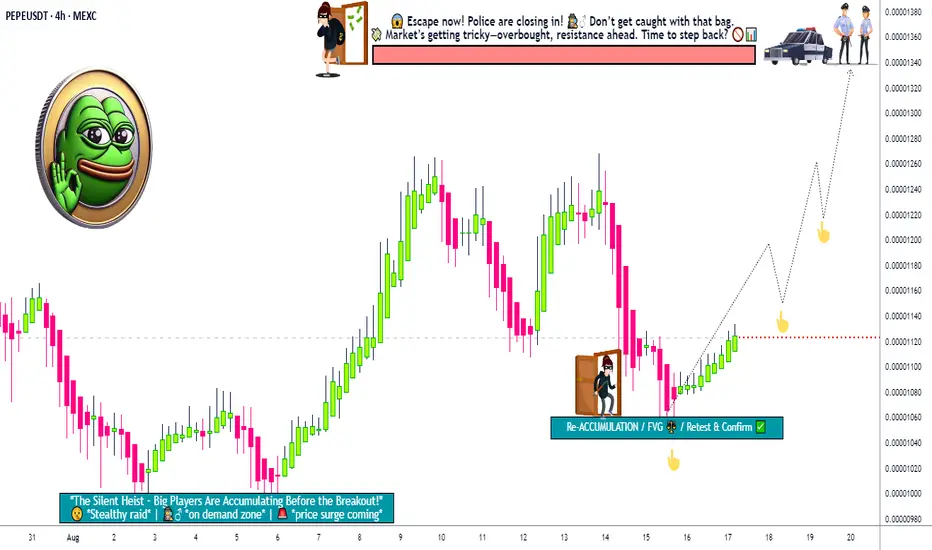
PEPE Bullish Attack Plan – Layer Entry, Escape Before Trap!💚🐸 PEPE/USDT Crypto Market Heist Plan 🕵️♂️💰
🌍 Hello Thief OG’s, Market Robbers & Money Grabbers!
Today we prepare a Bullish Heist on the PEPE/USDT Crypto Market – vault doors are open, the police are distracted, and the layers are waiting! 🚨💸
🏦 Entry Plan (Thief Layer Strategy) 📈
We don’t enter once – we layer like shadows breaking into the vault!
🔹 Layer 1: 0.00001120 (First Dip Grab!)
🔹 Layer 2: 0.00001110 (Double Down!)
🔹 Layer 3: 0.00001100 (Triple the Steal!)
🔹 Layer 4: 0.00001080 (Final Heist Before Escape!)
Add more layers if you’ve got extra bullets in your magazine 🎯🔫
Any price entry allowed if you want to jump in directly – but layering = true thief style! 🕶️
🛑 Stop Loss (Thief Escape Hatch)
📍 SL = 0.00001140 (Default Thief SL)
Adjust based on your personal risk, lot size & money bag capacity 💼💵
Remember: a thief escapes, never gets caught! 🏃💨
🎯 Target (Police Barricade Zone)
🚧 Police waiting at 0.00001400 – DO NOT get greedy!
🎯 Official Thief Exit: 0.00001340 (Escape before they lock the doors)
Grab the loot, disappear into the shadows… 🔐💰
📢 Quick Notes for Robbery Crew
This is a bullish robbery only – no shorting the thief’s plan.
Use multiple limit orders = higher chance of looting success.
Scalpers = small bags, Swing traders = big vaults. Choose your role wisely! ⚔️
💥 Support our Robbery Gang 💥
Smash that BOOST BUTTON so our thief crew grows stronger and wealthier together! 🤑💸🚀
Stay alert thieves, another heist drops soon! 🕵️♂️🐸💎
📌 This is a general market heist plan, not personal financial advice. Adjust your robbery tactics based on your own risk & style.
Critical PEPE/USDT – Bullish Reversal or Bearish Continuation?🔎 Overview
PEPE/USDT is currently trading around 0.000010155, sitting right at a key demand zone (0.00000950 – 0.00001100) that previously acted as a major resistance and is now being retested as support.
This zone is a decision point that will likely define whether the market builds a bullish base for the next leg up or breaks down into deeper lows.
---
🟢 Bullish Scenario
Confirmation: Daily close above 0.000012331 with strong volume.
Upside targets:
1. 0.000014178 (+39%)
2. 0.000015456 (+52%)
3. 0.000016836 (+65%)
Extended targets: 0.000021533 – 0.000026414, with a potential retest of 0.000028364 (+179%).
Supporting structure:
Current zone may act as an accumulation base.
Strong wick rejections with high volume here would signal smart money accumulation.
---
🔴 Bearish Scenario
Confirmation: Daily close below 0.00000950.
Downside targets:
First: 0.00000800 – 0.00000700.
Final target: 0.000005250 (−48% from current level).
Supporting structure:
Failure to form a higher-low will turn this into a descending structure.
Bearish confirmation comes if price retests this zone as resistance after breakdown.
---
📌 Price Action & Pattern
Range-bound: Price has been consolidating between 0.00000950 – 0.00001680, signaling accumulation or distribution before the next major move.
S/R Flip: The yellow zone is a historical level (former resistance, now acting as support). This is the most crucial zone on the chart.
Possible Wyckoff Accumulation: If the zone holds, this could form a spring setup around 0.00000950.
---
🧭 Trading Plan & Risk Management
Conservative Long: Enter after daily close above 0.00001233. SL below 0.00000950. Take profits at resistance levels.
Aggressive Long: Scale in within the current demand zone (0.0000095 – 0.0000101). SL under 0.0000090. Higher risk, higher reward.
Short Setup: Enter on confirmed daily close below 0.00000950. TP at 0.0000070 – 0.00000525. SL above 0.00001100.
Risk Rule: Keep exposure limited (1–2% of capital per trade). Always prepare for fakeouts at decision zones.
---
✨ Conclusion
The 0.00000950 – 0.00001100 zone is the last stronghold for bulls.
If it holds → potential rally up to +170%.
If it breaks → market likely heads back to 0.00000525.
Key: Wait for confirmation, respect stop-loss, and scale out profits at major resistance levels.
---
PEPE/USDT Daily is testing a critical demand zone (0.00000950 – 0.00001100).
➡️ Bullish if it holds, targets up to 0.000014 – 0.0000215 and even 0.0000283.
➡️ Bearish if broken, downside risk toward 0.0000070 – 0.00000525.
📌 This is a decision zone – patience and confirmation are key.
#PEPEUSDT #PEPE #Crypto #Altcoins #PriceAction #SupportResistance #Breakout #Bullish #Bearish #RiskManagement #SwingTrade #CryptoAnalysis

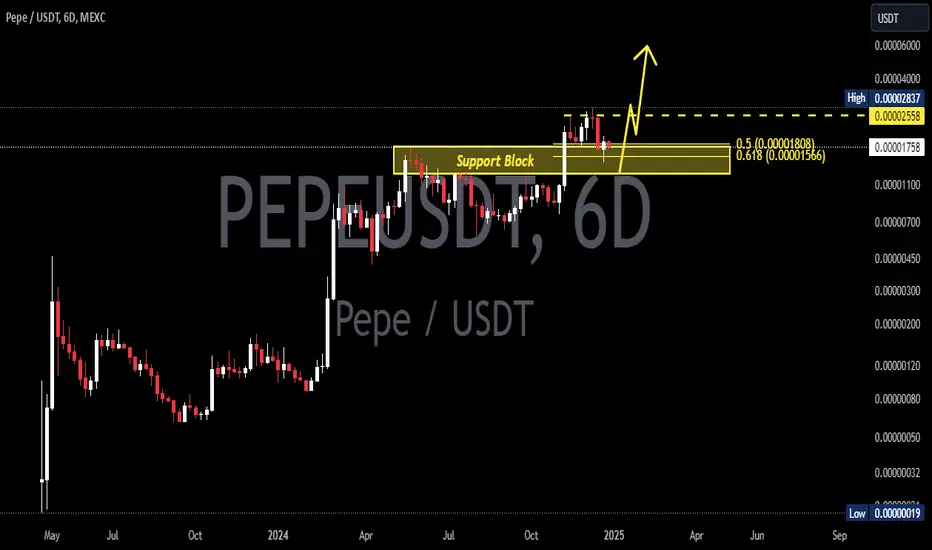
PEPEUSDT – Downtrend Breakout & Golden Zone Retest in Play!📊 Chart Analysis:
On this daily timeframe chart of PEPEUSDT, price has successfully broken above the descending trendline that had capped the price since late 2024. This breakout is a strong early signal that bearish momentum is weakening and a potential trend reversal may be underway.
After the breakout, the price is now performing a retest at a key confluence support zone, including:
Fibonacci Retracement levels 0.5 (0.000011580) and 0.618 (0.000010835) — the Golden Zone
Previous horizontal demand zone (highlighted in yellow)
Retest of the broken descending trendline
This retest area will be crucial for determining the next directional move.
---
🐂 Bullish Scenario:
If price holds above the Fibonacci Golden Zone and forms a bullish confirmation candle, we could see a continuation of the uptrend toward:
0.000014191
0.000015000
0.000016836
0.000021533 (medium-term target)
Possibly retesting the High at 0.000028364
This would confirm the start of a major trend reversal and renewed bullish momentum.
---
🐻 Bearish Scenario:
If price fails to hold above the 0.000010835 level and breaks down below the Golden Zone:
Expect a drop toward psychological support around 0.000010000
And potentially further down to the strong support near 0.000007000
Such a move would invalidate the breakout and put PEPE back into a consolidation or extended downtrend phase.
---
🧠 Chart Pattern Notes:
Descending Trendline Breakout
Golden Zone Retest (Fibonacci 0.5 & 0.618)
Potential formation of an Inverted Head & Shoulders pattern (in early stages)
---
🎯 Conclusion:
PEPEUSDT is at a critical turning point after breaking out of a long-term downtrend. If the support at the Golden Zone holds, there is strong potential for a sustained bullish rally. However, traders should remain cautious and apply proper risk management in case of a breakdown below key levels.
#PEPEUSDT #CryptoBreakout #GoldenZoneRetest #TechnicalAnalysis #FibonacciLevels #PEPECoin #AltcoinAnalysis #TrendReversal #BullishSetup #BearishRisk

PEPE/USD Market Heist: Thief Entry Plan for Big Gains🔥🚨 Thieves of Wall Street: PEPE/USD Crypto Robbery Blueprint 🚨🔥
The Ultimate “Thief Style” Trade Setup That Even Wall Street Would Envy
— A High-Risk, High-Reward Playbook for Market Outlaws —
🌍 Hello Global Money Grabbers!
Hola | Ola | Bonjour | Hallo | Marhaba | Namaste 💰🌐
Welcome to the Thief Trading Zone — where smart rebels don’t chase price, they trap it, rob it, and run off with the profits. 🏴☠️
💸 Mission: PEPE/USD Market Infiltration
🎯 Objective:
Infiltrate the PEPE/USD crypto zone where the big bears sleep — and strike long in the danger zone where most traders panic and exit. That’s where we thrive.
🔍 Trade Setup: The Heist Blueprint
Market: PEPE/USD
Play: Long Entry (Thief-Style Reversal Tactic)
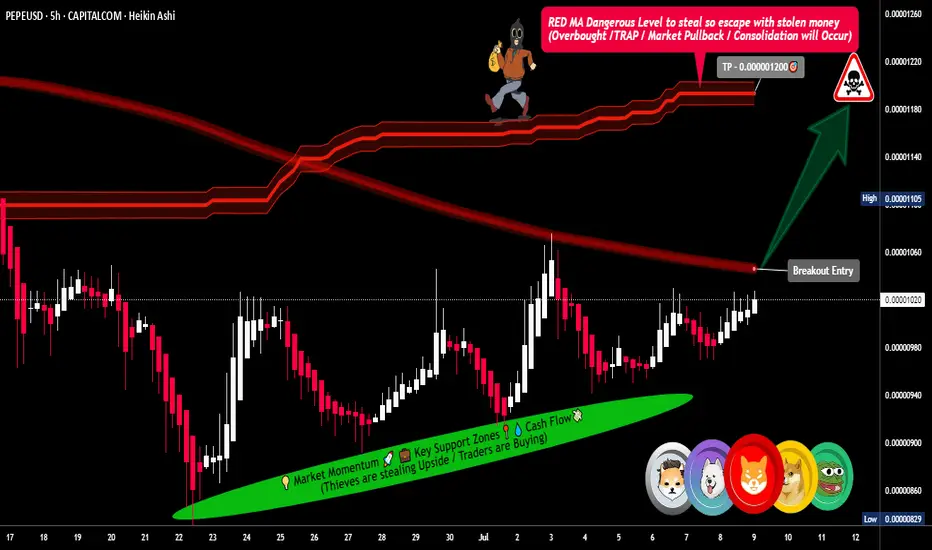
Zone: Red-Hot Resistance Turned Reversal (aka the Profit Trap Zone)
🧨 Entry Strategy:
Wait for the breakout through the Red Moving Average wall at 0.00001060 — that’s your signal the vault is open.
🔑 Execution Plan:
Place Buy Stop Orders just above the breakout level.
Deploy Buy Limit Orders at 15-min/30-min swing lows or consolidation traps.
Use DCA/Layering Entry Style — like a true thief, you never go all in at once.
⚙️ Set Alerts on breakout zones — thieves never sleep on opportunity!
🛑 Stop Loss Tactics (Stealth Exit):
Primary SL: Set just below recent swing low on 5H chart (around 0.00000960).
Wait for the breakout before dropping that SL — don’t get caught too early.
Risk management is your getaway vehicle. Don’t crash it.
🎯 Targets:
Primary Exit: 0.00001200
Optional Early Exit: If the heat’s on, take the bag and disappear. 🏃♂️💨
Always trail your SL to protect your loot.
💡 Scalping & Swing Heist Tips:
Scalpers: Only ride the long waves.
Swing Thieves: Set your traps and be patient — big moves take time.
Big Wallets: Dive in.
Small Wallets: Ride with protection and precision.
🔎 Market Insight (Thief Intel Drop):
PEPE/USD is flashing bullish signals across:
On-chain analytics
COT positioning
Sentiment reversal indicators
Macro economic setups
Intermarket synergy
Get your confirmations before acting — we rob smart, not blind.
⚠️ News & Heat Map Alert:
High-impact news = flashing red lights 🚨
Avoid new positions during major announcements.
Already in the game? Use trailing SL to secure your profits while chaos brews.
🚀 Boost the Robbery!
Smash that Boost Button to join the elite crew of thief traders flipping charts for fun & profit every day. 💎📈
Stay sneaky, stay smart — this ain’t gambling, it’s organized market crimee (the smart kind).
🎭💰 Next Heist Coming Soon — Follow for More Robbery Blueprints! 💣💼
PEPEUSDT Critical Decision Zone – Massive Move Incoming?🧠 Macro Technical Analysis
PEPEUSDT is currently hovering within a critical demand zone (0.00000095 – 0.00000110), an area that has historically acted as a strong accumulation base and a launchpad for previous rallies. The chart structure shows multiple interactions with this zone, highlighting its significance as a key inflection level.
This zone is not just a support — it’s a make-or-break battlefield between bulls and bears. Price is consolidating within this zone, setting the stage for a potential explosive breakout or a dangerous breakdown.
🔍 Pattern Breakdown & Key Technical Levels
Accumulation Zone (Yellow Box):
Seen from April 2024 to now, price has bounced several times from this region. The multiple touches and long wicks confirm strong buying interest here.
Sideways Channel / Range-Bound Structure:
Price action between 0.00000110 and 0.00000283 has formed a clear horizontal range, and the current price is once again testing the lower boundary of this range.
Implied Move Projection (Yellow Arrow):
A potential breakout from this range could trigger a measured move to the upside, aiming for the previous high at 0.00000283 — representing a +150% upside potential from current levels.
📈 Bullish Scenario:
1. Price holds above 0.00000100, maintaining structure above demand.
2. Break and daily close above:
0.00000127 (minor resistance)
Then 0.00000140, which could trigger acceleration.
3. Target levels to watch:
🟡 0.00000162 – Intermediate resistance
🟡 0.00000180 – Confluence zone
🟡 0.00000211 – Mid-range mark
🟡 0.00000240 – Major breakout checkpoint
🟡 0.00000283 – Range high and final bullish target
Break above 0.00000283 could open a parabolic rally.
📉 Bearish Scenario:
1. Breakdown below 0.00000095, followed by rejection from the bottom of the demand zone.
2. This could signal:
Weak market structure
Failed accumulation
Invalidation of the bullish setup
Key downside levels:
🔻 0.00000080 – Local support
🔻 0.00000065 – Historical low defense
🔻 0.00000038 – Macro capitulation zone
⚠️ Breakdown from current levels will turn this accumulation into distribution.
🧭 Strategic Takeaway:
PEPE is trading at a decisive zone. A bounce from this level could signal the start of a new bullish phase, while a breakdown could usher in a deeper bearish trend. Traders should closely monitor volume spikes, breakout candles, and confirmations above 0.00000127 to validate bullish momentum.
This is a low-risk, high-reward setup for disciplined traders with proper risk management.
#PEPEUSDT #PEPE #CryptoTechnicalAnalysis #AltcoinBreakout #MemeCoinSeason #CryptoTrading #AccumulationZone #BreakoutAlert #BullishCrypto #BearishScenario

#PEPEUSDT: Major Swing Upcoming! Get Ready! PEPEUSDT is currently in phase two of accumulation and will distribute the price soon. We expect the price to move in a bullish impulse pattern as we anticipate volatility in the coming days. However, we advise having a secondary bias while investing or trading on cryptocurrency, as it is highly risky and lacks the same volume as forex or gold.
Good luck and trade safely!
Team Setupsfx_

pepe Updateentry price 0.00001425
stop loss update 0.00001425
take profit
0.00001172
0.00001022
0.0000086
result 1 target and risk free

Is PEPE Ready for Its Next Leg Up? Key Support Levels to Watch! PEPE/USDT Analysis: Bullish Trend, Pullback, and Opportunity 🚀🐸
👋 Today, I’m taking a look at the PEPE/USDT chart. We’ve seen PEPE in a strong bullish trend lately, riding a strong momentum wave. Theres a shift at the moment when you look at the broader market—US dollar strength is still in play, and we’re seeing some pullbacks in Bitcoin and other major cryptos. 💵📉
PEPE is starting to pull back. This isn’t a bad thing—in fact, healthy pullbacks are what set up the next big moves. What I’m watching for is a retracement down into a key support zone. If price can hold there and we see a bullish break of structure, that’s my cue to look for a buy opportunity. 🛑➡️📈
The key here is patience. I want to see confirmation that buyers are stepping back in—i.e. strong bullish candles, a clear break of the recent lower high (BoS), or even a spike in volume. If we get that, I’ll be ready to ride the next leg up. Until then, I’m biding my time and letting the market come to me. 🕰️
Remember, no FOMO—let the setup come to you, and always manage your risk.🍀

PEPEUSDT 2DPEPE ~ 2D Analysis
#PEPE Buy after successfully penetrating this resistant line with a short -term target of at least 15%+ from here.

PEPEUSDT Eyes the Sky!BINANCE:PEPEUSDT has shown a strong bounce from a key support level, signaling potential for a continued bullish move. The overall market sentiment is positive, which could act as a catalyst for further upside. With the price structure leaning bullish and momentum picking up, there’s a good chance we’ll see higher highs in the coming sessions. Traders should keep an eye on the next resistance zone as a possible target while maintaining disciplined risk management. Always trade with a clear plan—and most importantly, don’t forget your stop loss!
$1000PEPEUSDT Currently trading at $0.00735
Buy level : Above $0.0071
Stop loss : Below $0.0056
Target : $0.0145
Max leverage 3x
Always keep Stop loss
Follow Our Tradingview Account for More Technical Analysis Updates, | Like, Share and Comment Your thoughts

PEPEUSDT 2DPEPE ~ 2D Analysis
#PEPE Buy gradually after re -testing this support with a short -term target of at least 15%+.

PEPEUSDT 2DPEPE ~ 2D Analysis
#PEPE If you still have a Conviction on this coin, maybe this support you can consider to start buying back with a short -term target of at least 15%+.

PEPEUSDT 4DPEPE ~ 4D Analysis
#PEPE This is a support that was previously an area of accumulation. Buy from here with a minimum target of 20%+

PEPEUSDT %85 Daily Volume SpikeWe previously observed a 25% reaction from the blue box in PEPEUSDT, as mentioned in my earlier analysis. As you can see here:https://www.tradingview.com/chart/PEPEUSDT/VP77qwjf-PEPEUSDT-Flash-Crash-I-m-Ready/
If you utilized low-time frame market breakdowns, you could have caught some excellent risk-to-reward (RR) opportunities. From the latest blue box.
Currently, the price seems to be consolidating, and there is an 85% increase in trading volume today, which is significant. Despite my overall bullish outlook, I believe the price may seek lower levels before continuing its upward trajectory. This potential pullback could provide a new and favorable positioning opportunity.
How to create a position?
When price going down, sometimes CDV goes up, it means an opportunity if general outlook is bullish.
Sometimes we took a retest from volume profile "Point of Control" line and when we reach there we see huge buyers coming in Volume Footprint, it means you can look for an entry.
When trading the blue box, I will rely on indicators like:
Cumulative Delta Volume (CDV)
Liquidity Heatmap
Volume Profile
Volume Footprint
Additionally, I will look for upward market structure breaks in lower time frames for confirmation.
If you'd like to learn how to utilize CDV, liquidity heatmaps, volume profiles, and volume footprints effectively, feel free to visit my profile and contact me.
Best of luck and manage your risk wisely!
If you think this analysis helps you, please don't forget to boost and comment on this. These motivate me to share more insights with you!
I keep my charts clean and simple because I believe clarity leads to better decisions.
My approach is built on years of experience and a solid track record. I don’t claim to know it all, but I’m confident in my ability to spot high-probability setups.
If you would like to learn how to use the heatmap, cumulative volume delta and volume footprint techniques that I use below to determine very accurate demand regions, you can send me a private message. I help anyone who wants it completely free of charge.
My Previous Analysis (the list is long but I think it's kinda good : )
🎯 ZENUSDT.P: Patience & Profitability | %230 Reaction from the Sniper Entry
🐶 DOGEUSDT.P: Next Move
🎨 RENDERUSDT.P: Opportunity of the Month
💎 ETHUSDT.P: Where to Retrace
🟢 BNBUSDT.P: Potential Surge
📊 BTC Dominance: Reaction Zone
🌊 WAVESUSDT.P: Demand Zone Potential
🟣 UNIUSDT.P: Long-Term Trade
🔵 XRPUSDT.P: Entry Zones
🔗 LINKUSDT.P: Follow The River
📈 BTCUSDT.P: Two Key Demand Zones
🟩 POLUSDT: Bullish Momentum
🌟 PENDLEUSDT.P: Where Opportunity Meets Precision
🔥 BTCUSDT.P: Liquidation of Highly Leveraged Longs
🌊 SOLUSDT.P: SOL's Dip - Your Opportunity
🐸 1000PEPEUSDT.P: Prime Bounce Zone Unlocked
🚀 ETHUSDT.P: Set to Explode - Don't Miss This Game Changer
🤖 IQUSDT: Smart Plan
⚡️ PONDUSDT: A Trade Not Taken Is Better Than a Losing One
💼 STMXUSDT: 2 Buying Areas
🐢 TURBOUSDT: Buy Zones and Buyer Presence
🌍 ICPUSDT.P: Massive Upside Potential | Check the Trade Update For Seeing Results
🟠 IDEXUSDT: Spot Buy Area | %26 Profit if You Trade with MSB
📌 USUALUSDT: Buyers Are Active + %70 Profit in Total
🌟 FORTHUSDT: Sniper Entry +%26 Reaction
🐳 QKCUSDT: Sniper Entry +%57 Reaction
📊 BTC.D: Retest of Key Area Highly Likely
I stopped adding to the list because it's kinda tiring to add 5-10 charts in every move but you can check my profile and see that it goes on..

PEPEUSDT 6DPEPE Update ~ 6D
#PEPE So far it still maintains its bullish structure. Buy gradually within this support block,. it's only a matter of time these Memes will make new highs.

PEPEUSDTPEPE ~ 1D ✅
#PEPE Make purchases gradually on this support block, short term target of at least 10%+ 🟡

PEPEUSDT 4HPEPE ~ 4H
#PEPE For the short term, This is a Bullish pattern. Purchase after breaking through the Resistance line of this pattern.

PEPEUSDT Elliott Waves AnalysisHello friends.
Please support my work by clicking the LIKE button👍(If you liked). Also i will appreciate for ur activity. Thank you!
Everything on the chart.
Entry: Market and lower
Targets: 0.0000009 - 0.000012 - 0.000014 - 0.000017
after first target reached move ur stop to breakeven
Stop: (depending of ur risk).
ALWAYS follow ur RM
risk is justified
Good luck everyone!
Follow me on TRADINGView, if you don't want to miss my next analysis or signals.
It's not financial advice.
DYOR!
