Can PepsiCo Extend Higher Following This Technical Breakout?📈 ASSET OVERVIEW
Asset: NASDAQ:PEP — PEPSICO, INC
Exchange: NASDAQ
Market Type: Stock
Trading Style: Swing Trade
🧠 TRADE THESIS (BULLISH BIAS)
NASDAQ:PEP has activated a bullish structure following a Triangular Moving Average (TMA) breakout, signaling a potential trend continuation phase.
Price action confirms:
Higher lows structure 📊
Momentum expansion after consolidation
Breakout supported by trend-following averages
This setup favors controlled accumulation, not chasing.
🎯 ENTRY PLAN — STEALTH LAYERING STRATEGY
Instead of a single fixed entry, this plan uses a layered limit order approach to manage volatility and improve average price.
🔹 Layered Buy Limits (Example):
150.00
148.00
147.00
146.00
📌 You may add or adjust layers based on personal risk management and market volatility.
📌 Entry can also be taken at any price level depending on confirmation and execution style.
This method helps:
Reduce emotional entries
Improve risk-adjusted positioning
Adapt to pullbacks without panic
🛑 RISK MANAGEMENT (STOP-LOSS)
Protective Stop: 144.00
⚠️ Risk management is always trader-dependent.
This stop is a reference level, not a mandatory rule.
Adjust based on:
Account size
Risk tolerance
Timeframe preference
🎯 PROFIT OBJECTIVE
Primary Target: 158.00
This zone aligns with:
Strong historical resistance
Overbought conditions
Potential liquidity trap area
📌 Partial profit booking is encouraged near resistance.
📌 Capital protection > maximum profit.
🔍 ADDITIONAL CONFIRMATIONS TO WATCH
Volume expansion on continuation
Price holding above breakout structure
No aggressive bearish rejection near resistance
🔗 RELATED SYMBOLS TO WATCH (CORRELATION CHECK)
NYSE:KO (Coca-Cola) → Sector strength confirmation
AMEX:SPY → Overall market risk sentiment
AMEX:XLP → Consumer Staples sector momentum
📊 If AMEX:XLP & NYSE:KO remain strong, probability increases for NASDAQ:PEP follow-through.
⚠️ IMPORTANT NOTES
This is not financial advice
Market conditions can change rapidly
Always align execution with your personal trading plan
✨ “If you find value in my analysis, a 👍 and 🚀 boost is much appreciated — it helps me share more setups with the community!”
Disclaimer: This is a stealth-style trading strategy shared for educational and entertainment purposes only.
#PEP #PepsiCo #SwingTrading #NASDAQ #BullishBreakout
#LayeredEntry #TechnicalAnalysis #Stocks #TradingView
Pepsilong

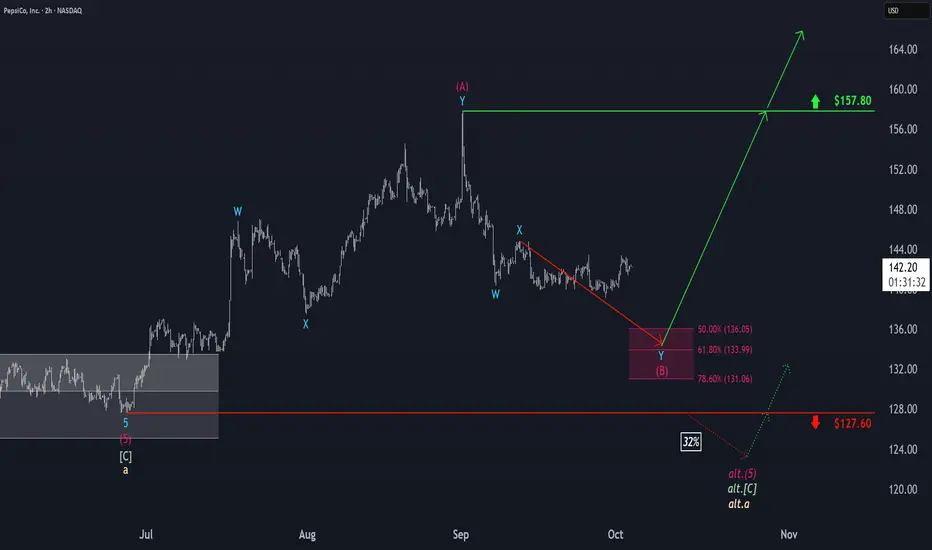
PepsiCo: Approaching the Target ZonePepsi shares have traded mostly sideways within a broader range over the past two weeks. Our primary outlook is that the ongoing magenta wave (B) will continue to move lower, eventually bottoming within the similarly colored long Target Zone between $136.05 and $131.06. From that point, we expect the broader upward trend to resume. However, a sustained move below the $127.60 support level would trigger our alternative scenario (probability: 32%). In this case, the larger beige wave alt.a would remain incomplete, suggesting the correction phase could be deeper and longer than projected in the primary scenario.
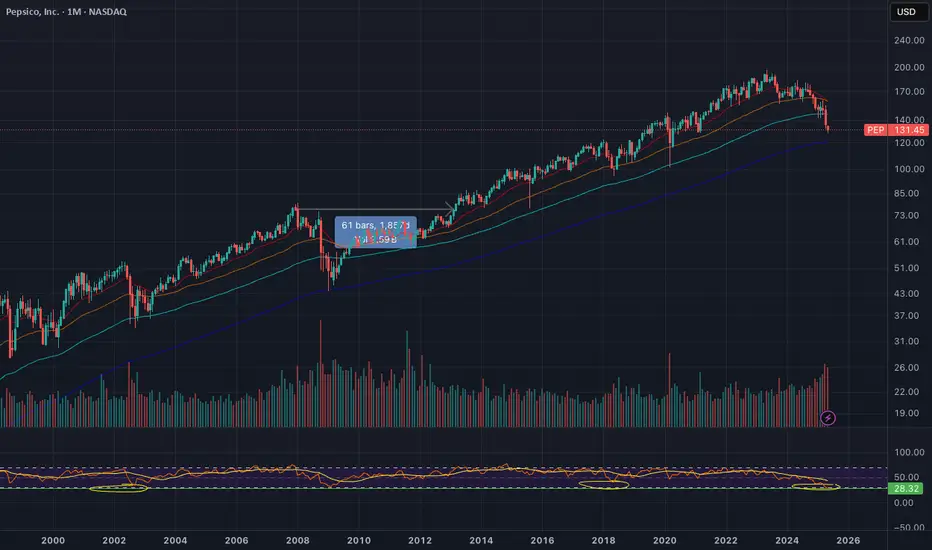
PEP: Long Buy OpportunityPEP is about to touch the 200 Monthly Moving Average. This last 2009.
The RSI is touching less than 30, which last happened in 1973.
PEP is a Dividend King which has increased it's dividend for 53 years. Did Warren Buffett say compounding is the 8th wonder of the world? Oh no, it was Einstein.
Evidence suggests great Long Term BUY opportunity on the price and momentum signals. Compelling.
#PEPSICO (PEP)
PepsiCo _ Next Target is Triangle Pattern TopPepsiCo is forming a Triangle Pattern. The Next Target is the Top of the Triangle. If it doesn't Breakout above the Triangle Pattern (or) Resistance, the market is Expected to move downward again, anticipating a breakout at the bottom of the triangle. If there is a breakout at the bottom of the triangle, the market Expects a 27% fall. Because PepsiCo has been trading within two parallel lines, or a channel, since 2009. Therefore, if it breakout on the bottom side of the triangle pattern, the market could fall to at least the 0.3 Fibonacci Retracement level. Refer to this below image :
Support me; I want to Help People Make PROFIT all over the "World".


🟢 PEPSICO - 1D (12.10.2022)🟢 PEPSICO
TF: 1D
Side: Long
Pattern: Falling Wedge
SL: $157.35
TP 1: $165.71
TP 2: $168.63
TP 3: $171.00
Nice falling wedge has formed on the 1D time frame.
You can buy now and DCA if the price reaches the red area or wait to see if the price goes there first.

PEP - Aug 5 to ....- Supertrend signals a "Buy" on July 28, 2022
- 50 Day crosses the 200 Day EMA on the Daily Chart upwards.
Entry Price - 250 @ $175.36
Stop Loss - $157.37
Target Price (1.5:1) - $202.27
- SOLD on
=

PEPSI is ParabolicComparison between two runs, bitcoins 2017 parabolic run, and the massive parabola that is continuing to form on PEPSI
Expect Pepsi to continue this run for many years, assuming we aren't at the top already.

PEP - STOCKS - 11. OCT. 2021Welcome to our Weekly V2-Trade Setup ( PEP ) !
-
4 HOUR
Solid performance and data.
DAILY
Expecting more bullish price action!
WEEKLY
Great long entries, underprices imo..
-
STOCK SETUP
BUY PEP
ENTRY LEVEL @ 156.92
SL @ 149.40
TP @ Open
Max Risk: 0.5% - 1%!
(Remember to add a few pips to all levels - different Brokers!)
Leave us a comment or like to keep our content for free and alive.
Have a great week everyone!
ALAN
