💉 Pfizer, Inc. Goes Bearish | 44, 39 and 34 Coming NextThe PFE stock, Pfizer, Inc., looks like is about to take a deep dive... Going red... Let's have a look!
The most obvious signal is the weekly candle today moving below EMA50, telling us that this stock is preparing to drop for months.
Pfizer, Inc. peaked December 2021.
In mid-December 2022 PFE printed the inverted hammer bearish candlestick pattern or shooting star.
This candlestick came at a long-term lower high (Dec. 2022 vs Dec. 2021).
Trading volume has been decreasing since November 2020.
The RSI has moved below 50, now bearish, and is trending down strong.
The next and at the same time critical support level is 48.24.
If this level breaks, PFE is going to move to 39.91 as a new low with even lower possible, but this level is the main one.
Bearish target of 39.91 at 0.618 Fib. retracement level followed by 0.786 or 33.98.
There is something going on at Twitter as well... I don't know...
Do your own research... Not only about trading but also about your health.
Thank you for reading.
Namaste.
PFIZER

Pfizer Stock: More Than Just COVID-19 VaccinesYou may be familiar with the negative sentiment surrounding Pfizer, with many citing the company's heavy reliance on its COVID-19 vaccine Comirnaty and antiviral therapy Paxlovid as a cause for concern. In addition to this, several of Pfizer's top-selling drugs will face patent expirations in the near future, leading many to believe that the company's stock will suffer.
While there are certainly challenges facing Pfizer, the conclusion that its stock will suffer is flawed. Despite the company's current predicament, there is a lot to be excited about. Let's explore why Pfizer's stock is becoming increasingly attractive.
Over the past five weeks, Pfizer has received a string of positive news. The U.S. Food and Drug Administration (FDA) approved Cibinqo for the treatment of adolescents with atopic dermatitis, marking a significant milestone for the company's growth strategy. Additionally, a late-stage study evaluating the combination of Talzenna and Xtandi to treat metastatic castration-resistant prostate cancer produced positive results, reducing the risk of disease progression or death by 37%.
Furthermore, Pfizer announced that regulatory applications for elranatamab had been accepted by the FDA and the European Medicines Agency for the treatment of multiple myeloma. The company expects FDA approval to be granted later this year. In addition, an FDA advisory committee voted to approve Pfizer's respiratory syncytial virus (RSV) vaccine for older adults, which could open up a major market opportunity for the company.
On March 10, the FDA approved Zavzpret for the treatment of migraine. Pfizer acquired the drug as part of its purchase of Biohaven in 2022. The company also announced plans to acquire Seagen for $43 billion, which caused Pfizer's stock to rise significantly. The acquisition will provide Pfizer with four approved cancer drugs and promising antibody-drug conjugates (ADCs) that could generate $10 billion in risk-adjusted revenue by 2030.
Despite all of these positive developments, Pfizer's stock remains undervalued by investors. Its price is still nearly 35% below its late 2021 high, trading at just 12 times expected earnings. However, the company's dividend has risen to 4.1%, its highest level since mid-2021.
Investors seem to be fixated on the difficulties associated with COVID-19 and its treatment, but Pfizer predicts that even on this front, there is good news to come. The company expects demand for Comirnaty to rise to 98 million doses by 2026 due to the launch of the combination flu vaccine COVID. Additionally, demand for Paxlovid is predicted to grow steadily over the next few years, with the possibility of promoting antiviral therapy in China.
In conclusion, while there are certainly challenges facing Pfizer, the outlook for the company's stock is better than many people think. Despite the conventional wisdom that Pfizer's stock will suffer, the company is making significant strides towards achieving its goals. Investors should take note of the recent positive developments and consider investing in this pharmaceutical giant.

Pfizer PFE Long Weekly and MonthlyBuy Feb-24-23 43.5 Calls @ 0.1 Limit to Open (Weekly)
Buy Mar-24-23 47 Calls @ 0.11 Limit to Open (Monthly (W))

PFIZER (PFE) 6M Trading Analisys (TA)6M Chart, PFE , on February 6, 2023, the signals on MACD have been steadily moving NE, after piercing below the histogram on July 2012; On July 2021, reached its ATH (All Time High); The RSI signal bounced over 70 and is now facing SE to test the line of 50, after bouncing up from it on January 2020; The price has been steadily falling since the ATH, from $60 to $43, heading down to test the 100 days MA signal, at this moment there is a probability for the price to bounce up before continuing its way down to test the 100 MA signal, which is the optimistic approach, but remember "In this business if you're good, you're right six times out of ten. You're never going to be right nine times out of ten. I've found that when the market's going down and you buy funds wisely, at some point in the future you will be happy. You won't get there by reading: "Now is the time to buy".
Today this ticker has a Volume of 5.297M with a Market Cap of 246B.
This Company PAYS DIVIDENDS TO SHAREHOLDERS
Pfizer Inc. is a research-based global biopharmaceutical company. It engages in the discovery, development, manufacture, marketing, sales, and distribution of biopharmaceutical products worldwide. The firm works across developed and emerging markets to advance wellness, prevention, treatments, and cures that challenge the most feared diseases. The company was founded by Charles Pfizer Sr. and Charles Erhart in 1849 and is headquartered in New York, NY.
Good Luck!
Gráfico de 6M, ( PFE ), al 6 de febrero de 2023, las señales en MACD se han estado moviendo constantemente hacia el NE, luego de cruzarse por debajo del histograma en julio de 2012; En julio de 2021, alcanzó su ATH (Mayor Precio Histórico); La señal RSI rebotó sobre 70 y ahora se dirige al SE para probar la señal de 50, luego de rebotar ahi en enero de 2020; El precio ha estado cayendo constantemente desde el ATH, de $60 a $43, bajando para probar la señal de 100 días MA, en este momento existe la probabilidad de que el precio rebote antes de continuar su camino hacia abajo para probar la señal de 100 MA, que es el enfoque optimista, pero recuerda: "En este negocio, si eres bueno, tienes razón seis de cada diez veces. Nunca vas a tener razón nueve de cada diez veces. Descubrí que cuando el mercado está cayendo y compras fondos sabiamente, en algún momento en el futuro serás feliz. No llegarás allí leyendo: "Ahora es el momento de comprar".
Hoy este ticker tiene un Volumen de 5.297M con una Capitalización de Mercado de 246B.
Esta Empresa PAGA DIVIDENDOS A LOS ACCIONISTAS
Pfizer Inc. es una compañía biofarmacéutica global basada en la investigación. Se dedica al descubrimiento, desarrollo, fabricación, comercialización, venta y distribución de productos biofarmacéuticos en todo el mundo. La firma trabaja en mercados desarrollados y emergentes para promover el bienestar, la prevención, los tratamientos y las curas que desafían las enfermedades más temidas. La empresa fue fundada por Charles Pfizer Sr. y Charles Erhart en 1849 y tiene su sede en Nueva York, NY.
¡Buena suerte!
“I believe in analysis and not forecasting.” / "Creo en el análisis y no en el pronóstico".
REMEMBER : I am not a financial adviser nor is any content in this article presented as financial advice. The information provided in this blog post and any other posts that I make, and any accompanying material is for informational purposes only. It should not be considered financial or investment advice of any kind. One should consult with a financial or investment professional to determine what may be best for your individual needs. RECUERDE : No soy un asesor financiero y el contenido de este artículo no se presenta como asesoramiento financiero. La información provista en esta publicación de blog y cualquier otra publicación que haga y cualquier material que la acompaña es solo para fines informativos. No debe considerarse asesoramiento financiero o de inversión de ningún tipo. Se debe consultar con un profesional financiero o de inversiones para determinar qué es lo mejor para sus necesidades individuales.

$PFE - Oversold. Possible seller exhaustion#Pfizer has been oversold for some time. Today's gap down on UBS downgrade could be the seller exhaustion and potential bounce to come.
Target 1 - $46.5
Target 2 - $47.67
Target 3 - $51
Long term - $60
Risk - fall to $41.
——
Trade is done when it hit one of the target or stop loss is hit.
Disclaimer: Trading note. Not an investment advice.

PFE | Good Starter Position Entry | LONGPfizer Inc. discovers, develops, manufactures, markets, distributes, and sells biopharmaceutical products worldwide. It offers medicines and vaccines in various therapeutic areas, including cardiovascular metabolic and women's health under the Premarin family and Eliquis brands; biologics, small molecules, immunotherapies, and biosimilars under the Ibrance, Xtandi, Sutent, Inlyta, Retacrit, Lorbrena, and Braftovi brands; and sterile injectable and anti-infective medicines, and oral COVID-19 treatment under the Sulperazon, Medrol, Zavicefta, Zithromax, Vfend, Panzyga, and Paxlovid brands. The company also provides medicines and vaccines in various therapeutic areas, such as pneumococcal disease, meningococcal disease, tick-borne encephalitis, and COVID-19 under the Comirnaty/BNT162b2, Nimenrix, FSME/IMMUN-TicoVac, Trumenba, and the Prevnar family brands; biosimilars for chronic immune and inflammatory diseases under the Xeljanz, Enbrel, Inflectra, Eucrisa/Staquis, and Cibinqo brands; and amyloidosis, hemophilia, and endocrine diseases under the Vyndaqel/Vyndamax, BeneFIX, and Genotropin brands. In addition, the company is involved in the contract manufacturing business. It serves wholesalers, retailers, hospitals, clinics, government agencies, pharmacies, and individual provider offices, as well as disease control and prevention centers. The company has collaboration agreements with Bristol-Myers Squibb Company; Astellas Pharma US, Inc.; Myovant Sciences Ltd.; Akcea Therapeutics, Inc; Merck KGaA; Valneva SE; BioNTech SE; and Arvinas, Inc. Pfizer Inc. was founded in 1849 and is headquartered in New York, New York.

Pfizer BullishThe Chart currently shows Bullish signal as per these indicators:
1. Bullish Falling Wedge Chart Pattern
2. Bullish Divergence ( RSI )
If the upper trendline is broken can expect further upside potential.

#LUPIN #LAURUSLABS #ZYDUSLIFE #APOLLOHOSP #FORTIS #AARTIDRUGS #I#LUPIN
NSE: LUPIN
CMP: 756
TP: 910
SL: 700
TF: <6m
RR > 3 times
Return > 20%
THYROCARE CNXPHARMA LUPIN NSE:CIPLA SUNPHARMA SPARC DIVISLAB DRREDDY AUROPHARMA BALPHARMA GLENMARK SANOFI PFIZER BPLPHARMA MARKSANS BIOCON GRANULES IPCALAB LAURUSLABS NATCOPHARM GLAND ALKEM ZYDUSLIFE APOLLOHOSP FORTIS AARTIDRUGS
Factors:
BULLISH WEDGE BREAKOUT
Trend Following
Rising Volume with rising Prices.
Flag pattern breakout.
Pennant Pattern Breakout with Bullish Candle.
Retest Successful.
Higher Highs & Higher Lows.
Broken above RESISTANCE levels
Trading at SUPPORT levels
Earnings are strong.
Bullish Wedge Breakout
Risk Return Ratio is healthy.
And
Rising from Double Bottom Pattern to Flag Pattern forming.
If you like my work KINDLY LIKE SHARE & FOLLOW this page for free Stock Recommendations.
With 💚 from Rachit Sethia

#AUROPHARMA #CIPLA #DIVISLAB #DRREDDY #LUPIN #GLENMARK #PFIZER #AUROPHARMA
NSE: AUROPHARMA
CMP: 437
TP: 535
SL: 400
TF: <6m
RR > 3.5 times
Return > 22%
THYROCARE CNXPHARMA LUPIN NSE:CIPLA SUNPHARMA SPARC DIVISLAB DRREDDY AUROPHARMA BALPHARMA GLENMARK SANOFI PFIZER
Factors:
BULLISH WEDGE BREAKOUT
Trend Following
Rising Volume with rising Prices.
Flag pattern breakout.
Pennant Pattern Breakout with Bullish Candle.
Retest Successful.
Higher Highs & Higher Lows.
Broken above RESISTANCE levels
Trading at SUPPORT levels
Earnings are strong.
Bullish Wedge Breakout
Risk Return Ratio is healthy.
And
Rising from Double Bottom Pattern to Flag Pattern forming.
If you like my work KINDLY LIKE SHARE & FOLLOW this page for free Stock Recommendations.
With 💚 from Rachit Sethia

#GLENMARK #SANOFI #PFIZER #BPLPHARMA #MARKSANS #BIOCON #GRANULES#GLENMARK
NSE: GLENMARK
CMP: 440
TP: 515
SL: 400
TF: <6m
RR > 2 times
Return > 17%
THYROCARE CNXPHARMA LUPIN NSE:CIPLA SUNPHARMA SPARC DIVISLAB DRREDDY AUROPHARMA BALPHARMA GLENMARK SANOFI PFIZER BPLPHARMA MARKSANS BIOCON GRANULES IPCALAB LAURUSLABS NATCOPHARM GLAND ALKEM ZYDUSLIFE
Factors:
BULLISH WEDGE BREAKOUT
Trend Following
Rising Volume with rising Prices.
Flag pattern breakout.
Pennant Pattern Breakout with Bullish Candle.
Retest Successful.
Higher Highs & Higher Lows.
Broken above RESISTANCE levels
Trading at SUPPORT levels
Earnings are strong.
Bullish Wedge Breakout
Risk Return Ratio is healthy.
And
Rising from Double Bottom Pattern to Flag Pattern forming.
If you like my work KINDLY LIKE SHARE & FOLLOW this page for free Stock Recommendations.
With 💚 from Rachit Sethia

#CIPLA #BALPHARMA #GLENMARK #SANOFI #PFIZER #AUROPHARMA #NIFTY50#CIPLA
NSE: CIPLA
CMP: 1128
TP: 1250
SL: 1080
TF: <6m
RR > 2.5 times
Return > 11%
THYROCARE CNXPHARMA LUPIN NSE: CIPLA SUNPHARMA SPARC DIVISLAB DRREDDY AUROPHARMA BALPHARMA GLENMARK SANOFI PFIZER
Factors:
BULLISH WEDGE BREAKOUT
Trend Following
Rising Volume with rising Prices.
Flag pattern breakout.
Pennant Pattern Breakout with Bullish Candle.
Retest Successful.
Higher Highs & Higher Lows.
Broken above RESISTANCE levels
Trading at SUPPORT levels
Earnings are strong.
Bullish Wedge Breakout
Risk Return Ratio is healthy.
And
Rising from Double Bottom Pattern to Flag Pattern forming.
If you like my work KINDLY LIKE SHARE & FOLLOW this page for free Stock Recommendations.
With 💚 from Rachit Sethia

Pfizer in a bull flag.Pfizer - 30d expiry - We look to Buy a break of 48.31 (stop at 46.56)
Short term bias has turned positive.
Posted a bullish Flag formation.
A break of 48.26 is needed to confirm the outlook.
A break of the recent high at 48.26 should result in a further move higher.
Short term momentum is bullish.
This stock has seen good sales growth.
The bias is to break to the upside.
Our profit targets will be 52.69 and 53.69
Resistance: 48.00 / 49.70 / 52.00
Support: 46.70 / 46.00 / 44.70
Disclaimer – Saxo Bank Group.
Please be reminded – you alone are responsible for your trading – both gains and losses. There is a very high degree of risk involved in trading. The technical analysis , like any and all indicators, strategies, columns, articles and other features accessible on/though this site (including those from Signal Centre) are for informational purposes only and should not be construed as investment advice by you. Such technical analysis are believed to be obtained from sources believed to be reliable, but not warrant their respective completeness or accuracy, or warrant any results from the use of the information. Your use of the technical analysis , as would also your use of any and all mentioned indicators, strategies, columns, articles and all other features, is entirely at your own risk and it is your sole responsibility to evaluate the accuracy, completeness and usefulness (including suitability) of the information. You should assess the risk of any trade with your financial adviser and make your own independent decision(s) regarding any tradable products which may be the subject matter of the technical analysis or any of the said indicators, strategies, columns, articles and all other features.
Please also be reminded that if despite the above, any of the said technical analysis (or any of the said indicators, strategies, columns, articles and other features accessible on/through this site) is found to be advisory or a recommendation; and not merely informational in nature, the same is in any event provided with the intention of being for general circulation and availability only. As such it is not intended to and does not form part of any offer or recommendation directed at you specifically, or have any regard to the investment objectives, financial situation or needs of yourself or any other specific person. Before committing to a trade or investment therefore, please seek advice from a financial or other professional adviser regarding the suitability of the product for you and (where available) read the relevant product offer/description documents, including the risk disclosures. If you do not wish to seek such financial advice, please still exercise your mind and consider carefully whether the product is suitable for you because you alone remain responsible for your trading – both gains and losses.

PFIZER Broke above its 2022 Bear Channel!Pfizer (PFE) broke and closed today above the Channel Down that has been dominating the 2022 Bear Market since the January 11 High. At the same time the 1D RSI has been ranging and while the 1D MA200 (orange trend-line) held successfully last time, we do expect one last test or for an even more comfortable long-term buy, the 1D MA50 (blue trend-line).
As you may notice, the Fibonacci retracement levels since the All Time High, formed solid Resistance and Support levels during the downtrend, so after the next pull-back our target will by the 0.786 Fib at 57.35.
-------------------------------------------------------------------------------
** Please LIKE 👍, SUBSCRIBE ✅, SHARE 🙌 and COMMENT ✍ if you enjoy this idea! Also share your ideas and charts in the comments section below! This is best way to keep it relevant, support me, keep the content here free and allow the idea to reach as many people as possible. **
-------------------------------------------------------------------------------
You may also TELL ME 🙋♀️🙋♂️ in the comments section which symbol you want me to analyze next and on which time-frame. The one with the most posts will be published tomorrow! 👏🎁
-------------------------------------------------------------------------------
💸💸💸💸💸💸
👇 👇 👇 👇 👇 👇

PFENot financial advice. The essence of investing & trading is the intelligent and patient preying on the greed, fear, impatience, addiction and ignorance of the majority. It's definitionally Darwinian.

2X $PFE PUTS SET TO PRINT !????? Possible -10% FALL Pfizer is forming a head and shoulders pattern on the 2HR timeframe it has broken the right shoulder trendline and we will look to enter short and puts and play pfizer stock down to the next key levels!

PFENot financial advice.
The essence of investing & trading is the intelligent and patient preying on the greed, fear, impatience, addiction and ignorance of the majority. It's definitionally Darwinian.

Accumulating PFE from $46.00 - $47.50 This is one of the stocks I hold indefinitely for dividends.
we're at the bottom of our current channel and a double bottom is forming in a major area of support.
In my previous post I stated my accumulation sections are in the lower end of the channel, so this is prime real estate to enter.
Momentum downwards has come to a halt and I believe we will retest the center channel line from this point.
I am diversifying a portion of profits I made from the last 2 trade set ups I've posted into PFE. A fundamentally sound entity in our current market economy.
I'm sure you could assume why.

pfizer is ready to see $53 pfizer is ready to see $53 , it's in G diametric pattern and it's ready to compete it to make b of flat

PFE: Triangle break!Pfizer
Short Term - We look to Sell at 50.48 (stop at 52.47)
Our outlook is bearish. Broken out of the triangle formation to the downside. This is negative for sentiment and the downtrend has potential to return. Further downside is expected although we prefer to sell into rallies close to the 51.00 level.
Our profit targets will be 45.49 and 42.00
Resistance: 50.00 / 54.00 / 62.00
Support: 45.00 / 40.00 / 34.00
Please be advised that the information presented on TradingView is provided to Vantage (‘Vantage Global Limited’, ‘we’) by a third-party provider (‘Signal Centre’). Please be reminded that you are solely responsible for the trading decisions on your account. There is a very high degree of risk involved in trading. Any information and/or content is intended entirely for research, educational and informational purposes only and does not constitute investment or consultation advice or investment strategy. The information is not tailored to the investment needs of any specific person and therefore does not involve a consideration of any of the investment objectives, financial situation or needs of any viewer that may receive it. Kindly also note that past performance is not a reliable indicator of future results. Actual results may differ materially from those anticipated in forward-looking or past performance statements. We assume no liability as to the accuracy or completeness of any of the information and/or content provided herein and the Company cannot be held responsible for any omission, mistake nor for any loss or damage including without limitation to any loss of profit which may arise from reliance on any information supplied by Signal Centre.

Pfizer | Fundamental Analysis | Must ReadSo far this year has not been kind to stock markets. And while many drug makers have avoided a selloff, Pfizer is not one of them. The pharmaceutical giant has performed more or less on par with the broader market to date. Fortunately, Pfizer's latest quarterly report showed some very encouraging signs.
However, there are also reasons to be concerned about the future of this medical company. Let's look at one earnings-related reason why Pfizer might be a buy and one reason why it might not be.
Pfizer has made a fortune over the past couple of years through its work on coronaviruses. The company continues to benefit greatly from these efforts. In Q2, the company's revenues rose 53% year over year to $27.7 billion. According to company executives, Pfizer recorded the largest quarterly sales in its history during the period, and that was primarily due to its COVID-19 product line.
Sales of the coronavirus vaccine totaled $8.8 billion, up 20% from last year. Sales of the coronavirus drug Paxlovid were $8.1 billion (no year-over-year comparison here, since the drug received approval in December). These two drugs alone accounted for more than half of Pfizer's total revenue.
While Pfizer's line of drugs against coronaviruses is currently unparalleled, the rest of the company's portfolio is not as impressive. The non-coronavirus drug maker's revenues grew a paltry 1% year-over-year in Q2. Pfizer's line of drugs faces a number of challenges, including adverse events related to its immunologic drug Xeljanz. Xeljanz belongs to a class of drugs known as JAK inhibitors.
Last year, Pfizer published data from a post-marketing study that showed Xeljanz was associated with higher rates of cardiovascular events and cancer than TNF inhibitors, a drug category that includes AbbVie's Humira.
The results of this study, combined with a regulatory decision to add a warning about these risks to the label of Xeljanz (and other JAK inhibitors), are holding back sales of the drug. In Q2, sales of Xeljanz declined 24% year over year to $430 million. Revenues for the immunosuppressant Enbrel also fell 10% year over year to $257 million, probably because of tougher competition, which also affected its sales in Q1.
Pfizer has some good non-coronavirus numbers, including its drug Eliquis. In Q2, sales of that anticoagulant rose 23% year over year to $1.7 billion. But overall, the company has barely been able to increase sales outside of its line of coronavirus drugs. This could be a problem if sales of COVID-19 products fall sharply after this year.
In my opinion, the market is still underestimating Pfizer. First, the company will continue to make profits from Paclovid and Comirnati. COVID-19 will not (unfortunately) suddenly disappear out of thin air after this year. Even if the demand for drugs to prevent or treat the disease declines, Paxlovid and Komirnati can continue to make significant contributions to Pfizer's top-line revenue for a long time to come.
Second, while the rest of the drug line is unimpressive, pharmaceutical companies sometimes face this problem because of growing competition, patent breaks, or other factors. But drug makers generally don't have the advantage of growing sales at the rate that Pfizer does when they face such obstacles.
What matters is whether the company in question can meet these challenges. Having a solid portfolio and plenty of money to devote to research and development helps - and Pfizer has both. Thanks to the company's success in the coronavirus market, its cash balance has skyrocketed.
Pfizer has been active in acquisitions and plans to continue on that path. This should help bolster its already solid line of drugs, which has more than 90 clinical trials. Pfizer expects up to 15 new approvals over the next 18 months. Some of the current programs could go wrong. But the company has all the tools it needs to launch several new potential blockbuster drugs in the next five years. That's why investors should siphon off the company's stock before it rises in price.
PFE not making it through the trendline againPFE is touching the diagonal trendline to the upside again. Can't wait for the breakout. LT holding with nice dividend.

Pfizer: to complete the recovery journeyPfizer stock
He is about to complete the recovery journey he started from the bottom of last June 17
Its recent decline received strong support from the $50.50 barrier
And it is testing a resistance between the average 100 and 51.48 by breaching it, while reaping the momentum with a higher trading volume that increases the chances of the rise

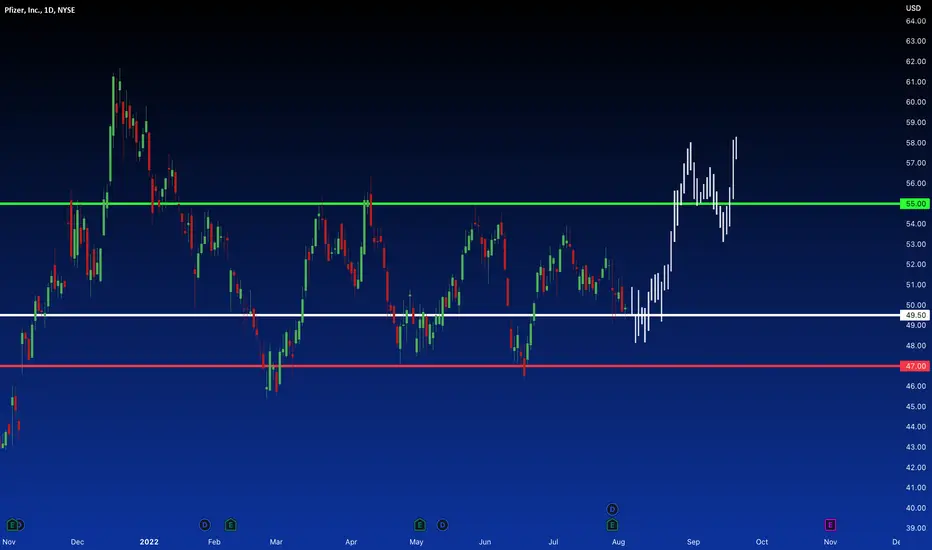
Pfizer: Playing the range againPfizer
Short Term
We look to Sell at 54.06 (stop at 56.08)
Bespoke resistance is located at 54.50. A move higher faces tough resistance and we remain cautious on upside potential. Selling spikes offers good risk/reward. Further downside is expected although we prefer to sell into rallies close to the 54.60 level. We are trading at overbought extremes.
Our profit targets will be 46.80 and 44.60
Resistance: 54.50 / 56.32 / 61.71
Support: 50.00 / 46.50 / 40.94
Disclaimer – Saxo Bank Group. Please be reminded – you alone are responsible for your trading – both gains and losses. There is a very high degree of risk involved in trading. The technical analysis, like any and all indicators, strategies, columns, articles and other features accessible on/though this site (including those from Signal Centre) are for informational purposes only and should not be construed as investment advice by you. Such technical analysis are believed to be obtained from sources believed to be reliable, but not warrant their respective completeness or accuracy, or warrant any results from the use of the information. Your use of the technical analysis, as would also your use of any and all mentioned indicators, strategies, columns, articles and all other features, is entirely at your own risk and it is your sole responsibility to evaluate the accuracy, completeness and usefulness (including suitability) of the information. You should assess the risk of any trade with your financial adviser and make your own independent decision(s) regarding any tradable products which may be the subject matter of the technical analysis or any of the said indicators, strategies, columns, articles and all other features.
Please also be reminded that if despite the above, any of the said technical analysis (or any of the said indicators, strategies, columns, articles and other features accessible on/through this site) is found to be advisory or a recommendation; and not merely informational in nature, the same is in any event provided with the intention of being for general circulation and availability only. As such it is not intended to and does not form part of any offer or recommendation directed at you specifically, or have any regard to the investment objectives, financial situation or needs of yourself or any other specific person. Before committing to a trade or investment therefore, please seek advice from a financial or other professional adviser regarding the suitability of the product for you and (where available) read the relevant product offer/description documents, including the risk disclosures. If you do not wish to seek such financial advice, please still exercise your mind and consider carefully whether the product is suitable for you because you alone remain responsible for your trading – both gains and losses.
