PGNY. Bullish technical setup, weak fundamentals, Key levelsThis analysis combines NASDAQ:PGNY both fundamental and technical perspectives.
Fundamental View
From a fundamental standpoint, PGNY looks weak and potentially overvalued.
1. EPS and profitability
EPS remains unstable. After reaching break even around 2021, it has been fluctuating between 0.4 and 0.6. There is no clear EPS growth trend, which puts pressure on the valuation.
2. Revenue growth
Revenue growth used to be strong at 40 to 50 percent per year.
Over the past year growth has slowed dramatically to about 7 percent.
The expected quarterly growth is around 10 percent which is still far below historical levels.
3. Forward P E
The forward P E is around 44 which is expensive given the current fundamentals.
4. Cash flow and capital structure
Cash flow has been flat since 2024.
The liquidity cushion is small at about 190 million and not growing.
The company executed a small buyback from May to December 2024 but is now slightly diluting shares by 0.3 to 0.6 percent.
Fundamental conclusion:
The stock looks overpriced. Growth is slowing and EPS is not improving while valuation remains high.
Technical View
Technical analysis gives a much more bullish picture.
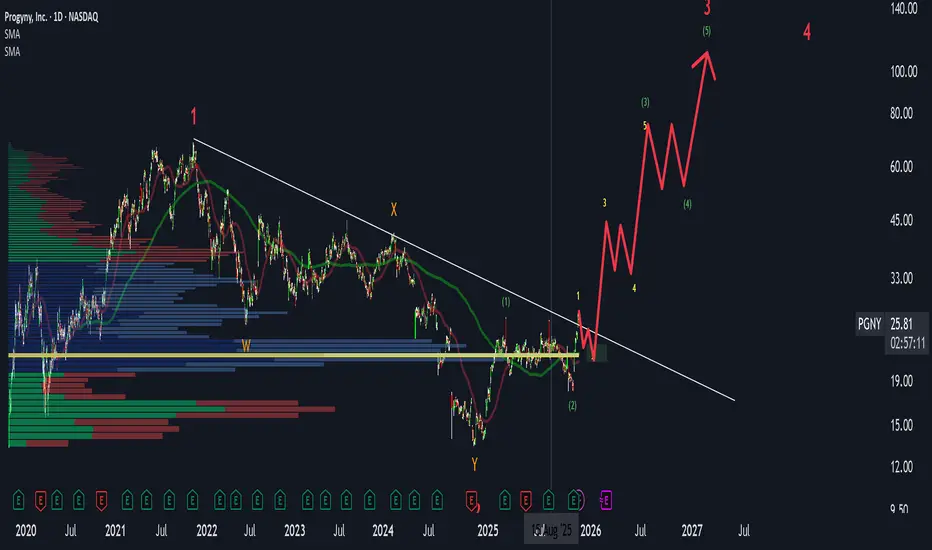
1. Completion of a large Wave Two
Price appears to have completed a W X Y corrective structure.
The important OX trendline has been broken which is a strong bullish signal.
2. Local wave structure
A clear first and second wave have formed to the upside.
The trendline breakout was confirmed by a candle with increased volume.
Usually after such a breakout price retests the line from above and continues higher.
Expected movement:
potential retest near 20
after that a move toward 45
above 45 the next technical target is around 68
3. Volume profile
Price is currently sitting at the lower boundary of the major volume cluster between 20 and 25 dollars.
This area is strong support where reversals often occur.
Gaps and Risks
There are several important gaps that may influence the price action.
1. Gap at 18 to 19 dollars
Price may attempt to fill this gap.
It would be a sharp correction but it is possible.
My stop loss is set at 18 dollars. A breakdown below this level destroys the current bullish structure.
2. Gap near 15 dollars
This gap has never been closed.
Fundamentally the company is weak so the scenario of a deeper correction is not impossible.
However the most likely scenario still suggests that this gap may remain open.
My Position
I currently hold PGNY in my portfolio.
My entry price is 16.40 dollars.
My stop loss is set at 18 dollars which is the level that would invalidate my bullish structure.
Summary
PGNY is in a mixed position.
Fundamentals are weak and valuation looks elevated.
Technicals are bullish with a trendline breakout supported by volume.
Short term price movement will likely include a correction toward 20 to 21.
A dip to 19 to close the gap is possible before any move higher.
If the technical setup holds targets are 45 and then 68.
Risks remain due to the open gaps at 18 to 19 and 15. A breakdown below 18 would signal a bearish reversal.
PGNY
PGNY Bullish moveSimply making HH and HL
based on the current tightly nitted channel it shows a good bullish path .
Entry @ 38
TP @ 45
SL 35

PGNY, a fascinating Buy/Invest setup. ( We trade carefully ) !PGNY may offer a great chance for buy/investment !
All details are described in the video. Please do not hesitate to ask questions if needed.
Hope this to be useful and wish you all the best.
Good luck.

PGNY, Best Case Scenario! We keep it on watch.PGNY can bring us a huge profit! It's major correction has been ended? Probably yes. ! Lest follow the analysis to see the details.
As shown on the chart , PGNY has beautifully completed 5 leg up wave from IPO to ATH . This all way up can be labeled as primary wave 1 . There is no doubt about completion of this long term up going wave. Do we have the completion of correction of the mentioned wave at the last bottom? Probably yes. Here we used " Probability" concept to show although low chance , there is still a possibility for primary wave 2 to go further down to 25 USD corresponding to 0.786 Fibonacci level of primary wave 1.
Lets consider completion of primary wave 2 at the last bottom corresponding to 0.618 Retracement level of the all the way up from IPO. In this best case scenario , PGNY has started long term primary degree wave 3 which can push the price up to 120 USD and even higher . In this case, PGNY has recently completed it's minor degree wave 1 of primary degree wave 3 ( There are some variations for wave degrees which we skip for now).
When wave 3 of 3 which is the most profitable wave is going to start? After completion of minor degree wave 2 which can be at 43, 40 or 37 USD corresponding to 0.5, 0.618 and 0.786 Fibo levels respectively. For now all this levels are possible.I give more chance to 40 and 37 prices considering the wave characteristics.
Please note, We are taking about possibilities not certainties . Therefore, first we need a strong bullish sign at proposed supports and second we have to set our stop loss carefully and objectively . If this best case scenario does not happen we can wait for 25 USD to make even more profit in long term.
Good luck every one.


PGNY at 50%NASDAQ:PGNY is a stock that I have been in for over a year. It is a rare case where I have a fundamental bias (rather than technical to start) as a friend clued me into it June 2020. The fundamental case for this company is that they offer fertility services and their "moat" is that already have many deals with Fortune 500 companies that offer fertility packages in compensation to workers to delay parenthood in favor of careers. With the research showing that the trend is continuing that women are delaying family in favor of career I believe this company is a strong hold for the coming decade.
It is now providing a technical setup with a short term risk defined entry. I have been waiting for such an opportunity after watching the last year's run.

Quick PGNY Trend AnalysisJust making support around the $55 mark. Also identified a descedning wedge pattern that could lead into an uptrend.

PGNY.NAS_Swim Trading VZ Breakout Trade_LongENTRY: 61.99
SL: 55.04
TP1: 66.61
TP2: 70.60
- ADX>20
- RSI<70 but >50. Uptrend still intact.
- MAs aligned.
- Possible hidden buying on 27 Jun 2021.
- Rebounded from pivot point on 28 Jun 2021.
- Strength meter shows weakness. Trade with caution or tighten stop loss in coming days.

PGNY,We have eagle eyes to see the opportunities! We are ready to catch perfect chances ! Keep PGNY on watch my friends.
PGNY has started a continuous progress from it's IPO and completed waves 1, 2 and 3 of a possible 5 up going waves cycle so far. It means that we are able to catch a new up going wave 5 after a possible correction of wave 4. These explanations are shown on the chart.
Correction may end at supposed retracement levels . For now all levels are valid. Later, we can further fine tune the possible buy zone based on internal structure of the upcoming correction.
We keep PGNY on watch and wait for an ideal setup to go long. PGNY can brings us profit however, it does not mean that we just close our eyes and jump into the position.
We always trade smartly.
Good luck my friends.

US Stock In Play: $PGNY (Progyny Inc)$PGNY rebounded back into its uptrend channel, closing the session at all time high with an intraday rally of +6.54% to $47.89. The strong closing of $PGNY reflects its inherent technical strength, on the Friday session where Wall Street and European markets closed in negative territory as concern over new lockdown measures.
The price action of $PGNY was put under the spotlight when a Bearish Gravestone Doji candlestick was printed on 14th December 2020 close, confluence with a high average volatility and sessional volume not witnessed since May 2020. The following two weeks of trading session successfully negated the signal, exhibited by further buying accumulation. Today’s rebound have also effectively identified its 20DMA as a reference to any potential weakness ahead.
At the current junction, it would be plausible to experience further uptick in price volatility relative to its price strength in $PGNY at a trading range within 10.35% in the upcoming.

Bullish price action in PGNYMinor patterns above a major breakout are generally very high probability patterns and among my favorite.
This is a long term hold

Winter is coming - Part 6: Ethereum vs BitcoinEvery year since 2015 ETHBTC was at a relative buy point around winter time - mostly in December. It's a strange cyclical pattern that keeps repeating for mysterious reasons. This year, I would argue, the ETHBTC ratio has the HIGHEST PROBABILITY of repeating this pattern of any other year in its history. I make this statement entirely based on technicals.
- We have a 5 year trendline supporting price
- Horizontal support from 2016
- Consistent cyclical tendency for the last 5 years
- ETH 2.0 (for me this is the least important, believe it or not... even if it may be the entire reason we could see a rally)
The first time I noticed this seasonal pattern was in November 2017. I converted all of my Bitcoin into Ethereum the same time I published the chart below:
In August this year, I published my view on Grayscale Trust's product, ETHE . You could find it here:

