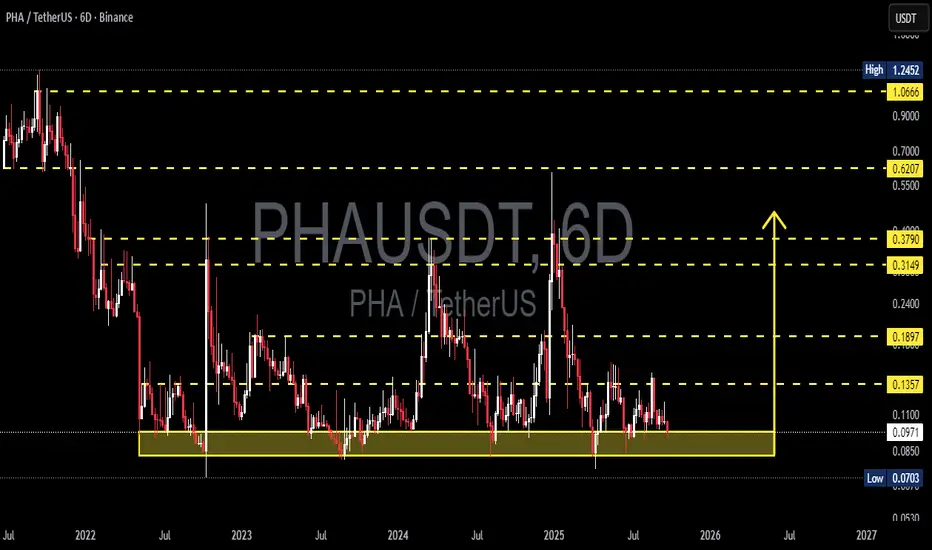
PHA/USDT – Multi-Year Accumulation at a Critical Demand Zone!
Overview:
PHA/USDT has been in a long downtrend since its 2021 peak. However, since mid-2022, price action has consistently formed a multi-year base around the 0.07 – 0.10 USDT demand zone (yellow box). This level has been tested several times, yet buyers continue to defend it, signaling strong accumulation interest.
Each dip into this zone has resulted in sharp rebounds toward the 0.30–0.38 region, though rallies have failed to sustain. This highlights that the market is still in a waiting phase, seeking a strong catalyst before confirming a major breakout.
---
Key Technical Levels
Primary Support (Demand Zone): 0.070 – 0.097
Step-by-Step Resistances:
0.1357 → first breakout confirmation level
0.1897 → psychological barrier and potential rejection zone
0.3149 – 0.3790 → strong mid-term resistance cluster
0.6207 → major resistance, previous heavy supply zone
1.0666 – 1.2452 → long-term bullish targets if a full market cycle develops
---
Pattern & Market Structure
Current Formation: Accumulation Range (0.07 – 0.10)
Price Action: Long lower wicks at support show repeated liquidity grabs and aggressive buyer re-entries.
Conclusion: Market is consolidating sideways, building a potential base for the next major trend.
---
Bullish Scenario
1. Trigger: A decisive 6D close above 0.1357 with strong volume.
2. Upside Targets:
Target 1 → 0.1897
Target 2 → 0.3149
Target 3 → 0.3790
With strong momentum, expansion toward 0.62 – 1.06 is possible.
3. Catalyst: A broader crypto market uptrend could fuel a breakout from this prolonged consolidation.
---
Bearish Scenario
1. Trigger: A 6D close below 0.0703 → breakdown of the multi-year demand zone.
2. Risk: Opens the door to new lows with potential panic selling.
3. Outcome: Such a breakdown often leads to a “capitulation bottom” before recovery.
---
Investor & Trader Perspective
Long-Term Investors: The 0.07–0.10 zone offers one of the best risk-reward opportunities for gradual accumulation, but patience and volatility tolerance are required.
Short-Term Traders: Range trading works well here → buy near demand, sell near 0.135–0.19 with tight risk management.
Trend Confirmation: Only a breakout above 0.1357 with volume validates a healthier bullish structure.
---
Conclusion
PHA is currently at one of the most critical turning points in its price history.
If the 0.07–0.10 demand zone continues to hold, it could serve as the launchpad for the next major rally.
But if it breaks down, PHA may face a deep bearish extension toward uncharted lows.
In short: PHA is standing at a crossroads — either the beginning of a new bullish chapter, or a descent into capitulation.
---
#PHA #PHAUSDT #CryptoAnalysis #Altcoin #PriceAction #SupportResistance #CryptoTrading #Accumulation #BreakoutSetup #RiskManagement
Phalasignals
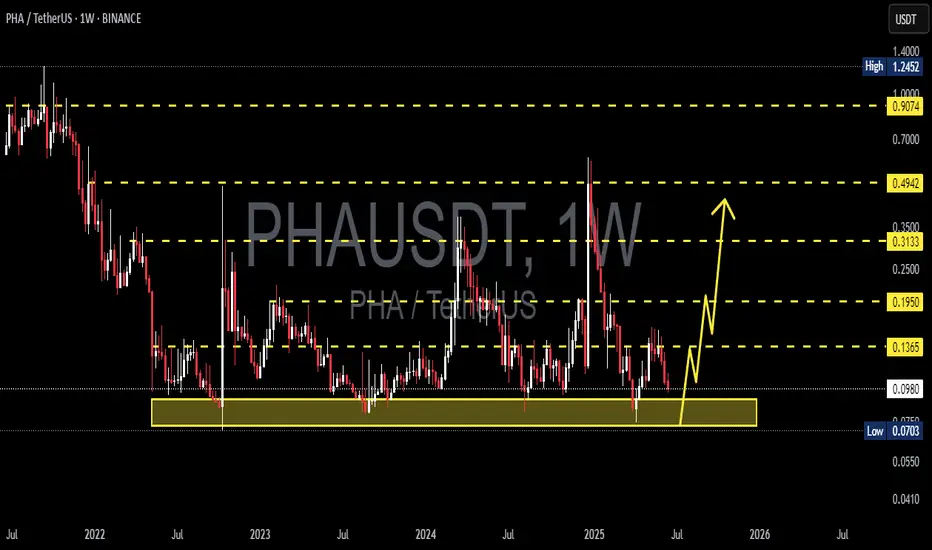
PHAUSDT at Make-or-Break Zone Is This the Calm Before the Storm?📍 Chart Overview (6D Timeframe – Binance)
PHA/USDT is currently retesting a major historical demand zone between $0.0703 - $0.0986, highlighted by the yellow box. This zone has acted as a strong base since mid-2022, repeatedly absorbing selling pressure and bouncing the price back up.
Over the past two years, this accumulation zone has consistently held, forming a classic sideways structure, typically seen before a major breakout. However, the inability to break through the upper resistances suggests persistent bearish pressure.
Now, the market is nearing a make-or-break moment that could lead to a decisive move in either direction.
---
🔎 Pattern Identified: "Extended Accumulation + Volatility Compression"
The price is trading inside a long-term accumulation range, indicating that smart money might be quietly buying.
We're seeing signs of volatility compression, a precursor to breakout volatility.
Repeated lower wicks near the demand zone show strong buying interest on dips.
This setup may produce a “spring” scenario, where a false breakdown triggers a strong reversal rally.
---
🟢 Bullish Scenario (Rejection From Demand Zone):
If the price continues to hold above $0.0986 and forms a higher low structure:
Bullish Targets:
1. $0.1357 – Minor historical resistance
2. $0.1897 – Key horizontal resistance
3. $0.3790 – Mid-range breakout target
4. $1.0666 – Long-term retracement target
Bullish Confirmation Signals: ✅ Break and daily close above $0.1357
✅ Increased volume on breakout
✅ Bullish candle structure near support
---
🔴 Bearish Scenario (Breakdown of Accumulation Zone):
If the price fails to hold $0.0703 – $0.0986 and breaks down with strong volume:
Bearish Targets:
1. $0.0590 – Psychological support
2. Below $0.0500 – Open downside
3. Trend shifts into bearish continuation structure
Bearish Confirmation Signals: ❌ Strong close below $0.0703
❌ Volume spike on red candle
❌ Lack of bullish response
---
🧠 Strategic Notes for Traders & Investors:
This zone offers a low-risk, high-reward opportunity for speculative positioning, with a tight stop-loss below $0.0703.
Due to prolonged compression, any breakout (up or down) could be explosive.
Be cautious of false breakouts. Wait for confirmation via volume and price action.
---
🗣️ Conclusion:
PHA/USDT is sitting at a technical inflection point that has historically triggered strong market reactions. After two years of coiling price action, this extended accumulation phase is nearing its resolution.
What happens next will likely define the long-term trajectory for this asset. Don’t sleep on this setup — whether you’re bullish or bearish, this is where attention should be focused.
#PHAUSDT #PHA #CryptoAnalysis #AltcoinSetup #TechnicalAnalysis #BreakoutWatch #AccumulationZone #StrongSupport #CryptoTrading

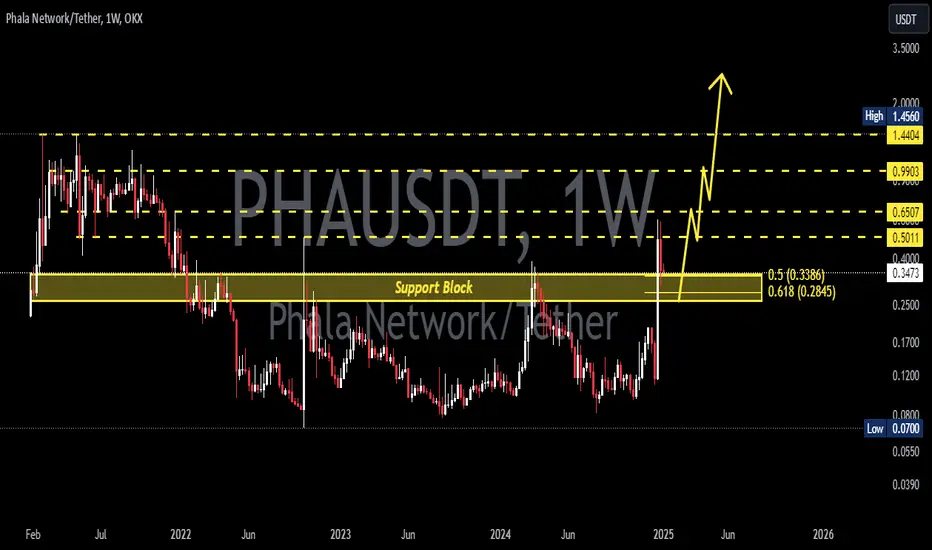
PHAUSDT 1W AnalysisPHA ~ 1W Analysis
#PHA Buy back on retest of this support block with short term target of at least 20%+ from this support.
PHAUSDT 1D AnalysisPHA ~ 1D Analysis
#PHA Buy when re -testing this support block with a short -term target of at least 10%+ from here.

PHAUSDT 1WPHA ~ 1W Analysis
#PHA Buy back gradually from here with a short -term target of at least 20%+.
This is the lowest support for now.

PHAUSDT 1WPHA Update ~ 1W
#PHA So far it still maintains its bullish structure. This is the support block of the golden ratio,. Buy in stages. with a minimum target of 20%+
PHAUSDTPHA ~ 1W
#PHA So far have continued to maintain this support block. If you still have Conviction on this coin,. This support block would be a very good buy for now. With a minimum target 20%++

PHAUSDTPHA ~ 1W
#PHA Maybe if you are interested in this coin,. you need to pay attention to this key Support,. Last time the price bounced off this key support. at least for a minimum 20%++ profit.

Phala Network (PHA) completed a setup for upto 20% pumpHi dear friends, hope you are well and welcome to the new update on Phala Network (PHA) coin.
Recently we caught almost 20% pump of PHA as below:
Now on a 4-hr time frame, PHA has formed a bullish BAT move for the next pump.
Note: Above idea is for educational purpose only. It is advised to diversify and strictly follow the stop loss, and don't get stuck with trade.


Phala Network (PHA) formed bullish Gartley for upto 58.50% moveHi dear friends, hope you are well, and welcome to the new update on Phala Network ( PHA ) coin with the US Dollar pair.
First of all congratulations to you all, for another such wonderful long-term trade, which is completed now. And it has rallied more than 530%
Now on a 4-hr time frame, PHA is about to complete the final leg of a bullish Gartley pattern.
Note: Above idea is for educational purpose only. It is advised to diversify and strictly follow the stop loss, and don't get stuck with trade

PHAUSDT up +600% in three days! Where to buy next?*** ***
For this particular analysis on Phala Network we are using the PHAUSDT symbol on the OKX exchange.
*** ***
The idea is on the 1D time-frame where PHA is having an incredible stretch rising +600% since its Thursday bottom! This massive pump broke above its 1D MA50 (blue trend-line), 1D MA200 (orange trend-line) and 1W MA50 (red trend-line) in just two days! With the 1D RSI vastly overbought, the questions arises: Where can we buy next?
Naturally, a strong pull-back is expected on Phala Network based primarily on short-term profit-taking. The strongest candidate will be the 0.5 - 0.382 Fibonacci retracement zone (counting from the September 16 2021 High), which has been the High Volatility Zone from late January to early May 2022. If that fails, the final buy entry can be made on the 0.618 Fib (orange lines) of this recent pump move. Additionally when/ if the RSI hits the 30.000 level. In either case, the next target should be the 0.786 Fib and the 2021 High itself.
-------------------------------------------------------------------------------
** Please LIKE 👍, SUBSCRIBE ✅, SHARE 🙌 and COMMENT ✍ if you enjoy this idea! Also share your ideas and charts in the comments section below! This is best way to keep it relevant, support me, keep the content here free and allow the idea to reach as many people as possible. **
-------------------------------------------------------------------------------
You may also TELL ME 🙋♀️🙋♂️ in the comments section which symbol you want me to analyze next and on which time-frame. The one with the most posts will be published tomorrow! 👏🎁
-------------------------------------------------------------------------------
👇 👇 👇 👇 👇 👇
💸💸💸💸💸💸
👇 👇 👇 👇 👇 👇
