#PHB/USDT is rejecting from the Diagonal Trendline#PHB
The price is moving within an ascending channel on the 1-hour timeframe and is adhering to it well. It is poised to break out strongly and retest the channel.
We have a downtrend line on the RSI indicator that is about to break and retest, which supports the upward move.
There is a key support zone in green at the price of 0.482, representing a strong support point.
We have a trend of consolidation above the 100-period moving average.
Entry price: 0.494
First target: 0.513
Second target: 0.535
Third target: 0.563
Don't forget a simple point: capital management.
Upon reaching the first target, save some money and then change your stop-loss order to an entry order.
For any questions, please leave a comment.
Thank you.
PHB

#PHB/USDT#PHB
The price is moving within a descending channel on the 1-hour frame and is expected to break and continue upward.
We have a trend to stabilize above the 100 moving average once again.
We have a downtrend on the RSI indicator that supports the upward move with a breakout.
We have a support area at the lower boundary of the channel at 0.652, which acts as strong support from which the price can rebound.
Entry price: 0.666
First target: 0.692
Second target: 0.712
Third target: 0.740

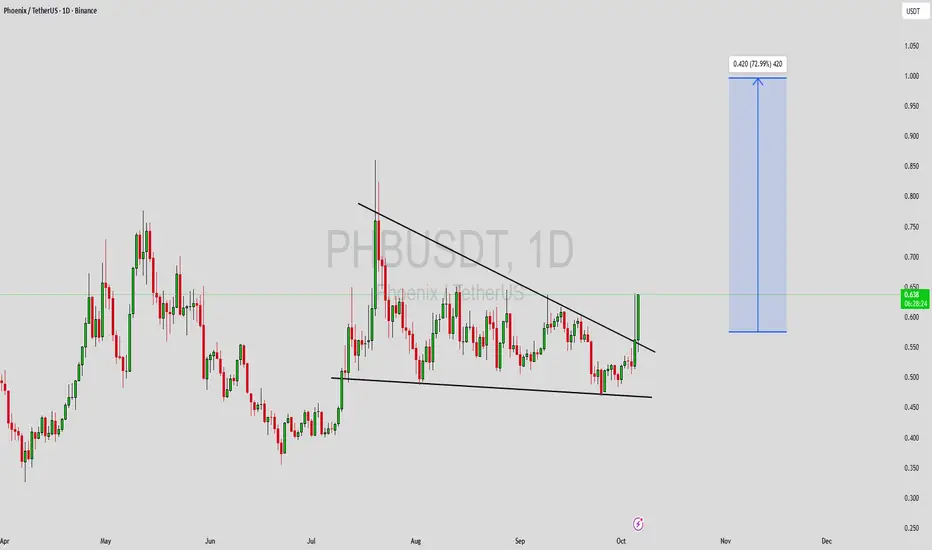
PHBUSDT Forming Falling WedgePHBUSDT is currently displaying a classic falling wedge pattern on the chart, a strong bullish signal that often indicates a trend reversal. After a prolonged consolidation phase within tightening support and resistance lines, the price seems to be preparing for a breakout to the upside. The good trading volume confirms that accumulation is underway, and buyers are gradually gaining control over the market. Once the breakout is confirmed, the momentum could push PHBUSDT toward significant upside targets, potentially delivering gains of around 60% to 70%.
The falling wedge structure typically forms when bearish momentum weakens, and bulls begin to step in. In the case of PHBUSDT, this scenario appears to be playing out as the coin shows higher lows and stable buying interest. A breakout above the resistance trendline could spark a strong rally, especially if the broader crypto market remains supportive. The technical outlook aligns with improving sentiment, suggesting that this setup could attract both short-term traders and long-term investors.
Investor confidence in PHBUSDT has been gradually improving as more participants recognize the potential for a bullish reversal. The current price zone could represent an ideal accumulation area before a major move upward. If volume continues to increase during the breakout, the momentum could extend further, confirming a shift from a bearish to a bullish phase.
✅ Show your support by hitting the like button and
✅ Leaving a comment below! (What is You opinion about this Coin)
Your feedback and engagement keep me inspired to share more insightful market analysis with you!
PHBUSDT UPDATE#PHB
UPDATE
PHB Technical Setup
Pattern: Bullish falling wedge pattern
Current Price: $0.95
Target Price: $1.48
Target % Gain: 55.97%
AMEX:PHB is breaking out of a falling wedge pattern on the 1D timeframe. Current price is $0.95 with a target near $1.48, showing about 56% potential upside. The breakout suggests renewed bullish momentum and potential continuation to the upside. Always use proper risk management.
Time Frame: 1D
Risk Management Tip: Always use proper risk management.

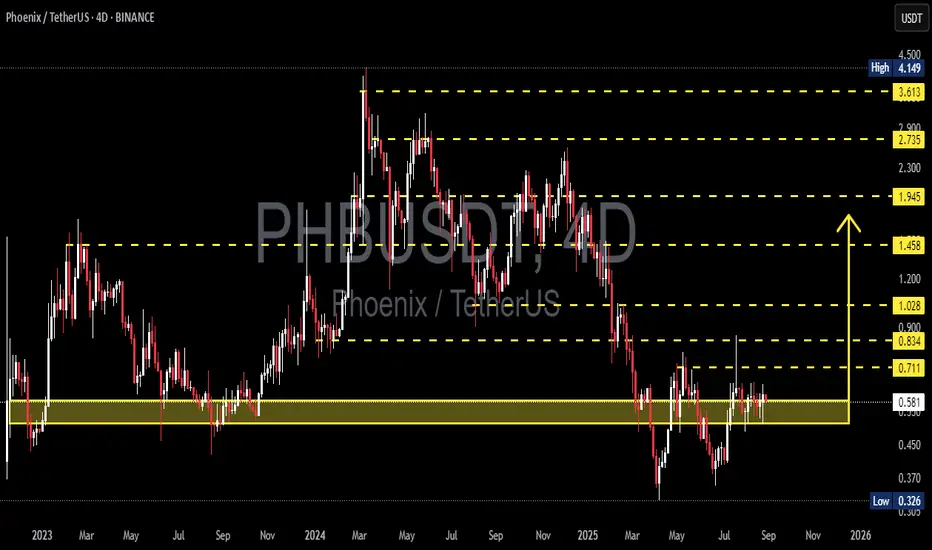
PHB/USDT — Holding the Demand Zone, Awaiting Major Breakout?Currently, PHB/USDT is consolidating within a critical demand zone at 0.52 – 0.62. This area has repeatedly acted as a strong floor since 2023, absorbing heavy sell-offs and showing signs of accumulation.
The market structure suggests that PHB is forming a range-base accumulation pattern, with 0.711 as the immediate breakout trigger. The next move will decide whether PHB transitions into a bullish expansion or breaks down into deeper bearish territory.
---
🔹 Structure & Price Pattern
Demand zone (0.52 – 0.62): A key support level where buyers continue to defend strongly.
Cluster highs near 0.711: A liquidity level and breakout confirmation point.
Layered resistances above: 0.834 → 1.028 → 1.458 → 1.945, serving as potential take-profit zones.
Deep wicks to 0.326 in the past: Indicate capitulation events, followed by strong reclaim — a bullish sign as long as demand holds.
---
🟢 Bullish Scenario
If PHB closes above 0.711 (4D candle) with volume confirmation, a breakout rally may follow.
Upside targets:
1. 0.834 (minor resistance)
2. 1.028 (psychological resistance)
3. 1.458 (major resistance, strong take-profit area)
A confirmed breakout signals the end of long consolidation and a possible start of a bullish phase.
---
🔴 Bearish Scenario
Failure to break 0.60–0.62 / 0.711 may push PHB back toward 0.55 – 0.52.
If 0.52 breaks on a 4D close, PHB risks a deeper drop toward:
1. 0.50
2. 0.45
3. 0.37 – 0.326 (historical low)
A breakdown below 0.52 would confirm that buyers lost control, re-opening a bearish trend.
---
📌 Trading Strategy & Risk Management
Swing traders: Consider long entries near 0.55–0.58 with targets at 0.711+.
Breakout traders: Wait for a confirmed close above 0.711 before entering, targeting resistances above.
Stop loss: Below 0.52 to protect against deeper downside.
Maintain a Risk:Reward ratio ≥ 1:2 and use 4D candle closes for confirmation to avoid fakeouts.
---
✨ Conclusion
PHB is at a make-or-break level:
Holding above 0.52–0.62 keeps bullish momentum alive, with breakout potential toward 0.834–1.458.
Losing this demand zone could open the path back to 0.37–0.326 lows.
This is a critical crossroads — a breakout could mark the start of a new bullish cycle, while a breakdown signals renewed weakness.
#PHBUSDT #PHB #Phoenix #CryptoAnalysis #PriceAction #AltcoinAnalysis #CryptoTrading #SupportResistance #DemandZone #Breakout #BullishScenario #BearishScenario #SwingTrading
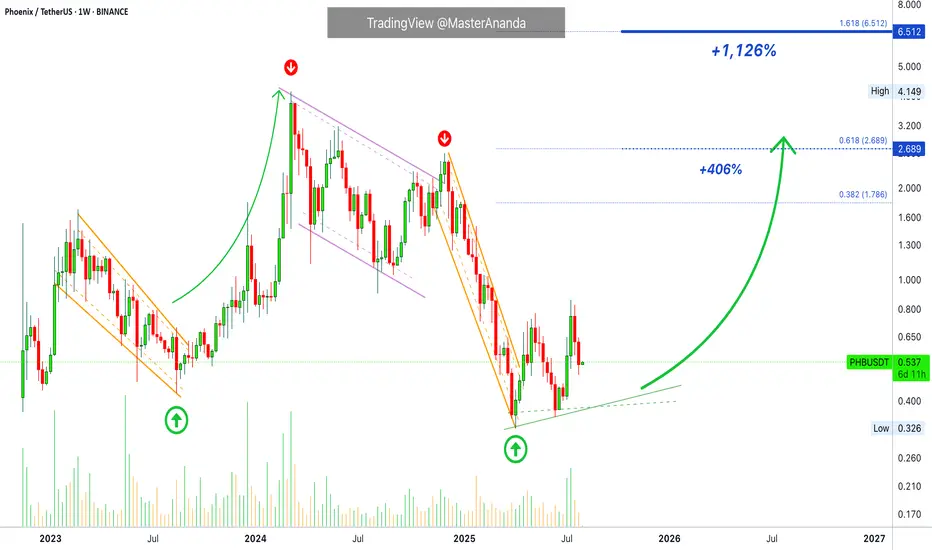
Phoenix Recovers · Easy 1,126% Target @ $6.5 Phoenix is just coming out of a major downtrend. After the main low there was a higher low and rising buy volume. Whenever there is a down wave that ends in strong buying, we know the market is about to turn, we have proof here.
PHBUSDT produced a down move in February 2023. Prices moved lower and a major low happened in August 2023, trading volume started to rise. The rise in volume predicted a change of trend. Then prices also started to rise and we ended up with a bullish wave.
PHBUSDT produced a down move in March 2024, this was a long drawn out correction. The market was moving lower with lower highs, the main one showing up December 2024 and then a major crash. A major low showed up April 2025 and now we are seeing rising volume, the signal that predicted an advance last time. With rising volume and a higher low, we can expect prices to rise next.
And this is it. Phoenix is trading at bottom prices but is slowly starting to recover. Strong bullish action is the next logical step. The market will grow. Crypto will grow. The altcoins are bullish now.
Namaste.
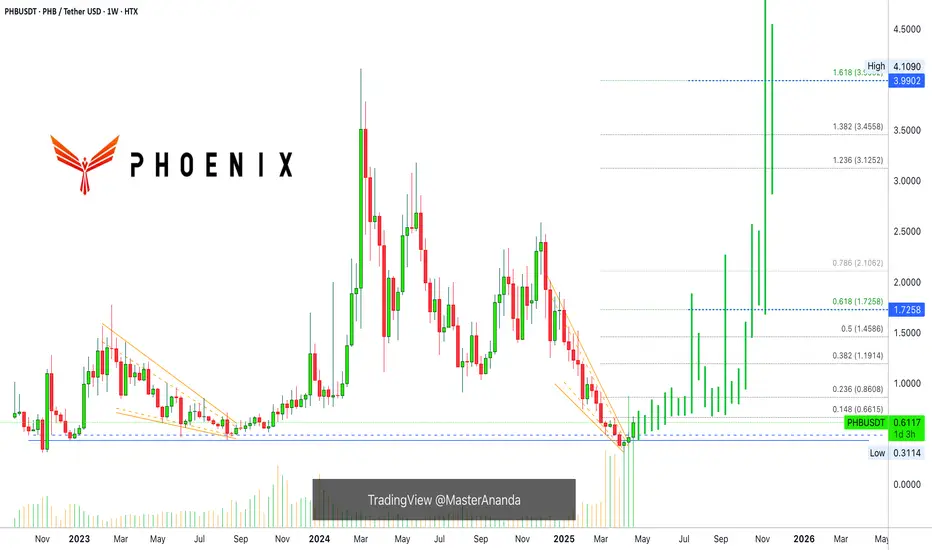
PHBUSDT Bounces from the Golden Pocket?🧠 Market Context & General Analysis
Phoenix (PHB) is currently at a critical juncture in its market structure. After a prolonged downtrend from its 2024 highs, price has now reacted strongly off a key Fibonacci Golden Pocket retracement zone (0.5–0.618), which also aligns with a historically respected demand area.
This level is not just a technical formality – it’s a zone where smart money typically enters, and historically it has provided reliable bullish reversals.
---
📍 Key Zones to Watch
🟨 Demand / Accumulation Zone:
0.549 – 0.608 → Fibonacci 0.5–0.618 + Historical support
⤷ Has been retested and shows early signs of a bullish reaction.
📈 Layered Resistance Zones (Fibonacci Targets):
0.834 → Minor resistance + potential double bottom neckline
1.028 → Previous structural resistance
1.200 → Psychological round level
1.458 → Key Fibonacci extension
1.945 – 2.735 – 3.648 → Mid/long-term Fibonacci targets
4.149 → All-Time High (ATH) on this chart
🔻 Major Support if Breakdown Occurs:
0.326 → Historical bottom / last line of defense
---
🧩 Pattern Formation: What’s Emerging on the Chart?
🔄 Potential Double Bottom:
Price structure is showing signs of a potential reversal formation in the form of a double bottom near the 0.55–0.61 zone. A confirmed breakout above the neckline at 0.834 would validate this bullish setup.
📉 Broken Downtrend Channel?:
PHB was previously trading in a downtrend channel. The current move suggests a possible breakout and the beginning of a trend shift or accumulation phase.
---
✅ Bullish Scenario: The Rise of the Phoenix
If the price holds above 0.608 and confirms with a strong breakout above 0.834, a bullish trend reversal could follow.
🚀 Short-term targets: 0.834 → 1.028
🔥 Mid-term targets: 1.200 → 1.458 → 1.945
🌕 Long-term potential: 2.735 – 3.648 – 4.149
Validation Key: Break above 0.834 with strong volume
Bullish confirmation candle: Bullish engulfing / Marubozu on 4D or Daily
---
⚠️ Bearish Scenario: Breakdown Threat Looms
If the price fails to hold the 0.549 support level, we could see a continuation of the downtrend, potentially targeting:
💀 First stop: 0.45 – 0.40 zone
🧊 Extreme case: Drop toward 0.326 (historical low)
Breakdown Confirmation:
Daily or 4D close below 0.549
Followed by selling volume and no quick recovery
---
🎯 Potential Trading Strategies (Not Financial Advice):
🟢 Bullish Swing Entry: Buy zone at 0.55–0.61
⤷ Targets: 0.834 – 1.028
⤷ Stop-loss: Below 0.52 (close basis)
🔴 Breakout Trade: Enter on breakout above 0.834 with volume
⤷ Targets: 1.200 – 1.945
⤷ Stop-loss: Below 0.80
🔵 Bearish Play / Re-entry: Short if break below 0.549
⤷ Targets: 0.40 – 0.326
⤷ Stop-loss: Above 0.60
---
🧲 Final Thoughts
PHBUSDT is in a make-or-break zone, sitting atop the Golden Pocket and showing early bullish momentum. If buyers step in and maintain the momentum, we could be witnessing the early stages of a significant market reversal.
However, failure to hold the key support at 0.549 would likely shift the sentiment back into bearish territory. Volume and confirmation candles will be the deciding factor for the trend’s next direction.
#PHBUSDT #PhoenixCrypto #AltcoinReversal #GoldenPocket #CryptoTA
#FibonacciLevels #BullishSetup #BearishBreakdown #ChartPatterns

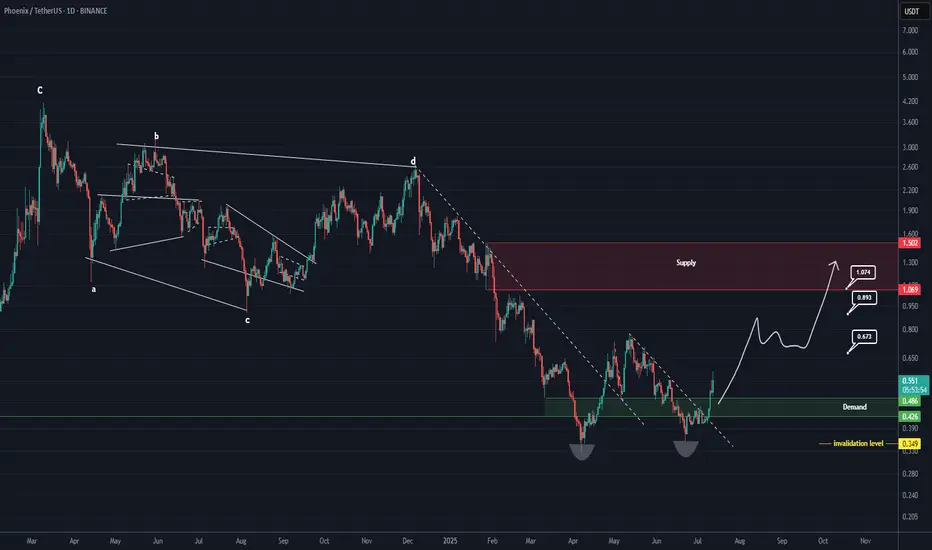
PHB Looks Bullish (1D)It appears that wave E has ended after a long consolidation and the formation of a double bottom. A key trigger line has been broken, and the price has reclaimed the flip zone (marked in green).
As long as the green zone holds, the price can move toward the targets and the red box.
The targets are marked on the chart.
A daily candle closing below the invalidation level will invalidate this analysis.
For risk management, please don't forget stop loss and capital management
Comment if you have any questions
Thank You
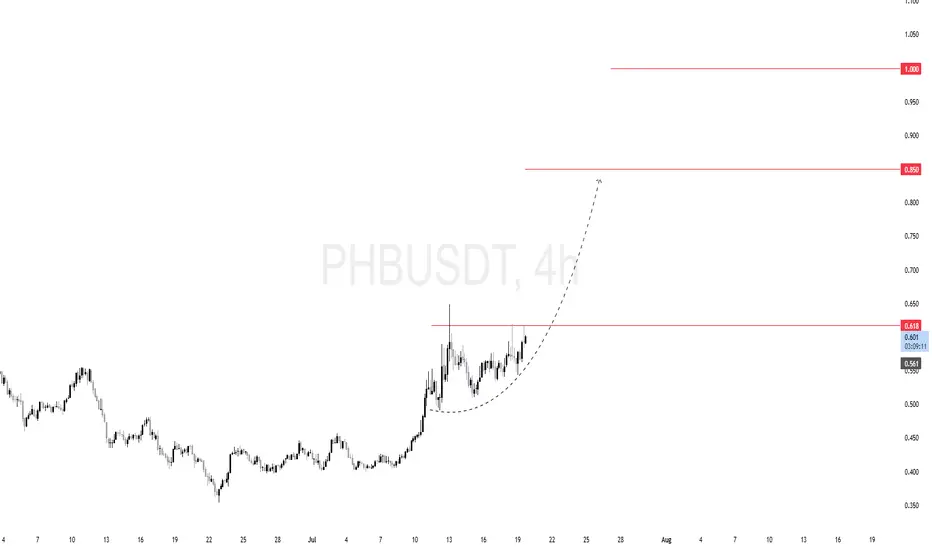
$PHB (PHBUSDT) 4HPrice spent several sessions consolidating below the $0.618 resistance zone. This horizontal level has been tested multiple times, building up buy-side liquidity above it.
We're seeing a rounded base formation — a classic bullish continuation pattern. It signals strong demand and positioning by smart money.
If $0.618 gets cleared with volume, we can anticipate rapid upside movement with the following key targets:
🎯 First target: $0.85
🎯 Final target: $1.00 (psychological level and historical supply)
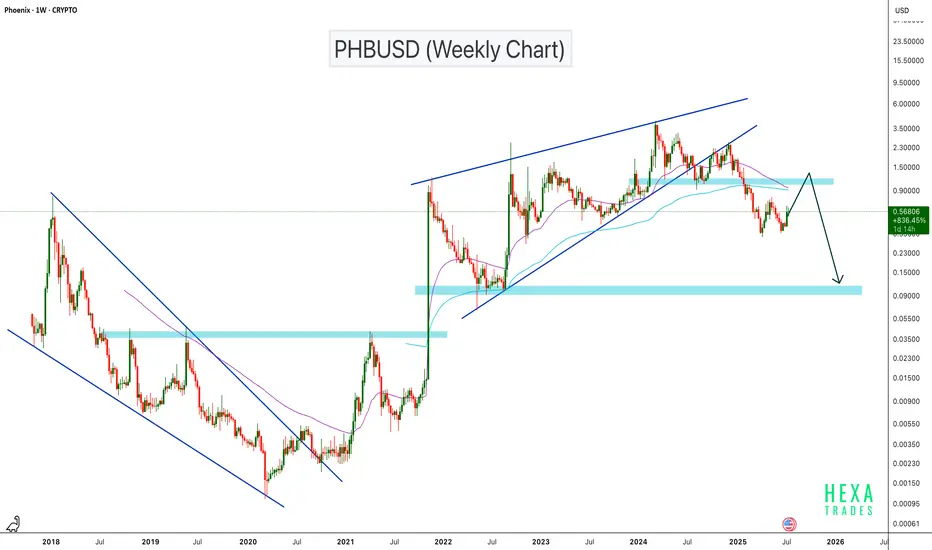
PHBUSD Breakdown: Rising Wedge Signals Bearish ContinuationPHBUSD has broken down from a rising wedge pattern on the weekly chart, signaling a potential trend reversal. The price is currently attempting a retest of the previous support zone at the $1.00–$1.20 level, which is now likely to act as resistance. If this retest fails, it could confirm a bearish continuation setup, with the next key support zone around $0.10. This level has previously acted as a major base and could serve as the next downside target
BINANCE:PHBUSDT AMEX:PHB
PHBUSDT 4D AnalysisPHB ~ 4D Analysis
#PHB This trade is very High risk, Buy gradually from here if you still have confidence in this coin with a short term target of at least 15%+ from here.
PHBUSDT 3D Analysis PHB ~ 3D Analysis
#PHB Buy from here if you still have confidence in this coin with a short term target of at least 15%++

Phoenix Global Massive Growth Ahead Bullish Bias ConfirmedLast week produced the highest volume ever, extremely high, after a very strong bottom candle and signal. Phoenix Global is set to enter a major bullish trend and bull market cycle. The bottom is in.
Good morning my fellow Cryptocurrency trader, this is a great and interesting chart.
The best signals come from the candles, the best support from the volume indicator, here we have both working in unison. Great.
A doji is the candle that produced the correction low. The session ended green and with high volume. The doji is a reversal signal when confirmation comes and confirmation is in.
The following candles after 7-April are high volume candles, extremely high and full green. That's it. These past three weeks confirmed two things: (1) The bottom is in and (2) a new bullish wave will develop.
A new uptrend can last months or it can even go for years. So it is very interesting to be able to find these charts while they are trading at bottom prices. Joining the market at this time, buying and holding, can be life changing, truly. You will have your confirmation in a matter of weeks. It will take only 4-6 weeks for everything Altcoin to trade 300% higher. And that will only be the start.
» PHBUSDT activated its two strongest support levels, that is August 2023 and November 2022. The 7-April low produced a technical double-bottom and a factual long-term higher low. Another signal in support of massive growth comes next be ready and prepared.
Thank you for reading.
Namaste.
PHBUSDT 6DPHB ~ 6D Analysis
#PHB Buy gradually from here with a short -term target of at least 20%+
The reason, this is the lowest support, before the price rises high.

PHBUSDT 3DPHB ~ 3D
#PHB for now continues to maintain this Support block,. Buy gradually on this support,. with a minimum target of 20%++

PHB looks bullishIt looks like the PHB is forming a triangle.
We are now in wave E of this triangle.
The green range is a suitable support where we can look for buy/long positions.
The targets are marked on the chart.
Closing a daily candle below the invalidation level will violate this analysis.
For risk management, please don't forget stop loss and capital management
When we reach the first target, save some profit and then change the stop to entry
Comment if you have any questions
Thank You

PHBUSDTPHB ~ 1W
#PHB Forming a bullish pattern on the 1W Time frame. If you have Conviction on this coin,. Wait for the resistance line of this pattern to be successfully broken through with strong volume. after that buy in stages. with a minimum target of 20%++

PHB LongPHB Long Setup
Reason:
Breakout of Accumulation Zone.
Breakout of Trendline.
Strong Bullish momentum with volume.
Expecting a bullish impulsive move soon.
All Technical Indicator suggesting a Solid Breakout.
Regard, The Crypto Panda
BINANCE:PHBUSDT.P
BYBIT:PHBUSDT.P
BINANCE:PHBUSDT
MEXC:PHBUSDT.P

Phb Getting Ready For Recovery phb Breaking Long Consolidation Expecting Successful Breakout After Successful Breakout My 1st Target Will Be Around 3$ Almost (43-44%) & My Final Target Will Be Recent High 3.90-4$
Over All Expecting 2x Bullish Wave After Successful Breakout

PHB Looks BullishThe PHB has finished a major correction ABC.
It is now in a bullish phase. The PHB has just reached a supply limit.
Given the good news that has been released for the AI space, the bullish movement is expected to continue.
The best place to rebuy is the green range. If PHB returns to the green range, we will look for buy/long positions.
The targets are inserted on the image.
Closing a daily candle below the invalidation level will violate the analysis.
For risk management, please don't forget stop loss and capital management
When we reach the first target, save some profit and then change the stop to entry
Comment if you have any questions
Thank You

PHBUSDT (Phoenix) Updated till 25-09-24PHBUSDT (Phoenix) Daily timeframe range. its moving steadily for now. not far away from 1.962 some bag holders holding there. if those can get cleared we can see a clean pass. recent retrace point at 1.506 which needs to hold for further move.

PHB BUY SIGNAL Trend indicator has flipped bullish
Buy signal active
Keep an eye on this one
AI has seen resurgence in the stock market through investments from big corp

PHB Technical AnalysisHello everyone, I’m Cryptorphic.
For the past seven years, I’ve been sharing insightful charts and analysis.
Follow me for:
~ Unbiased analyses on trending altcoins.
~ Identifying altcoins with 10x-50x potential.
~ Futures trade setups.
~ Daily updates on Bitcoin and Ethereum.
~ High time frame (HTF) market bottom and top calls.
~ Short-term market movements.
~ Charts supported by critical fundamentals.
Now, let’s dive into this chart analysis:
PHB/USDT is currently trading within a descending triangle pattern, with the price approaching a critical support zone. The support zone between $1.380 to $1.550 has provided strong buying pressure, preventing further declines.
A bounce from this support area could indicate a potential reversal.
- Support/Entry: $1.380 to $1.550.
- Primary Resistance: 50 EMA at $1.867.
- Invalidation point: A breakdown and close below the support level.
DYOR, NFA.
Please hit the like button to support my content and share your thoughts in the comment section. Feel free to request any chart analysis you’d like to see!
Thank you!
#PEACE
