#PHB/USDT is rejecting from the Diagonal Trendline#PHB
The price is moving within an ascending channel on the 1-hour timeframe and is adhering to it well. It is poised to break out strongly and retest the channel.
We have a downtrend line on the RSI indicator that is about to break and retest, which supports the upward move.
There is a key support zone in green at the price of 0.482, representing a strong support point.
We have a trend of consolidation above the 100-period moving average.
Entry price: 0.494
First target: 0.513
Second target: 0.535
Third target: 0.563
Don't forget a simple point: capital management.
Upon reaching the first target, save some money and then change your stop-loss order to an entry order.
For any questions, please leave a comment.
Thank you.
PHBBTC

#PHB/USDT#PHB
The price is moving within a descending channel on the 1-hour frame and is expected to break and continue upward.
We have a trend to stabilize above the 100 moving average once again.
We have a downtrend on the RSI indicator that supports the upward move with a breakout.
We have a support area at the lower boundary of the channel at 0.652, which acts as strong support from which the price can rebound.
Entry price: 0.666
First target: 0.692
Second target: 0.712
Third target: 0.740

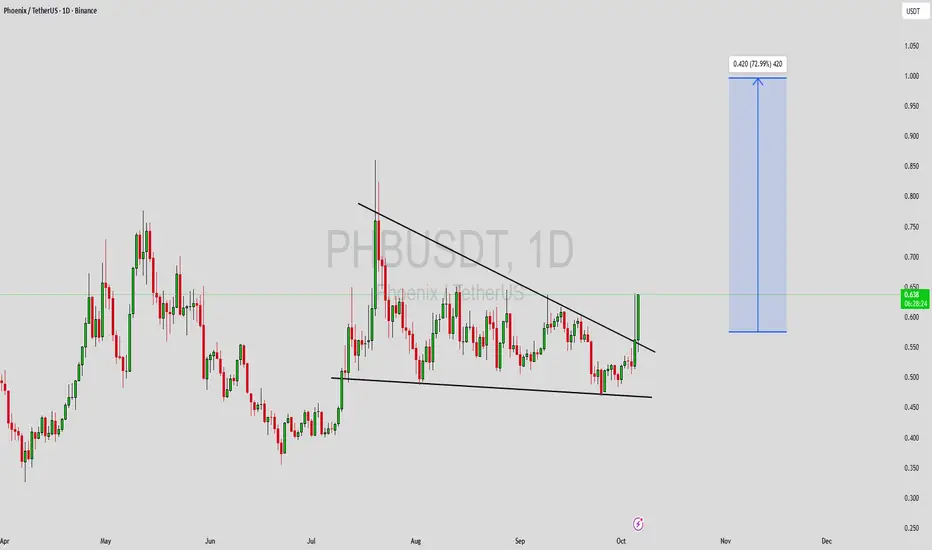
PHBUSDT Forming Falling WedgePHBUSDT is currently displaying a classic falling wedge pattern on the chart, a strong bullish signal that often indicates a trend reversal. After a prolonged consolidation phase within tightening support and resistance lines, the price seems to be preparing for a breakout to the upside. The good trading volume confirms that accumulation is underway, and buyers are gradually gaining control over the market. Once the breakout is confirmed, the momentum could push PHBUSDT toward significant upside targets, potentially delivering gains of around 60% to 70%.
The falling wedge structure typically forms when bearish momentum weakens, and bulls begin to step in. In the case of PHBUSDT, this scenario appears to be playing out as the coin shows higher lows and stable buying interest. A breakout above the resistance trendline could spark a strong rally, especially if the broader crypto market remains supportive. The technical outlook aligns with improving sentiment, suggesting that this setup could attract both short-term traders and long-term investors.
Investor confidence in PHBUSDT has been gradually improving as more participants recognize the potential for a bullish reversal. The current price zone could represent an ideal accumulation area before a major move upward. If volume continues to increase during the breakout, the momentum could extend further, confirming a shift from a bearish to a bullish phase.
✅ Show your support by hitting the like button and
✅ Leaving a comment below! (What is You opinion about this Coin)
Your feedback and engagement keep me inspired to share more insightful market analysis with you!
PHBUSDT UPDATE#PHB
UPDATE
PHB Technical Setup
Pattern: Bullish falling wedge pattern
Current Price: $0.95
Target Price: $1.48
Target % Gain: 55.97%
AMEX:PHB is breaking out of a falling wedge pattern on the 1D timeframe. Current price is $0.95 with a target near $1.48, showing about 56% potential upside. The breakout suggests renewed bullish momentum and potential continuation to the upside. Always use proper risk management.
Time Frame: 1D
Risk Management Tip: Always use proper risk management.

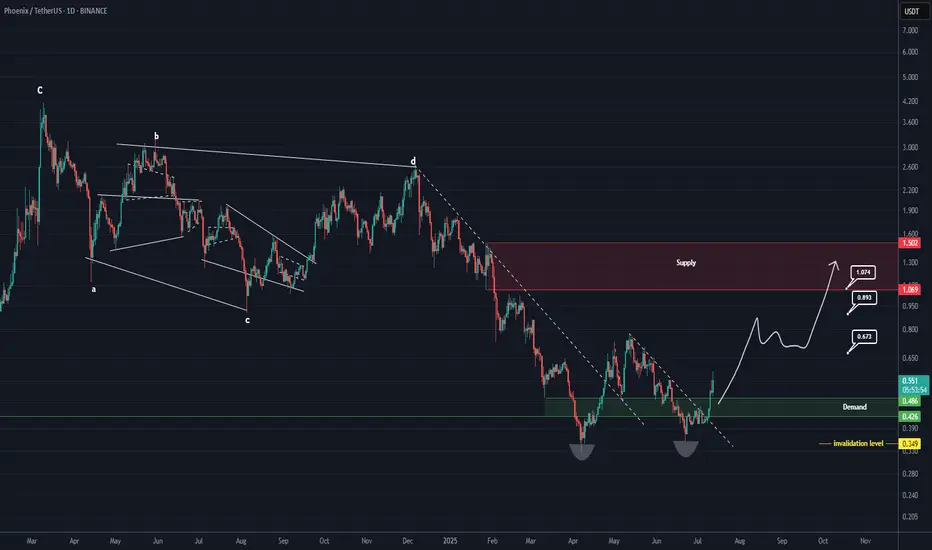
PHB Looks Bullish (1D)It appears that wave E has ended after a long consolidation and the formation of a double bottom. A key trigger line has been broken, and the price has reclaimed the flip zone (marked in green).
As long as the green zone holds, the price can move toward the targets and the red box.
The targets are marked on the chart.
A daily candle closing below the invalidation level will invalidate this analysis.
For risk management, please don't forget stop loss and capital management
Comment if you have any questions
Thank You
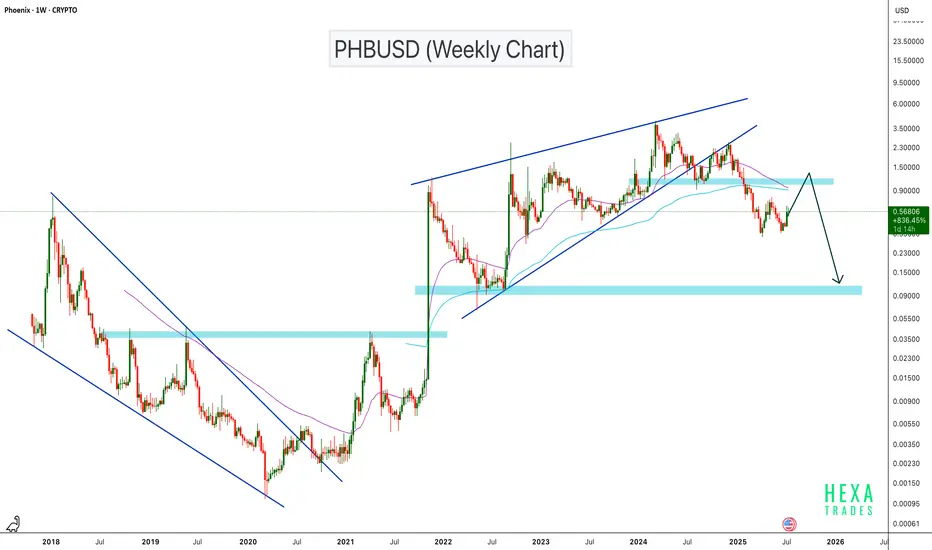
PHBUSD Breakdown: Rising Wedge Signals Bearish ContinuationPHBUSD has broken down from a rising wedge pattern on the weekly chart, signaling a potential trend reversal. The price is currently attempting a retest of the previous support zone at the $1.00–$1.20 level, which is now likely to act as resistance. If this retest fails, it could confirm a bearish continuation setup, with the next key support zone around $0.10. This level has previously acted as a major base and could serve as the next downside target
BINANCE:PHBUSDT AMEX:PHB
PHB looks bullishIt looks like the PHB is forming a triangle.
We are now in wave E of this triangle.
The green range is a suitable support where we can look for buy/long positions.
The targets are marked on the chart.
Closing a daily candle below the invalidation level will violate this analysis.
For risk management, please don't forget stop loss and capital management
When we reach the first target, save some profit and then change the stop to entry
Comment if you have any questions
Thank You

PHB Looks BullishThe PHB has finished a major correction ABC.
It is now in a bullish phase. The PHB has just reached a supply limit.
Given the good news that has been released for the AI space, the bullish movement is expected to continue.
The best place to rebuy is the green range. If PHB returns to the green range, we will look for buy/long positions.
The targets are inserted on the image.
Closing a daily candle below the invalidation level will violate the analysis.
For risk management, please don't forget stop loss and capital management
When we reach the first target, save some profit and then change the stop to entry
Comment if you have any questions
Thank You

PHB buy setupThe large structure of the PHB is a bear. But recently a bullish iCH has been formed on the chart and the price is constantly making higher Hs.
It is expected that the price will move towards the targets by meeting the demand.
The targets are clear on the chart.
Closing a 4-hour candle below the invalidation level will violate the analysis.
Note that the financial market is risky, so:
Do not enter any position without confirmation and trigger.
Do not enter a position without setting a stop.
Do not enter a position without capital management.
When we reach the first TP, save some profit and try to move the stop continuously in the direction of your profit.
If you have any comments please post them, comments will help us improve our performance
Thanks

PHB looks bearishPHB appears to be involved in an ABC correction.
Now it looks like the inside of wave B and wave B looks like a triangle.
The red range of supply is the best place for a sell/short position.
The targets are clear on the chart
Closing a daily candle above the invalidation level will violate the analysis.
For risk management, please don't forget stop loss and capital management
When we reach the first target, save some profit and then change the stop to entry
Comment if you have any questions
Thank You

PHB ANALYSIS (1W)Before anything, pay attention to the time frame. The time frame is big and time consuming.
To buy, we need a pullback and get a trigger.
PHB appears to be in its bullish wave C. Wave C is a diametric. It is completing wave e of C.
Closing a weekly candle below the green range will violate the analysis.
For risk management, please don't forget stop loss and capital management
Comment if you have any questions
Thank You

MDT wants to follow PHBMDT VS PHB
Both coins are AI coins
Both have small MC
Both printed Huge Ascending triangle
Phb pumbed hard recently so all the eyes on MDT now
It looks so obvious it wants to follow it’s sister
Note : MDT above our entry by 60% but will continue pumping hard once it brokes the massive bullish pattern
Best of luck

Saucer pattern presenting potential profit of +900% through PHB#PHB/USDT #Analysis
Description
---------------------------------------------------------------
+ PHB has formed a well-defined saucer pattern and has effectively broken out from the resistance level associated with this pattern.
+ This presents an opportune moment to enter the trade. I anticipate a significant price surge following this breakout.
+ I'm initiating my entry at the current price, leveraging 10x with only 0.25% of the capital allocated to this trade.
---------------------------------------------------------------
VectorAlgo Trade Details
------------------------------
Entry Price: 1.8667
Stop Loss: 1.4259
------------------------------
Target 1: 2.1153
Target 2: 2.4014
Target 3: 2.8614
Target 4: 3.6370
------------------------------
Timeframe: 1D
Capital: 1-2% of trading capital
Leverage: 5-15x
---------------------------------------------------------------
Enhance, Trade, Grow
---------------------------------------------------------------
Feel free to share your thoughts and insights.
Don't forget to like and follow us for more trading ideas and discussions.
Best Regards,
VectorAlgo

#PHB/USDT#PHB
On the 4-hour frame, we have a bullish channel within which the price is trading
We have strong support that the price is committed to bouncing from
Entry price is 0.0900
The first target is 0.0944
The second goal is 0.09963
The third target is 1.0545

PHB LOOKS BEARISHBy maintaining the red range of supply, it seems that PHB can drop more.
A liquidity pool is swept above and then the Order Flow (OF) is well done.
Now we have liquidity pools in the lower limits, it is expected that the price of the lower pools will also collect.
By LSH, we mean the Long Shadow, which is a marked support on the chart.
The targets are marked on the chart. Closing a daily candle above the supply range will violate the analysis
For risk management, please don't forget stop loss and capital management
When we reach the first target, save some profit and then change the stop to entry
Comment if you have any questions
Thank You

PHB LOOKS BULLISHWe reached the red box that was the front of the f wave in the previous analysis, but this resistance was cleared.
Clearing this resistance, we revised the analysis and we think we are completing a large triangle. The leading resistance of the box will be red and the drop is canceled.
This is an update to the analysis linked in the relevant section

PHB ROADMAPIt looks like PHB is completing a descending triangle as we are now in wave D which is a diametric. Now it seems that we are in wave F of this diametric, after this wave is completed, PHB can fall from D for wave g.
From the PHB we expect the completion of drawn branches. Do not enter the position without trigger or confirmation and without setting stop loss and capital management.
This coin has a small volume, control the risk

PHB Phoenix Global forming a bullish AB=CD for upto 26% pumpHi dear friends, hope you are well and welcome to the new trade setup of PHB Phoenix Global (new) with US Dollar pair.
Previously we caught more than 26% pump of PHB as below:
Now on a daily time frame, PHB is about to complete a bullish AB=CD move for the next price reversal.
Note: Above idea is for educational purpose only. It is advised to diversify and strictly follow the stop loss, and don't get stuck with trade.

PHB: breakout this falling wedge pattern!Hi guys, This is CryptoMojo, One of the most active trading view authors and fastest-growing communities.
Consider following me for the latest updates and Long /Short calls on almost every exchange.
I post short mid and long-term trade setups too.
Let’s get to the chart!
I have tried my best to bring the best possible outcome to this chart, Do not consider financial advice.
#PHB/USDT
After a long time, PHB breaks this 208D-long Falling wedge pattern in the 1D time frame.
But we still need a retest of this pattern to conform this pattern.
IMO, it looks good to buy in a spot with a SL if any candle closes below the upper support of this pattern.
If everything goes well, we can expect a good return in the upcoming bull run.
This chart is likely to help you make better trade decisions if it does consider upvoting it.
I would also love to know your charts and views in the comment section.
Thank you

PHB ANALYSIS (1D)Hi, dear traders. how are you ? Today we have a viewpoint to BUY/SELL the PHB symbol.
For risk management, please don't forget stop loss and capital management
When we reach the first target, save some profit and then change the stop to entry
Comment if you have any questions
Thank You
P

PHB Phoenix Global formed bullish BAT for upto 23.50% pumpHi dear friends, hope you are well and welcome to the new trade setup of PHB Phoenix Global (new) with US Dollar pair.
Recently we caught more than 26% pump of PHB as below:
Now on a 4-hr frame, PHB has formed a bullish BAT move for the next price reversal.
Note: Above idea is for educational purpose only. It is advised to diversify and strictly follow the stop loss, and don't get stuck with trade.

PHB PhoenixGlobalOld LONG 20230525AB-CD is expected
Bottom confirmed: Blue * N is confirmed by Red -> Green
DISCLAIMER
This is only a personal opinion and does NOT serve as investing NOR trading advice.
Please make your own decisions and be responsible for your own investing and trading Activities.

Keep an eye on $PHB/USDTKeep an eye on $PHB/USDT.
Falling wedge formation in 1hr timeframe.
Did you find this crypto market analysis helpful? Stay updated about the latest crypto market update.
Please continue to follow my analysis and feel free to ask any queries, you may have. I am here to assist you.
TradingView: @FarmanBangashh
