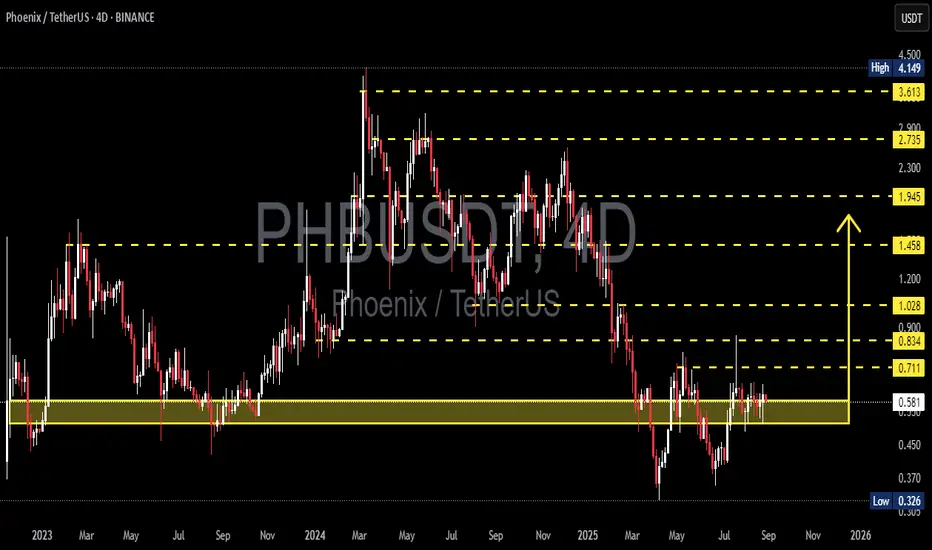
PHB/USDT — Holding the Demand Zone, Awaiting Major Breakout?Currently, PHB/USDT is consolidating within a critical demand zone at 0.52 – 0.62. This area has repeatedly acted as a strong floor since 2023, absorbing heavy sell-offs and showing signs of accumulation.
The market structure suggests that PHB is forming a range-base accumulation pattern, with 0.711 as the immediate breakout trigger. The next move will decide whether PHB transitions into a bullish expansion or breaks down into deeper bearish territory.
---
🔹 Structure & Price Pattern
Demand zone (0.52 – 0.62): A key support level where buyers continue to defend strongly.
Cluster highs near 0.711: A liquidity level and breakout confirmation point.
Layered resistances above: 0.834 → 1.028 → 1.458 → 1.945, serving as potential take-profit zones.
Deep wicks to 0.326 in the past: Indicate capitulation events, followed by strong reclaim — a bullish sign as long as demand holds.
---
🟢 Bullish Scenario
If PHB closes above 0.711 (4D candle) with volume confirmation, a breakout rally may follow.
Upside targets:
1. 0.834 (minor resistance)
2. 1.028 (psychological resistance)
3. 1.458 (major resistance, strong take-profit area)
A confirmed breakout signals the end of long consolidation and a possible start of a bullish phase.
---
🔴 Bearish Scenario
Failure to break 0.60–0.62 / 0.711 may push PHB back toward 0.55 – 0.52.
If 0.52 breaks on a 4D close, PHB risks a deeper drop toward:
1. 0.50
2. 0.45
3. 0.37 – 0.326 (historical low)
A breakdown below 0.52 would confirm that buyers lost control, re-opening a bearish trend.
---
📌 Trading Strategy & Risk Management
Swing traders: Consider long entries near 0.55–0.58 with targets at 0.711+.
Breakout traders: Wait for a confirmed close above 0.711 before entering, targeting resistances above.
Stop loss: Below 0.52 to protect against deeper downside.
Maintain a Risk:Reward ratio ≥ 1:2 and use 4D candle closes for confirmation to avoid fakeouts.
---
✨ Conclusion
PHB is at a make-or-break level:
Holding above 0.52–0.62 keeps bullish momentum alive, with breakout potential toward 0.834–1.458.
Losing this demand zone could open the path back to 0.37–0.326 lows.
This is a critical crossroads — a breakout could mark the start of a new bullish cycle, while a breakdown signals renewed weakness.
#PHBUSDT #PHB #Phoenix #CryptoAnalysis #PriceAction #AltcoinAnalysis #CryptoTrading #SupportResistance #DemandZone #Breakout #BullishScenario #BearishScenario #SwingTrading
Phbusdc
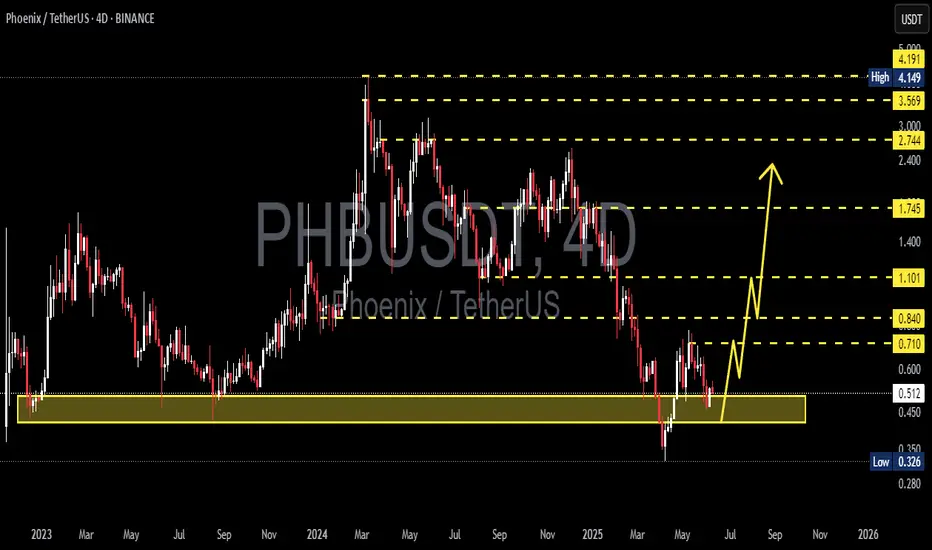
PHBUSDT Bounces from the Golden Pocket?🧠 Market Context & General Analysis
Phoenix (PHB) is currently at a critical juncture in its market structure. After a prolonged downtrend from its 2024 highs, price has now reacted strongly off a key Fibonacci Golden Pocket retracement zone (0.5–0.618), which also aligns with a historically respected demand area.
This level is not just a technical formality – it’s a zone where smart money typically enters, and historically it has provided reliable bullish reversals.
---
📍 Key Zones to Watch
🟨 Demand / Accumulation Zone:
0.549 – 0.608 → Fibonacci 0.5–0.618 + Historical support
⤷ Has been retested and shows early signs of a bullish reaction.
📈 Layered Resistance Zones (Fibonacci Targets):
0.834 → Minor resistance + potential double bottom neckline
1.028 → Previous structural resistance
1.200 → Psychological round level
1.458 → Key Fibonacci extension
1.945 – 2.735 – 3.648 → Mid/long-term Fibonacci targets
4.149 → All-Time High (ATH) on this chart
🔻 Major Support if Breakdown Occurs:
0.326 → Historical bottom / last line of defense
---
🧩 Pattern Formation: What’s Emerging on the Chart?
🔄 Potential Double Bottom:
Price structure is showing signs of a potential reversal formation in the form of a double bottom near the 0.55–0.61 zone. A confirmed breakout above the neckline at 0.834 would validate this bullish setup.
📉 Broken Downtrend Channel?:
PHB was previously trading in a downtrend channel. The current move suggests a possible breakout and the beginning of a trend shift or accumulation phase.
---
✅ Bullish Scenario: The Rise of the Phoenix
If the price holds above 0.608 and confirms with a strong breakout above 0.834, a bullish trend reversal could follow.
🚀 Short-term targets: 0.834 → 1.028
🔥 Mid-term targets: 1.200 → 1.458 → 1.945
🌕 Long-term potential: 2.735 – 3.648 – 4.149
Validation Key: Break above 0.834 with strong volume
Bullish confirmation candle: Bullish engulfing / Marubozu on 4D or Daily
---
⚠️ Bearish Scenario: Breakdown Threat Looms
If the price fails to hold the 0.549 support level, we could see a continuation of the downtrend, potentially targeting:
💀 First stop: 0.45 – 0.40 zone
🧊 Extreme case: Drop toward 0.326 (historical low)
Breakdown Confirmation:
Daily or 4D close below 0.549
Followed by selling volume and no quick recovery
---
🎯 Potential Trading Strategies (Not Financial Advice):
🟢 Bullish Swing Entry: Buy zone at 0.55–0.61
⤷ Targets: 0.834 – 1.028
⤷ Stop-loss: Below 0.52 (close basis)
🔴 Breakout Trade: Enter on breakout above 0.834 with volume
⤷ Targets: 1.200 – 1.945
⤷ Stop-loss: Below 0.80
🔵 Bearish Play / Re-entry: Short if break below 0.549
⤷ Targets: 0.40 – 0.326
⤷ Stop-loss: Above 0.60
---
🧲 Final Thoughts
PHBUSDT is in a make-or-break zone, sitting atop the Golden Pocket and showing early bullish momentum. If buyers step in and maintain the momentum, we could be witnessing the early stages of a significant market reversal.
However, failure to hold the key support at 0.549 would likely shift the sentiment back into bearish territory. Volume and confirmation candles will be the deciding factor for the trend’s next direction.
#PHBUSDT #PhoenixCrypto #AltcoinReversal #GoldenPocket #CryptoTA
#FibonacciLevels #BullishSetup #BearishBreakdown #ChartPatterns

PHBUSDT 4D AnalysisPHB ~ 4D Analysis
#PHB This trade is very High risk, Buy gradually from here if you still have confidence in this coin with a short term target of at least 15%+ from here.
PHBUSDT 3D Analysis PHB ~ 3D Analysis
#PHB Buy from here if you still have confidence in this coin with a short term target of at least 15%++


PHB LongPHB Long Setup
Reason:
Breakout of Accumulation Zone.
Breakout of Trendline.
Strong Bullish momentum with volume.
Expecting a bullish impulsive move soon.
All Technical Indicator suggesting a Solid Breakout.
Regard, The Crypto Panda
BINANCE:PHBUSDT.P
BYBIT:PHBUSDT.P
BINANCE:PHBUSDT
MEXC:PHBUSDT.P

PHB IS EXPECTED TO PUMP 35% IN COUPLE OF DAYSPHB has successfully broken upper trendline of triangle and is expected to go long from here.
