PIPPIN ready for explosion 20% gain toward 0.060$hi
if the price keep this support and trendline we can see more gain for PIPPINUSDT at least 20% toward 0.060$
PIPPINUSD

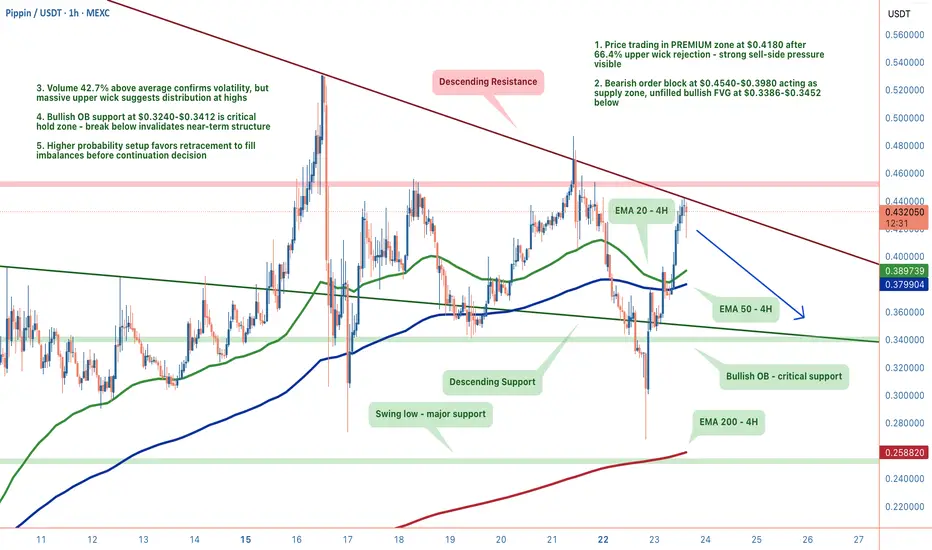
Pippin: The Distribution Pattern Everyone's MissingPrice spiked 21.79% to $0.4428, then printed a massive 66.4% upper wick rejection—that's not bullish continuation, that's smart money distribution. We're currently at $0.4180 in PREMIUM territory, sitting in the exact zone where probability favors mean reversion, not continuation.
1. THE TECHNICAL REALITY 📉
• Bearish order block $0.4540-$0.3980 acting as supply ceiling, price got violently rejected there
• Trading in PREMIUM zone above equilibrium ($0.3896), we're in the sell zone per smart money concepts
• Rising wedge pattern detected—these formations typically resolve downward
• Price above all major EMAs (20/50/200), so longer-term structure remains intact
2. THE INDICATORS ⚖️
Bearish Signals:
• RSI at 45.9 declining from overbought, momentum shifting
• MACD histogram showing weakening momentum despite bullish crossover
• 66.4% upper wick rejection at highs, textbook distribution signal
Bullish Signals:
• Volume 42.7% above average, confirms trending environment
• ADX at 38.9, strong directional movement in play
• Price holding above all major moving averages
The Conflict:
We're in a trending environment with bullish structure, but sitting in premium territory with clear distribution evidence. The question isn't if we retrace, it's how deep.
3. THE TRADE SETUP 🎯
🔴 Scenario A: Mean Reversion (Higher Probability)
• Trigger: Rejection at current levels or one more push to $0.4540
• Entry: Short on rejection confirmation
• Target 1: $0.3386-$0.3452 (unfilled bullish FVG, price returns to fill imbalances)
• Target 2: $0.3240-$0.3412 (bullish order block demand zone)
• Extended Target: $0.2520 if demand breaks
• Stop: 4H close above $0.4540
🟢 Scenario B: Bullish Reclaim
• Trigger: 4H close above $0.4540 (breaks bearish OB supply)
• Entry: Reclaim of $0.3896 equilibrium with conviction and volume
• Target: $0.5049
• Invalidation: Rejection back below $0.3896
MY VERDICT
This isn't a chase-the-pump moment, it's a wait-for-structure moment. The setup favors patient short positioning or waiting for the FVG fill at $0.3386-$0.3452 to reassess. Risk-adjusted probability leans 72% bearish until we see that 4H close above $0.4540.
PIPPIN Looks Bearish (4H)First of all, note that this token is risky and highly volatile.
Based on the bearish CH on the chart and the failure to form a new high after this CH, it appears that PIPPIN’s bullish phase has not yet fully ended. The price is currently forming a liquidity pool, which is expected to be swept before this pool eventually breaks to the downside.
We expect a rejection from the supply zone toward the specified targets.
A candle close above the invalidation level would invalidate this analysis and outlook.
Do not enter the position without capital management and stop setting
Comment if you have any questions
thank you

PIPPIN Looks Bearish (12H)Before anything else, you should note that this token is very risky and highly volatile.
A trend break has occurred, a bearish CH was previously formed, and if you check the full PIPPIN data, you’ll see that it is at its previous ATH but showing bearish signals. All of this suggests that PIPPIN may experience deep drops in the near future.
We have two entry zones for sell/short positions, which should be entered using DCA.
The targets are marked on the chart.
A daily candle close above the invalidation level will invalidate this outlook.
For risk management, please don't forget stop loss and capital management
When we reach the first target, save some profit and then change the stop to entry
Comment if you have any questions
Thank You

Bullish, but not as strong as before.Hey guys, PIPPINUSDT just printed an absolute monster move, surging 60.50% in the last 24 hours from a low of $0.2200 to a high of $0.3966 before settling around $0.3571. This kind of explosive price action demands careful analysis because while the gains look incredible, the real question is whether we're looking at sustainable momentum or a classic pump setup ready to dump on latecomers.
Let's start with the trend structure, which is honestly pretty clean for such a volatile move. Price is holding above all three major exponential moving averages: EMA20 at $0.3249, EMA50 at $0.2758, and EMA200 at $0.2066. This creates what we call a bullish EMA stack, where faster averages sit above slower ones, and price maintains position above all of them. It's textbook trending behavior and exactly what you want to see if you're positioned long or looking for continuation entries.
The ADX is reading 57.2, which confirms we're in a strong trending environment rather than choppy consolidation. When ADX pushes above 50, it's telling you there's genuine directional conviction in the market, not just noise. Right now that direction is clearly bullish, supported by the internal market state showing a 5-to-1 bull-to-bear stack ratio. The directional confidence sits at 33.6%, which might seem low, but given the mixed signals from MACD and volume, it's actually reasonable - the trend is up, but momentum indicators are flashing some yellow flags.
Speaking of momentum, let's dive into the RSI and MACD situation. RSI at 64.7 is sitting comfortably in neutral territory, which is actually bullish because it means we've got room to run before hitting overbought conditions around 70-75 where profit-taking typically accelerates. We're not seeing extreme readings that would suggest an imminent reversal. However, the MACD is showing a bearish crossover with the MACD line at 0.0272 sitting below the signal line at 0.0308. This divergence often precedes short-term consolidation or pullbacks, especially after parabolic moves like we just witnessed. It's not screaming reversal, but it's definitely suggesting we might need to digest these gains before the next leg higher.
The Bollinger Bands are painting a really clear picture of the current price structure. Upper band sits at $0.3704, middle band (which is basically a 20-period SMA) at $0.3318, and lower band at $0.2932. Price is currently trading above the middle band but well below the upper band after getting rejected from $0.3966. That massive 19.4% upper wick from the session high is significant - it shows heavy supply came in at those elevated levels, and sellers were aggressive enough to push price down substantially. Compare that to the tiny 3.6% lower wick, and you can see buyers are still defending dips with conviction. The battle right now is whether bulls can reclaim that upper Bollinger Band at $0.3704 or if we consolidate/correct toward the middle band support.
Volume analysis is where things get a bit concerning for the immediate bullish case. Current volume sits at $152.9M, which is below the average of $214M. After a 60% rally, you'd ideally want to see sustained or increasing volume to confirm the move has legs. Declining volume after explosive gains often suggests the initial wave of buyers is exhausted, and we need fresh capital to push higher. The MFI (Money Flow Index) at 55.7 is neutral, not showing extreme buying or selling pressure, which keeps both continuation and correction scenarios on the table. We're not seeing the kind of volume capitulation that would signal a top, but we're also not seeing the accumulation that would confirm the next leg up is ready to fire.
From a support and resistance perspective, here are your critical levels to watch. Immediate support sits at the EMA20 around $0.3249, which has been tested and held multiple times during this rally. Below that, you've got the middle Bollinger Band at $0.3318 acting as a secondary support zone. If both of those fail, the EMA50 at $0.2758 becomes your major support, and breaking that would likely invalidate the bullish structure and trigger a deeper correction toward the lower Bollinger Band at $0.2932. On the resistance side, the immediate ceiling is that Bollinger upper band at $0.3704. Reclaiming this level with volume would open the door to retest the session high at $0.3966, which is now a proven supply zone. Breaking above $0.3966 would be incredibly bullish and could trigger FOMO buying toward psychological resistance at $0.4000 and potentially $0.4100+ if momentum really accelerates.
For anyone looking to trade this setup, here's how I'd structure it. Entry zone would be on a pullback to $0.3350-$0.3400, ideally coinciding with a test of the middle Bollinger Band or EMA20. This gives you a better risk-reward than chasing current levels. Stop loss needs to sit below $0.3180, just under the EMA20 with enough breathing room to avoid getting stopped out by normal volatility and wick action. Your target progression should be scaled: TP1 at $0.3750 (retest of Bollinger upper band and psychological resistance), TP2 at $0.3900 (approaching previous high), and TP3 at $0.4100 for the aggressive holders chasing extension moves. That structure gives you roughly 2.5:1 risk-reward on the conservative first target, scaling up to 4:1 if this catches another wave of momentum. Consider taking partial profits at each level and trailing your stop as price advances.
The bull case here is straightforward: strong ADX-confirmed trend, clean EMA alignment, RSI with room to expand, support levels holding firm, and overall market structure favoring continuation. If volume returns above average levels and we reclaim $0.3704 with authority, this setup could easily push toward $0.40-$0.42 as retail FOMO kicks in. The bear case centers on that MACD bearish divergence, declining volume, and the massive supply that showed up at $0.3966. If we break below EMA20 at $0.3249 on increasing volume, it would likely trigger stops and send price down to test EMA50 around $0.2758, potentially even the lower Bollinger Band at $0.2932 if selling accelerates.
Overall confidence on the bullish continuation sits around 67% - we've got more factors supporting upside than downside, but those momentum divergences and volume concerns keep this from being a slam-dunk high-conviction setup. The trend is your friend until it bends, and right now the trend is still intact despite some warning signs. Risk management is crucial here given the volatility and the parabolic nature of the recent move.
How are you playing this move - waiting for a deeper pullback or riding the momentum?

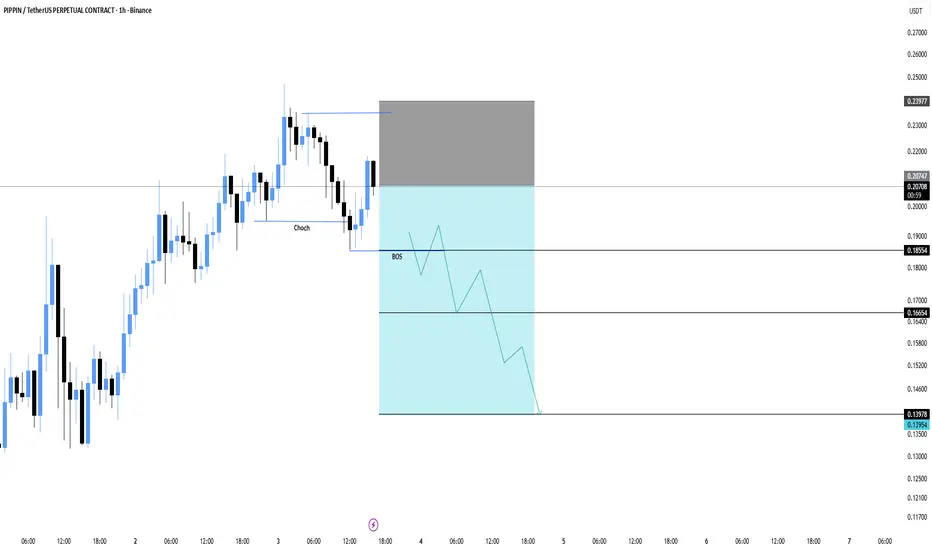
PIPPIN/USDT – Clean Short Setup, Dump Is coming!Price has shown a clear CHoCH followed by a BOS, confirming bearish structure. Current move is a retracement into the supply zone, giving a straightforward continuation-short opportunity.
Entry: 0.20747
Stop Loss: 0.23977
TP1: 0.18554
TP2: 0.16654
Final TP: 0.13978
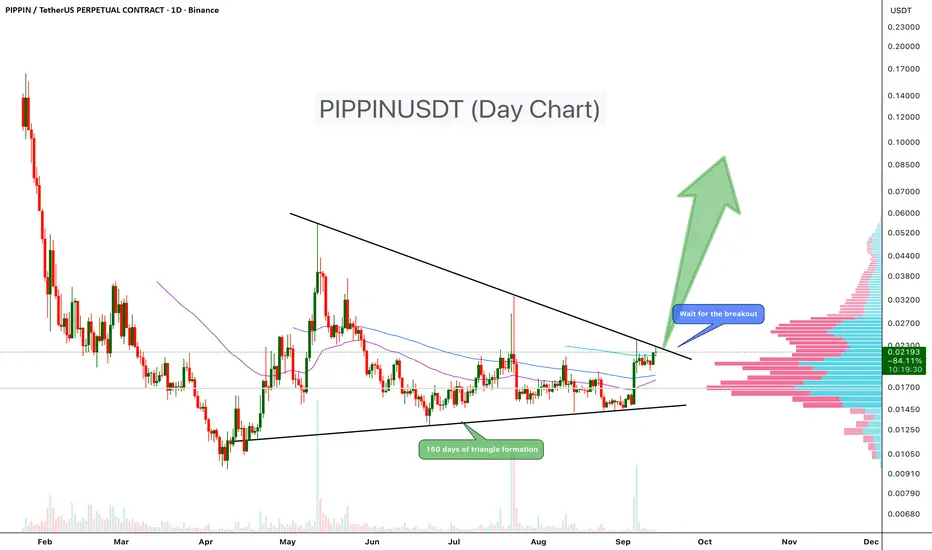
PIPPINUSDT Coiling for a Massive MovePIPPIN has been consolidating inside a symmetrical triangle pattern for the past 150 days, with price tightening between lower highs and higher lows. This long consolidation phase is creating strong pressure, and a breakout is likely to decide the next major move.
At present, the price is trading close to the upper trendline resistance of the triangle. A successful breakout and close above this level could trigger a strong bullish rally. On the other hand, rejection at resistance may push price back toward the lower boundary of the formation.
Key Points
- 150-day triangle formation indicates a major move ahead
- Price trading above 50,100,200 EMA in day chart
- Price consolidating near upper resistance trendline
-Volume profile shows heavy activity around current zone, a potential launchpad
- Upside potential remains strong if resistance is cleared
Trade Setup
✏️Entry: Wait for breakout confirmation above resistance trendline (~$0.0235)
✏️Stop-loss: $0.016)
✏️Targets: 150%-500%
Cheers
Hexa🧘♀️
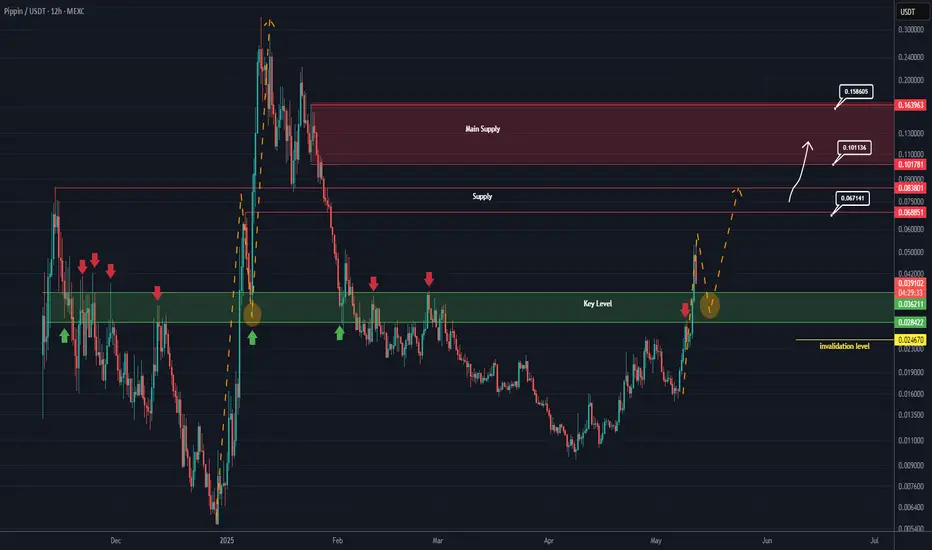
PIPPIN New Update (12H)It seems that a flip zone | or a key area | has been reclaimed here.
Previously, every time price touched this zone, it was rejected. But this time, the price has reclaimed it sharply and is now retesting the area.
Pay attention to the yellow arrows and circles.
Opening a sell/short position at this level might not be a good idea.
As long as the green zone is held, the price can move toward the marked supply levels.
If it drops below the green zone and a daily candle closes below the invalidation level, the bullish outlook on Pippin would still not be invalidated.
For risk management, please don't forget stop loss and capital management
When we reach the first target, save some profit and then change the stop to entry
Comment if you have any questions
Thank You
PIPPIN Looks Bullish (12H)It appears to be forming a triangle and is currently in the middle of wave D of that triangle.
If it returns to the green zone, we can look for buy/long positions within that area.
The targets are the red boxes. It may get rejected from the lower red box, so consider taking partial profits there.
A daily candle closing below the invalidation level would invalidate this analysis.
For risk management, please don't forget stop loss and capital management
Comment if you have any questions
Thank You
