PIPPIN:USDT Market Outlook – Volume Range Formation💠 PIPPIN:USDT Market Outlook – Volume Range Formation
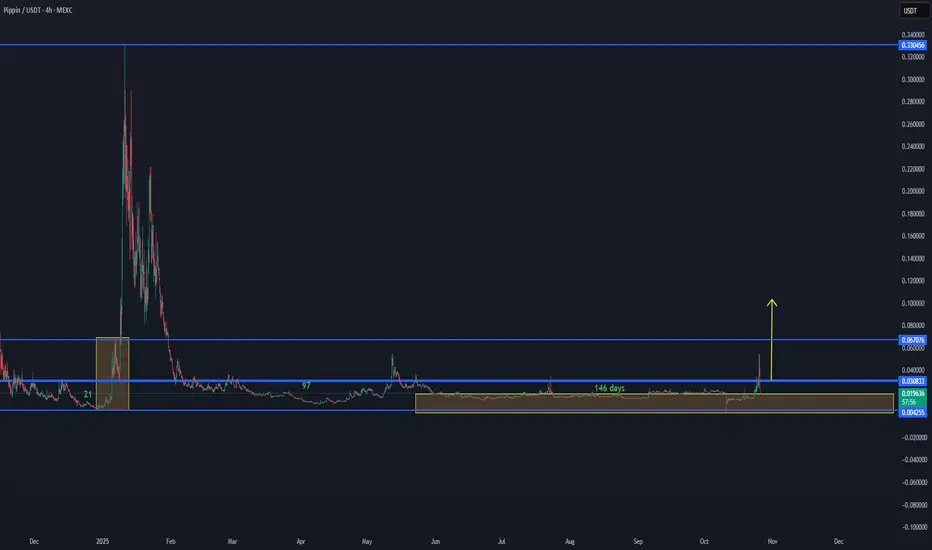
PIPPIN:USDT is showing early signs of new volume activation after an extended 146-day accumulation period within the lower range between 0.0042 – 0.0308 USDT.
This current setup indicates a potential volume range development, similar to the previous expansion phase observed earlier in the chart.
If momentum continues to build and volume sustains, the next major resistance zone sits around 0.067 USDT, followed by a broader target area toward 0.33 USDT on higher timeframes.
At this stage, stability above 0.018–0.020 USDT would confirm the base structure and strengthen the bullish outlook.
📊 Summary:
Range support: 0.0042 – 0.018 USDT
Key activation zone: 0.018–0.030 USDT
Target zones: 0.067 → 0.33 USDT
Structure: Accumulation → Early volume build-up
🔎 Focus: Watching for continuation of volume inflow and break above 0.0308 USDT to confirm next phase expansion.
PIPPINUSDT
PIPPIN/USDT — Path Toward $0.50 with 500M Market Cap PotentialPIPPIN/USDT — Path Toward $0.50 with 500M Market Cap Potential 🚀
PIPPIN is currently showing early structural strength after a long accumulation phase.
Based on current supply metrics and market behavior, a 500M market cap could push the price toward the $0.50 zone, representing a major expansion phase from current levels.
📊 Market Structure Overview:
Current base forming near $0.028
Next psychological and technical targets at $0.33 → $0.50
The $0.50 region aligns with ~500M market cap potential
If momentum continues building, PIPPIN could be entering a stage where new capital inflows drive a high-multiple move, similar to its previous historical run.
💡 Observation: The chart shows similar accumulation and volume buildup patterns seen before large runs — a breakout could mark the start of a new growth cycle.
📈 Outlook: Bullish scenario toward $0.50
🎯 Market Cap Target: 500M

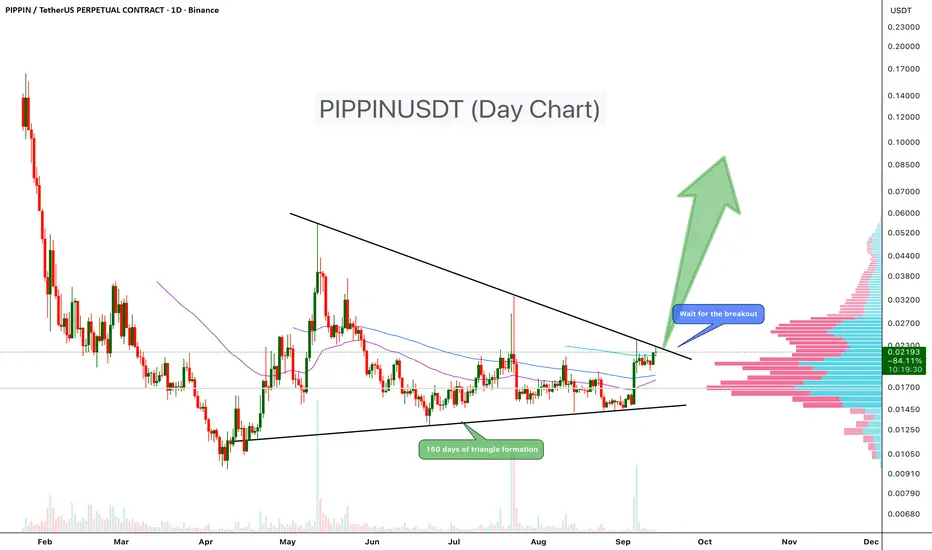
PIPPINUSDT Coiling for a Massive MovePIPPIN has been consolidating inside a symmetrical triangle pattern for the past 150 days, with price tightening between lower highs and higher lows. This long consolidation phase is creating strong pressure, and a breakout is likely to decide the next major move.
At present, the price is trading close to the upper trendline resistance of the triangle. A successful breakout and close above this level could trigger a strong bullish rally. On the other hand, rejection at resistance may push price back toward the lower boundary of the formation.
Key Points
- 150-day triangle formation indicates a major move ahead
- Price trading above 50,100,200 EMA in day chart
- Price consolidating near upper resistance trendline
-Volume profile shows heavy activity around current zone, a potential launchpad
- Upside potential remains strong if resistance is cleared
Trade Setup
✏️Entry: Wait for breakout confirmation above resistance trendline (~$0.0235)
✏️Stop-loss: $0.016)
✏️Targets: 150%-500%
Cheers
Hexa🧘♀️
Pippin · 5,895% Last Wave vs 3,000% Profits PotentialThis one looks good. Here the variation comes from the fact that in June there was a higher low compared to April, then again in July another higher low. Even before the last bullish wave we have higher lows and this is good.
PIPPINUSDT grew a massive 5,895% just 8 months ago. This reveals that this pair can do wild numbers. If done once, can happen again.
Then we have a full correction, the one that ended in April, and this is even better. Since the bullish move was corrected, it means a new one can develop. After the correction ended we have higher lows. Even when selling pressure was really strong (based on the volume) you can see how buyers were always present.
The next rise can hit an easy target of $0.208 for a massive 1,100%. A standard bull market with the current chart can yield 3,000% at $0.531. The end result can be something different.
Prices can end up moving up but not reaching our targets or everything can happen where prices move much higher. Lower is not likely and very low probability. 1,100% I would say is the minimum and an easy target because it was already hit in January 2025, much higher. With the higher lows in place, clear and strong, we aim for a higher high and that is a new all-time high. 3,000%. Seeing the 5,000% done easily months ago, we know it is possible and it is likely that it will be done. It is going to happen.
Namaste.

PIPPIN/USDT Long Setup Update!!PIPPIN Breakout Alert – 100% Potential on the Table
Hey Traders — if you're into high-conviction setups with real momentum, this one’s for you.
PIPPIN is breaking out from a falling wedge pattern on the 4H timeframe after a long period of consolidation. This structure typically signals a potential reversal with strong upside momentum.
With the recent breakout, we’re looking at a fresh long opportunity:
Entry:
Current levels: 0.0172 and add more up to $0.0155
Stop-Loss:
Below support: 0.0141
Targets:
Target 1: 0.0336
Target 2: 0.0450
Target 3: 0.0550
Target 4: 0.0650
✅ Risk-reward remains highly favorable from this point.
✅ Tight stop-loss to manage risk in case of any invalidation.
✅ Watch for confirmation above immediate resistance for further strength.
Disclaimer: Always manage your position size and risk. Trade safe!

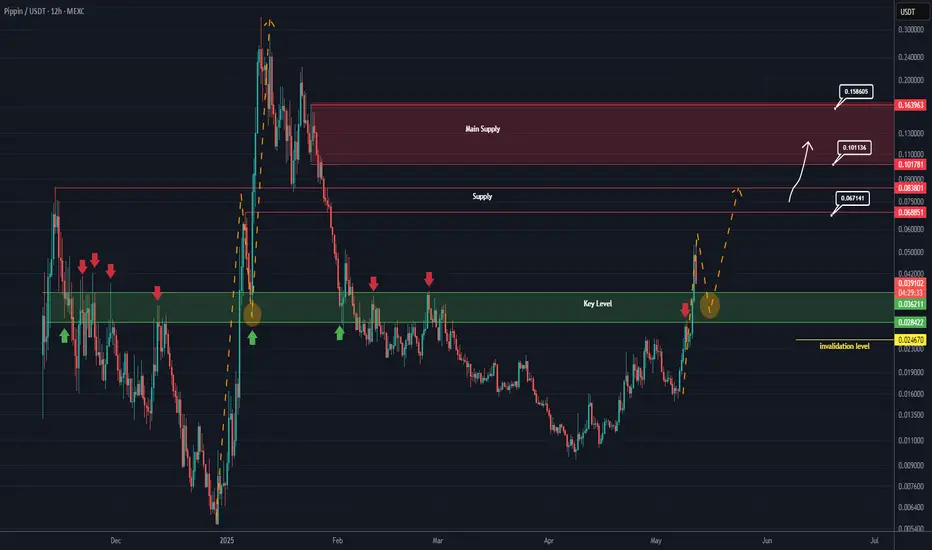
PIPPIN New Update (12H)It seems that a flip zone | or a key area | has been reclaimed here.
Previously, every time price touched this zone, it was rejected. But this time, the price has reclaimed it sharply and is now retesting the area.
Pay attention to the yellow arrows and circles.
Opening a sell/short position at this level might not be a good idea.
As long as the green zone is held, the price can move toward the marked supply levels.
If it drops below the green zone and a daily candle closes below the invalidation level, the bullish outlook on Pippin would still not be invalidated.
For risk management, please don't forget stop loss and capital management
When we reach the first target, save some profit and then change the stop to entry
Comment if you have any questions
Thank You
PIPPIN Looks Bullish (12H)It appears to be forming a triangle and is currently in the middle of wave D of that triangle.
If it returns to the green zone, we can look for buy/long positions within that area.
The targets are the red boxes. It may get rejected from the lower red box, so consider taking partial profits there.
A daily candle closing below the invalidation level would invalidate this analysis.
For risk management, please don't forget stop loss and capital management
Comment if you have any questions
Thank You

PIPPING breakout falling wegdeThere are must be a good move to the up direction.
P. S. If you want to get every day morning summary on a cryptomarket you could find me at the link in profile.

PIPPIN/USDT: LONG TRADE SETUP!!🚀 Hey Traders! PIPPIN Breakout Alert – Big Move Incoming? 👀🔥
If you’re excited for this setup, smash that 👍 and hit Follow for high-quality trade ideas that actually deliver! 💹🔥
🔥 PIPPIN Breakout & Retest – Time to Pump?
PIPPIN has broken out of a falling wedge on the 2H timeframe and is now retesting the breakout level. If this retest holds, we could see a strong rally ahead! 🚀
💰 Trade Setup:
📍 Entry: CMP, add more up to $0.019
🎯 Targets: $0.0225 / $0.0252 / $0.0294 / $0.0334
🛑 Stop-Loss: $0.018
⚡ Leverage: Low (Max 5x)
🔎 Strategy: Enter with low leverage now, scale in on dips, and ride the momentum to key targets!
💬 What’s Your Take?
Are you bullish on PIPPIN’s breakout? Drop your thoughts, analysis, and predictions in the comments! Let’s secure those gains and ride this wave together! 💰🚀🔥
