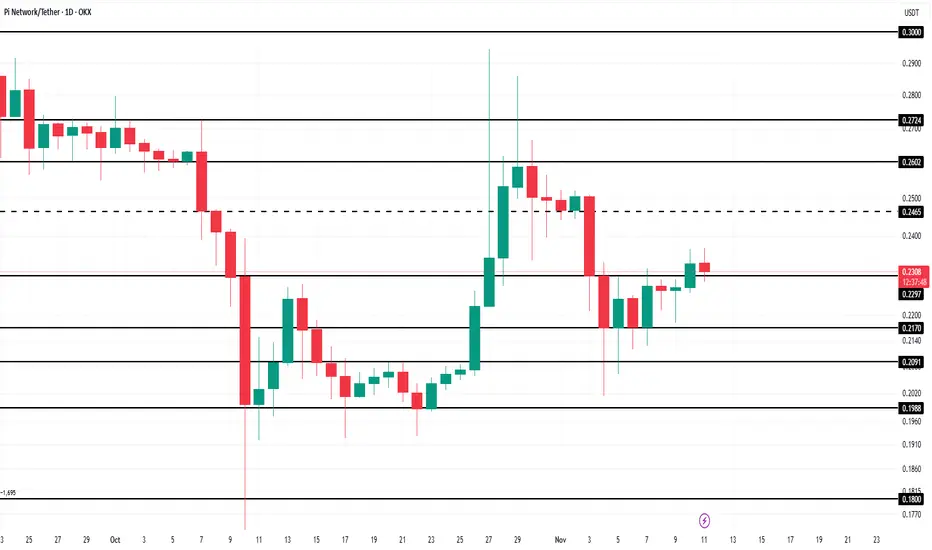
3 Weeks Since Local Top, Pi Coin Price Is Down By 28%Pi Coin trades near $0.203 at the time of writing, holding above the $0.198 support and below the $0.208 resistance. The token remains down about 28% from its $0.284 local top. Price action suggests consolidation rather than a decisive move.
If the downtrend strengthens, Pi Coin may remain range-bound between $0.198 and $0.208. This structure would limit upside potential and delay recovery. Prolonged consolidation could further test investor patience during ongoing market uncertainty.
A bullish scenario depends on sustained capital inflows. Continued accumulation could help Pi Coin reclaim $0.208 as support. A successful breakout may drive price toward $0.217, with further upside to $0.224. Such a move would invalidate the bearish thesis.
Piusd

Pi Coin Investors’ Remain Weak as Price Eyes 15% Drop RecoveryPi Coin’s price stands at $0.235 at the time of writing, after successfully breaching the $0.229 resistance level within the last 24 hours. The altcoin now appears to be regaining some lost ground from its late October decline.
For Pi Coin to fully recover from its 15% drop, the price must break through the $0.246 resistance and rally toward $0.260. Achieving this would reinforce the bullish outlook and restore market confidence among cautious investors.
However, if the bullish momentum weakens, Pi Coin could slip below $0.229 again and test the $0.217 support level. A breakdown beneath this support would invalidate the bullish thesis and expose the cryptocurrency to further downside risks.
Pi Coin Price Approaches $0.20 — Another Sideways Phase?Pi Coin’s price has declined by nearly 16% over the past week after failing to breach the $0.260 resistance. At the time of writing, the altcoin is trading at $0.220, reflecting its weakening technical position amid fading market support and declining investor optimism.
If the downward trend persists, Pi Coin’s price could fall below $0.209 and reenter a consolidation zone between $0.209 and $0.198. This pattern, seen previously, could stall recovery attempts and extend the bearish phase for a few more weeks.
However, a bounce from current levels could shift momentum. If Pi Coin reclaims $0.229 as support, it could attempt a rally toward the $0.246 resistance. Sustaining inflows and investor interest will be critical to invalidating the bearish outlook.

What To Expect From Pi Coin Price In November 2025?At the time of writing, Pi Coin trades at $0.254, sitting just below the $0.260 resistance. The immediate short-term goal for the token is to reach the $0.300 psychological level, which would strengthen bullish confidence.
However, if investor sentiment remains weak and inflows fail to pick up, Pi Coin’s price may fail to breach $0.260. A breakdown through $0.229 could push it lower toward $0.209, deepening the current correction.
Conversely, if the altcoin gains momentum and climbs to $0.300, it would represent an 18% rise, potentially attracting new inflows. A sustained push could extend the rally toward $0.360, helping Pi Coin recover September’s losses and invalidate the bearish thesis.

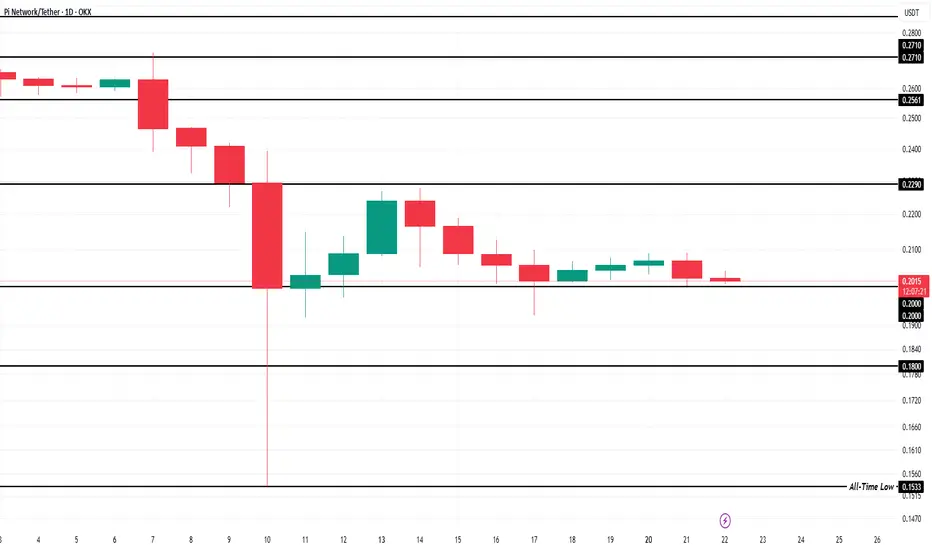
Pi Coin Price Consolidates — Next Stop: All-Time Low?At the time of writing, Pi Coin is priced at $0.203. It has maintained its position above the crucial $0.200 support for the past two weeks. Despite the mounting bearish pressure, the altcoin has managed to stay afloat, indicating some degree of resilience. If this consolidation holds, the price may continue hovering around current levels.
However, if bearish sentiment deepens and selling accelerates, Pi Coin may lose its grip on the $0.200 level. A breakdown below this floor could drag the price down to the $0.180 support level. This would place the cryptocurrency dangerously close to its all-time low of $0.153, a scenario that could spook long-term holders.
On a more optimistic note, if Pi Coin rebounds from its $0.200 base, it could target a move toward $0.229. A successful breach of this resistance would invalidate the current bearish setup and possibly set the stage for a short-term recovery.
Pi Coin Bullish Crossover Fails—Is Price Facing 23% Drop To ATL?At the time of writing, Pi Coin is trading at $0.239, just below the $0.240 threshold. The token has declined nearly 9% in the past 24 hours, reflecting growing selling pressure. Unless demand returns, Pi could continue to lose value in the coming days.
Based on current indicators, Pi Coin’s price could drop toward $0.200, with a possible retest of its all-time low (ATL) at $0.184—roughly 23% below current levels. Sustained bearish conditions would make this scenario increasingly likely.
Conversely, if the broader crypto market stabilizes, Pi Coin could stage a rebound. A move above $0.270 would invalidate the bearish outlook, paving the way for a recovery toward $0.286 and potentially higher levels.

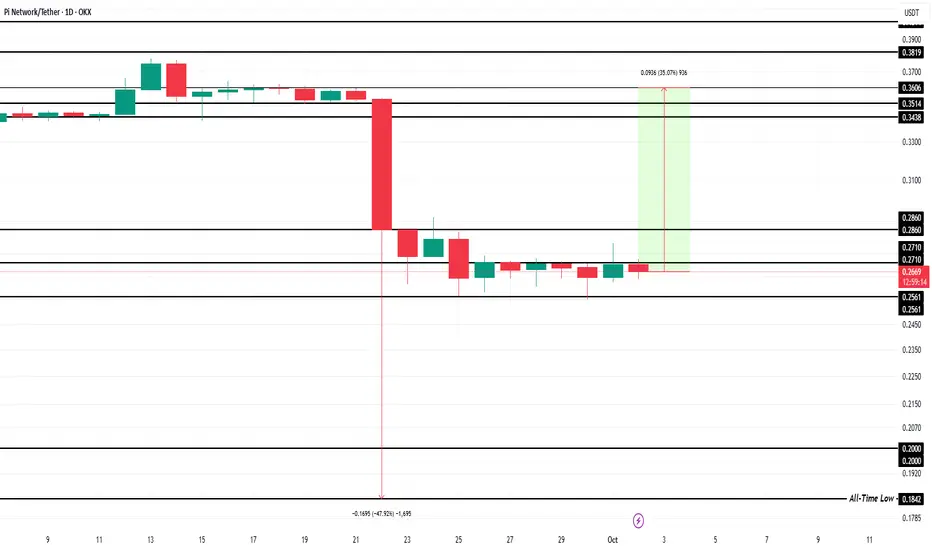
What To Expect From Pi Coin In October 2025?Pi Coin experienced a volatile August, followed by an even more turbulent September. The near 48% single-day drop dragged the token down to a new ATL of $0.184. This marked a severe setback for the project and testing investor patience.
In October, often referred to as “Uptober” for its bullish seasonal trend, Pi Coin could attempt recovery. A 35% rise would help the altcoin reclaim strength, with price targets set at $0.286 and $0.340. A rally past these levels could push Pi Coin to $0.360, effectively erasing the recent crash.
If declines continue, however, Pi Coin risks slipping below the $0.256 support. A deeper fall could send the price toward $0.200, invalidating the bullish outlook. This would signaling further weakness for the altcoin as investor hesitation lingers.
Pi Coin Price Eyes Breakout, Avoids All-Time Low ThreatPi Coin PAt the time of writing, Pi Coin is priced at $0.353, trading just below the critical resistance of $0.360. Flipping this level into a support floor would open the door for a rally toward $0.381, marking the first step in reversing its downtrend.
If achieved, this breakout would effectively end the ongoing decline. Considering both the RSI divergence and the MACD’s sustained bullish outlook. This scenario appears increasingly likely, provided broader market conditions remain neutral to positive.
However, risks remain. Should bullish momentum weaken, Pi Coin could slip through $0.351 and drop to $0.340. Falling below this would bring the threat of testing its all-time low, invalidating the bullish outlook and causing further concern for investors.
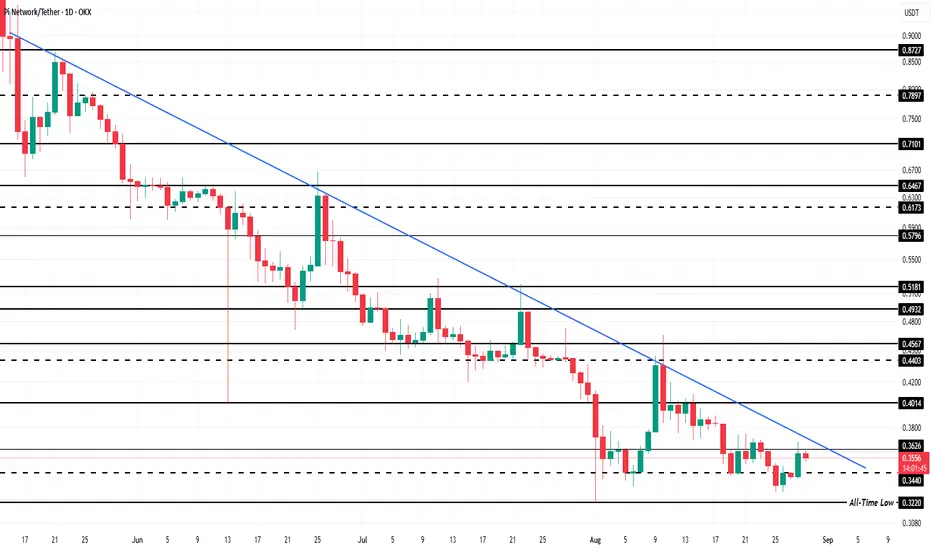
Pi Coin Price Downtrend Meets Resistance From Bitcoin’s RallyPi Coin is trading at $0.356 at the time of writing, sitting just below the $0.360 resistance level. The token has been caught in a month-long downtrend, making this resistance an important test for bullish sentiment.
If market support strengthens, Pi Coin could push past $0.360 and rise to $0.381. A successful breach would mark the end of the recent downtrend. This would open the possibility of further gains, supported by improving correlation with Bitcoin.
However, failure to clear $0.360 could leave Pi Coin vulnerable to renewed losses. The token risks slipping to $0.343 or lower, which would invalidate the bullish outlook. This would extend its period of weak performance, delaying any meaningful recovery.

Pi Coin Inflows Rise But Price Maintains Its Footing Under $0.35At the time of writing, Pi Coin is priced at $0.345, stuck just below the $0.351 resistance level. Attempts to break past this barrier over the last ten days have failed, underscoring the lack of sufficient buying power.
The cryptocurrency continues to hold steady near its $0.343 support level. Should investor inflows strengthen, Pi Coin could breach $0.351, flip it into support, and climb toward $0.360 in the short term.
However, weak market conditions pose a significant risk. If sentiment fails to improve, Pi Coin could slip toward $0.334 support. Such a drop would bring the token dangerously close to its all-time low of $0.322, invalidating the bullish outlook.
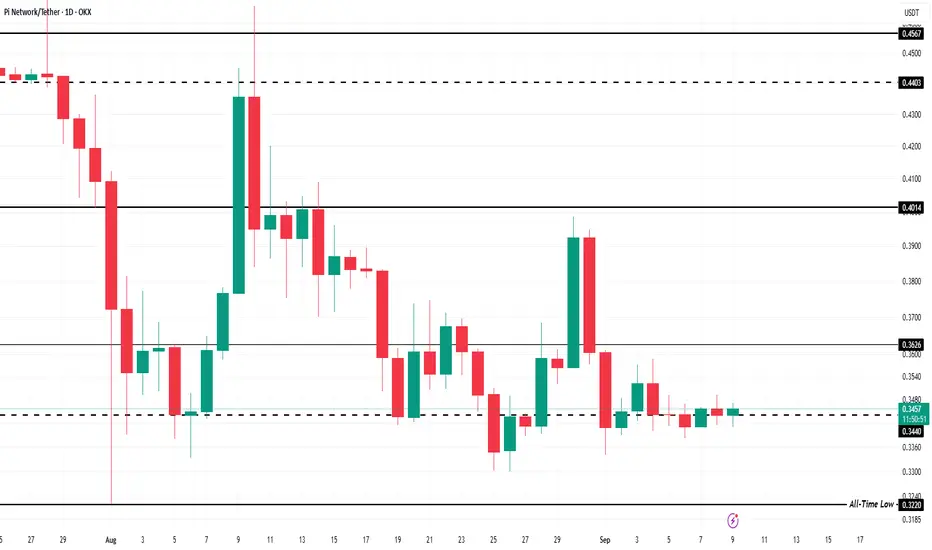
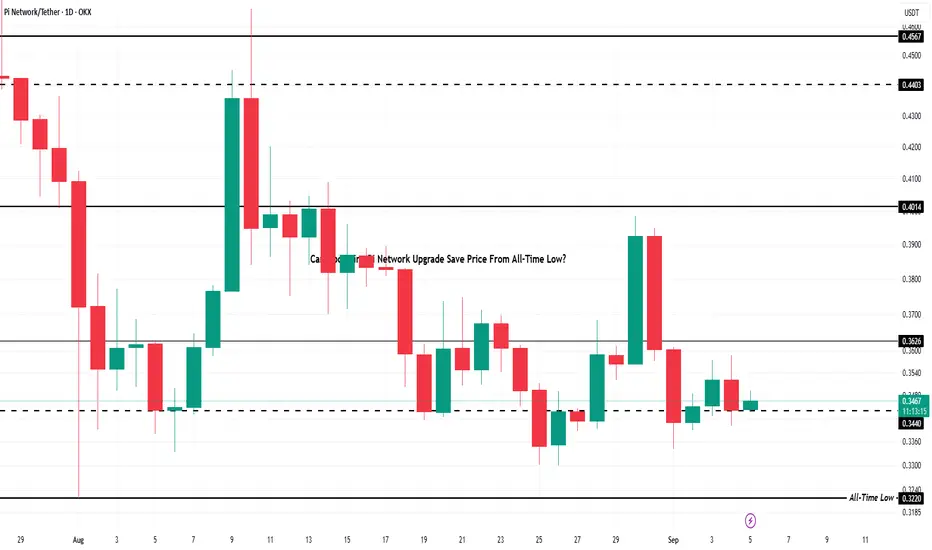
Can Upcoming Pi Network Upgrade Save Price From All-Time Low?
At the time of writing, Pi Coin trades at $0.345, holding above its crucial $0.344 support level. This line has acted as a foundation for weeks, helping the altcoin avoid setting new lows despite ongoing volatility.
Given the mixed cues from investors, Pi Coin is likely to remain rangebound. The price may hover between $0.344 and $0.360 until stronger momentum develops. Sideways movement could dominate trading as investors assess the impact of the upcoming upgrade.
If market conditions worsen, Pi Coin risks slipping through $0.334 support. A failure to hold this level could drag the token down to $0.322, matching or even forming a new all-time low, and invalidating any short-term bullish outlook.
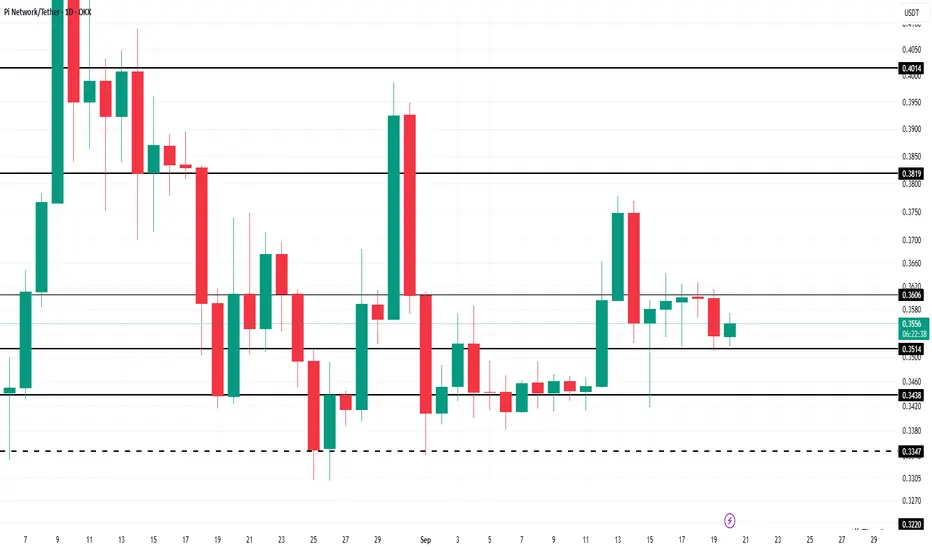
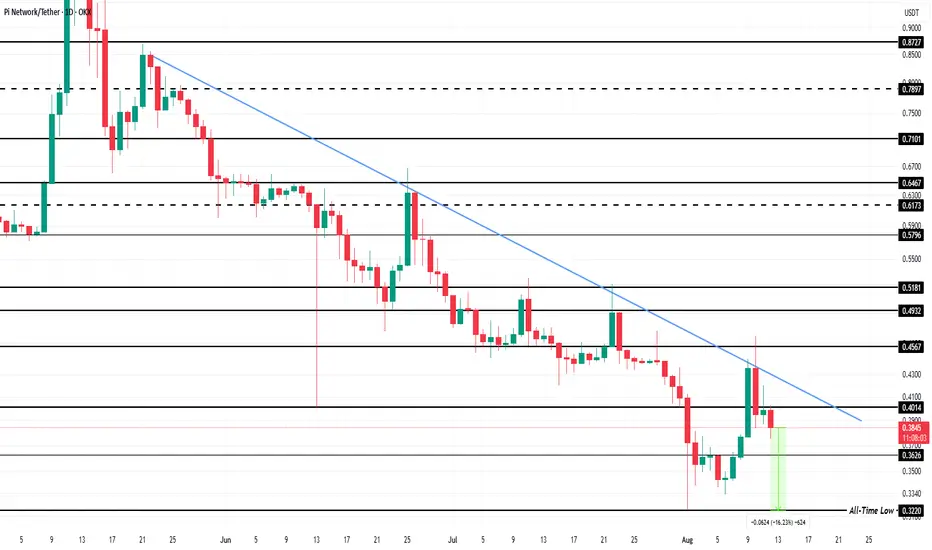
What To Expect From Pi Coin In September 2025?OKX:PIUSDT trades at $0.353, just below resistance at $0.362. The altcoin remains trapped in a downtrend lasting more than three months. Attempts to break out have failed four times, leaving the token vulnerable and positioned close to its all-time low as selling pressure intensifies.
If these conditions persist, OKX:PIUSDT could lose support at $0.344 . A decline to $0.322 would retest its all-time low, and continued selling may even push the price further down to $0.300. Such a move would confirm new weakness and mark fresh historic lows for the token.
If OKX:PIUSDT breaks the downtrend and reclaims $0.362 as support, it could rally toward $0.401 . This move would stabilize the market structure and counter bearish conditions. A recovery of this magnitude would challenge the ongoing selling narrative and provide short-term relief for investors holding the token.
Pi Coin Price Fails 3-Month Downtrend Breakout; What’s Next?Currently, OKX:PIUSDT is trading at $0.385 , having failed to breach a crucial resistance at $0.440. This resulted in a 12% decline over the last three days , solidifying the ongoing three-month downtrend. The inability to break through key resistance levels has left Pi Coin vulnerable to further losses.
OKX:PIUSDT price is now just 16% away from its ATL of $0.322 , and mixed sentiment from technical indicators suggests that it may not hit this level in the immediate future. The altcoin is likely to attempt a bounce from its current support at $0.362.
However, if the broader market conditions worsen or investor sentiment turns more pessimistic, a drawdown could be imminent. This may lead OKX:PIUSDT to breach its support and fall to $0.322 , invalidating the current bullish-neutral outlook. In this case, Pi Coin could form a new ATL, pushing its price even lower and intensifying the downtrend.
PI NETWORK : Will it finally be pumped?Hello friends🙌
👀According to the decline we had, you can see that the price has reached an important area and has formed a floor in this area. Considering the classic ego that is forming on support, you can enter the trade by breaking the resistance, of course, by managing risk and capital and moving with it to the specified goals.
🔥Follow us for more signals🔥
*Trade safely with us*
Pi Coin is Now 10% From an All-Time Low; Any Chance of Recovery?OKX:PIUSDT current price of $0.44 is holding just below the resistance of $0.45, a critical level for the altcoin. However, with the ongoing downtrend, this resistance is proving difficult to breach. The altcoin has faced continuous declines for the past two months, and without significant support, it remains susceptible to further drops.
OKX:PIUSDT is only 10% away from reaching its all-time low of $0.40. Given the current market conditions and Pi Coin's negative correlation with Bitcoin, the chances of the altcoin falling to this level are growing.
However, if investors increase buying pressure, OKX:PIUSDT may experience a rebound . A successful breach of $0.45 as support could lead to a recovery, pushing the price to $0.49. If this happens, the current downtrend could be invalidated, providing a potential window of opportunity for OKX:PIUSDT to reverse its fortunes.
Pi scalp risky but lets GO!!!!Hello traders, hope you're doing well!
NASDAQ:PI is showing strong bullish signs.
It's currently moving within a falling wedge pattern.
A breakout and pump could be coming soon.
If you profit from this, don’t forget to like and follow!

PI's situation+ Target PredictionThe price has broken the ascending wedge, and this could push it toward the middle of the channel, potentially happening very quickly.
Best regards CobraVanguard.💚

PI breakout !!Trendline Break:
Price has broken above a descending trendline — often a bullish signal.
A small retest is visible, indicating confirmation of the breakout.
Equal Highs (Liquidity Pool):
Labelled “$$ same highs” — this suggests buy-side liquidity is resting above that level.
Price often targets these highs to grab liquidity before a reversal or continuation.
BSL (Buy-Side Liquidity):
Two BSL levels marked; price may aim for these as upside targets.
FVG (Fair Value Gap):
The green shaded zone above represents an imbalance (FVG), usually a magnet for price.
Price may fill this area, targeting between 0.95 – 1.10 USDT.
📈 Expected Move (Bullish Bias):
Short-term: Move above the “$$ same highs” to run liquidity.
Mid-term: Push towards first BSL (~0.75 USDT).
Long-term: Potential fill of the FVG zone around 1.00 USDT.
⚠️ Watch for:
“same highs” area (could be a stop hunt).

80% DropIs an 80% Drop Ahead for Pi Network (PIUSDT)? 📉
🔹 Key Supports: 0.50, 0.10, and 0.01 USD
🔹 Key Resistances: 0.60, 0.70, and 1.00 USD
✅ PIUSDT is in a downtrend, and after breaking below 0.60 USD, it has dipped under the 0.50 USD support zone. If this trend continues, a decline toward 0.10 USD (approximately 80% drop) is possible.
📉 If sellers maintain control, breaking 0.50 USD could accelerate the downtrend.
📈 However, reclaiming 0.60 USD may lead to a corrective move toward 0.70 USD and potentially 1.00 USD.
🔍 Conclusion: The trend remains bearish, and a confirmed breakdown of 0.50 USD increases the likelihood of a drop to 0.10 USD.

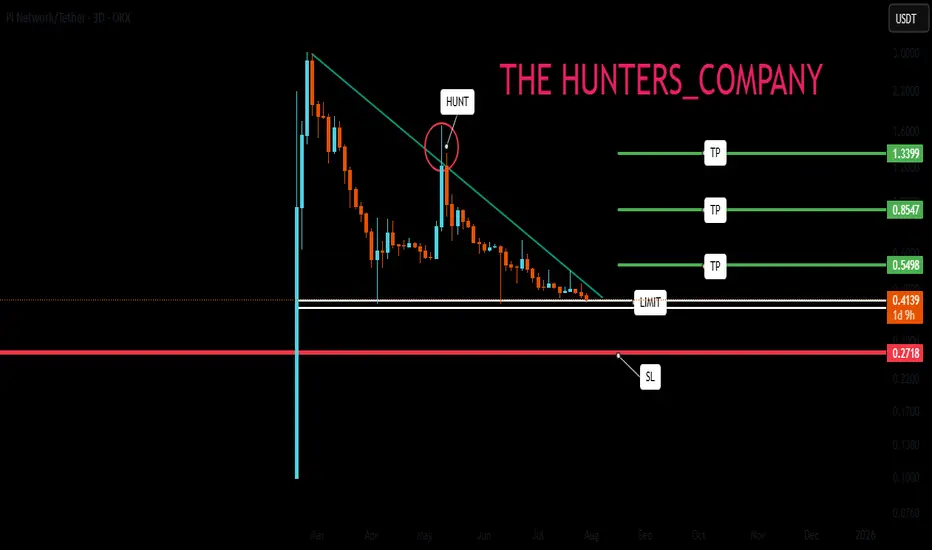
PI ANALYSIS (4H)Given the bearish CH and the formation of multiple supply zones, this asset is expected to move toward the green zone.
Targets are marked on the chart.
A daily candle closing above the invalidation level will invalidate this analysis.
For risk management, please don't forget stop loss and capital management
When we reach the first target, save some profit and then change the stop to entry
Comment if you have any questions
Thank You

Best LevelsGeneral Observation:
📉 Strong Bearish Candles: After a sudden price spike, the price has undergone a sharp correction, forming strong bearish candles.
📊 Support & Resistance Levels: Several key levels are marked on the chart:
🔴 Resistance Levels: 1.00, 1.50, 2.00, and higher.
🟢 Support Levels: 0.50, 0.10, 0.05, and 0.01.
📉 Trading Volume: Initially high but then declined, indicating seller dominance and weakening buyer strength.
⚠️ Possibility of Further Decline: The price is near the 0.70 support. If broken, further drops to 0.50 or even 0.10 could follow.
🚀 Bullish Scenario: If the price reclaims 0.80, an upward move towards 1.00 might occur.

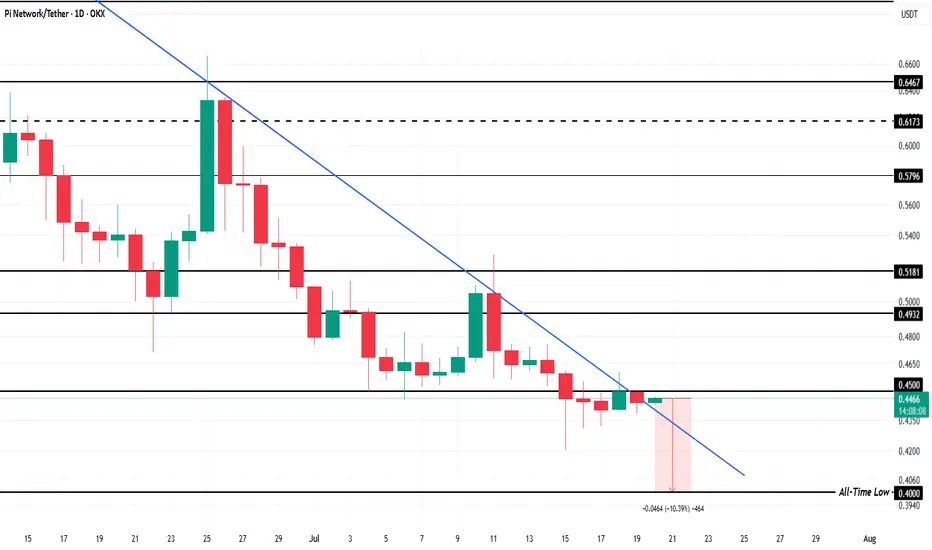
[PI Coin] If 0.68 holds, we should start wave 3 up towards $4BITGET:PIUSDT chart is setting up nicely for a bullish up-move, if 0.68 holds which happens to be the wave 2 low. If these counts are correct then we have completed minor wave (1) of larger 3 and (2) of 3 is in progress. That leaves wave (3) of larger 3 to start which should cover most of the distance towards wave 1 and 3 equality around 4 usd.

$PI - Pi NetworkPi Network might have just made it to the Guinness Crypto Record! Launched trading at $0, 01 cents on the 29.12.2022 on Huobi, it topped $345 exactly 24 hours later, that was only the IMPULSE WAVE, this impulse wave seems to be consolidating in the range $50 and $100, that puts waves 3 and 5 at over $1k! This is coin which has been mined for free on mobile phones since the project started in 2019 had a massive run in 24 hours, with 33 million active users world wide, it's trying to do something Bitcoin failed to do - a fair distribution to most people! Couldn't believe my Pi portfolio on the 30.12.2022 for a coin that I mined for free! The free mining on Pi Network is still active anyone with a mobile phone can still mine it for free although the mining rate has drastically gone down, but with 4 to 5 invitees actively mining you can still get 2,88 Pi per day at the current trading rate of $68, that's $195 per day!
