3 Weeks Since Local Top, Pi Coin Price Is Down By 28%Pi Coin trades near $0.203 at the time of writing, holding above the $0.198 support and below the $0.208 resistance. The token remains down about 28% from its $0.284 local top. Price action suggests consolidation rather than a decisive move.
If the downtrend strengthens, Pi Coin may remain range-bound between $0.198 and $0.208. This structure would limit upside potential and delay recovery. Prolonged consolidation could further test investor patience during ongoing market uncertainty.
A bullish scenario depends on sustained capital inflows. Continued accumulation could help Pi Coin reclaim $0.208 as support. A successful breakout may drive price toward $0.217, with further upside to $0.224. Such a move would invalidate the bearish thesis.
Piusdtanalysis

Pi Coin Investors’ Remain Weak as Price Eyes 15% Drop RecoveryPi Coin’s price stands at $0.235 at the time of writing, after successfully breaching the $0.229 resistance level within the last 24 hours. The altcoin now appears to be regaining some lost ground from its late October decline.
For Pi Coin to fully recover from its 15% drop, the price must break through the $0.246 resistance and rally toward $0.260. Achieving this would reinforce the bullish outlook and restore market confidence among cautious investors.
However, if the bullish momentum weakens, Pi Coin could slip below $0.229 again and test the $0.217 support level. A breakdown beneath this support would invalidate the bullish thesis and expose the cryptocurrency to further downside risks.
Pi Coin Price Approaches $0.20 — Another Sideways Phase?Pi Coin’s price has declined by nearly 16% over the past week after failing to breach the $0.260 resistance. At the time of writing, the altcoin is trading at $0.220, reflecting its weakening technical position amid fading market support and declining investor optimism.
If the downward trend persists, Pi Coin’s price could fall below $0.209 and reenter a consolidation zone between $0.209 and $0.198. This pattern, seen previously, could stall recovery attempts and extend the bearish phase for a few more weeks.
However, a bounce from current levels could shift momentum. If Pi Coin reclaims $0.229 as support, it could attempt a rally toward the $0.246 resistance. Sustaining inflows and investor interest will be critical to invalidating the bearish outlook.

What To Expect From Pi Coin Price In November 2025?At the time of writing, Pi Coin trades at $0.254, sitting just below the $0.260 resistance. The immediate short-term goal for the token is to reach the $0.300 psychological level, which would strengthen bullish confidence.
However, if investor sentiment remains weak and inflows fail to pick up, Pi Coin’s price may fail to breach $0.260. A breakdown through $0.229 could push it lower toward $0.209, deepening the current correction.
Conversely, if the altcoin gains momentum and climbs to $0.300, it would represent an 18% rise, potentially attracting new inflows. A sustained push could extend the rally toward $0.360, helping Pi Coin recover September’s losses and invalidate the bearish thesis.

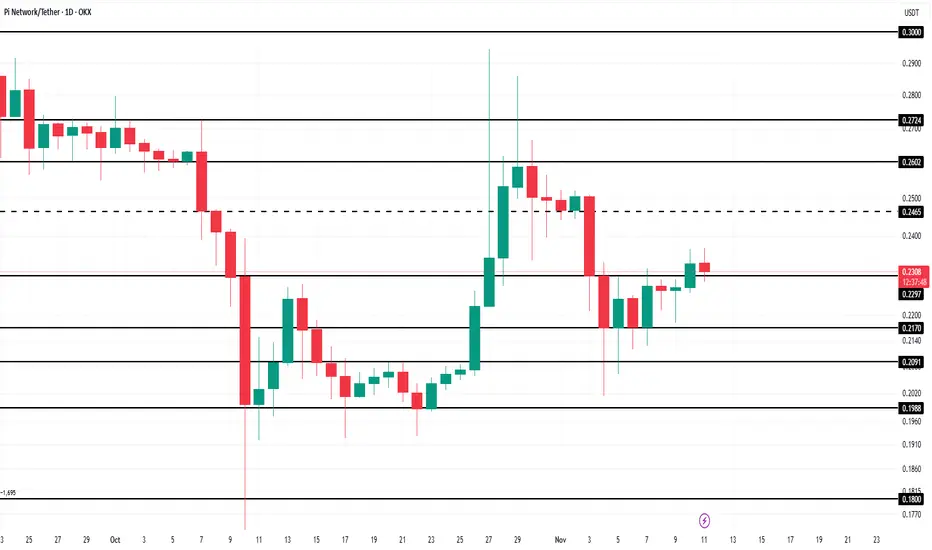
Pi Coin Price Consolidates — Next Stop: All-Time Low?At the time of writing, Pi Coin is priced at $0.203. It has maintained its position above the crucial $0.200 support for the past two weeks. Despite the mounting bearish pressure, the altcoin has managed to stay afloat, indicating some degree of resilience. If this consolidation holds, the price may continue hovering around current levels.
However, if bearish sentiment deepens and selling accelerates, Pi Coin may lose its grip on the $0.200 level. A breakdown below this floor could drag the price down to the $0.180 support level. This would place the cryptocurrency dangerously close to its all-time low of $0.153, a scenario that could spook long-term holders.
On a more optimistic note, if Pi Coin rebounds from its $0.200 base, it could target a move toward $0.229. A successful breach of this resistance would invalidate the current bearish setup and possibly set the stage for a short-term recovery.
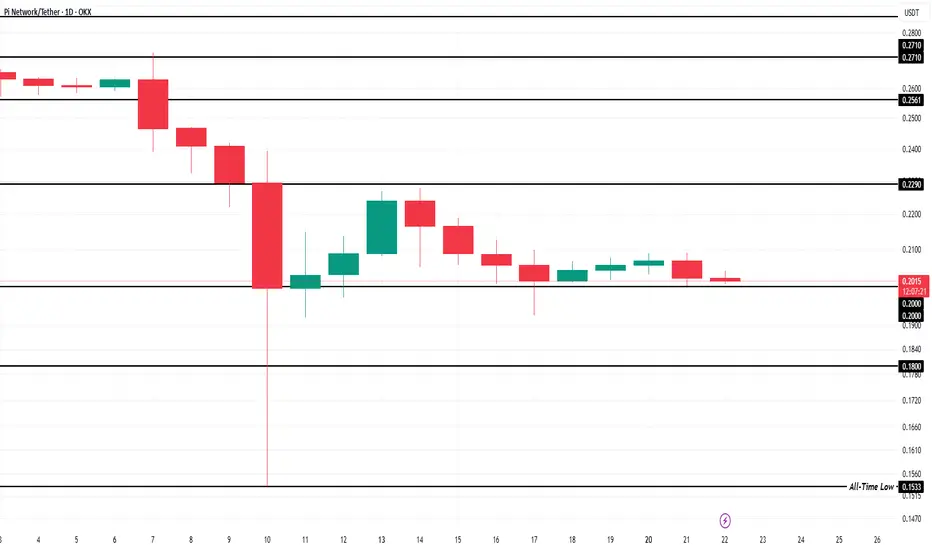
Pi Coin Bullish Crossover Fails—Is Price Facing 23% Drop To ATL?At the time of writing, Pi Coin is trading at $0.239, just below the $0.240 threshold. The token has declined nearly 9% in the past 24 hours, reflecting growing selling pressure. Unless demand returns, Pi could continue to lose value in the coming days.
Based on current indicators, Pi Coin’s price could drop toward $0.200, with a possible retest of its all-time low (ATL) at $0.184—roughly 23% below current levels. Sustained bearish conditions would make this scenario increasingly likely.
Conversely, if the broader crypto market stabilizes, Pi Coin could stage a rebound. A move above $0.270 would invalidate the bearish outlook, paving the way for a recovery toward $0.286 and potentially higher levels.

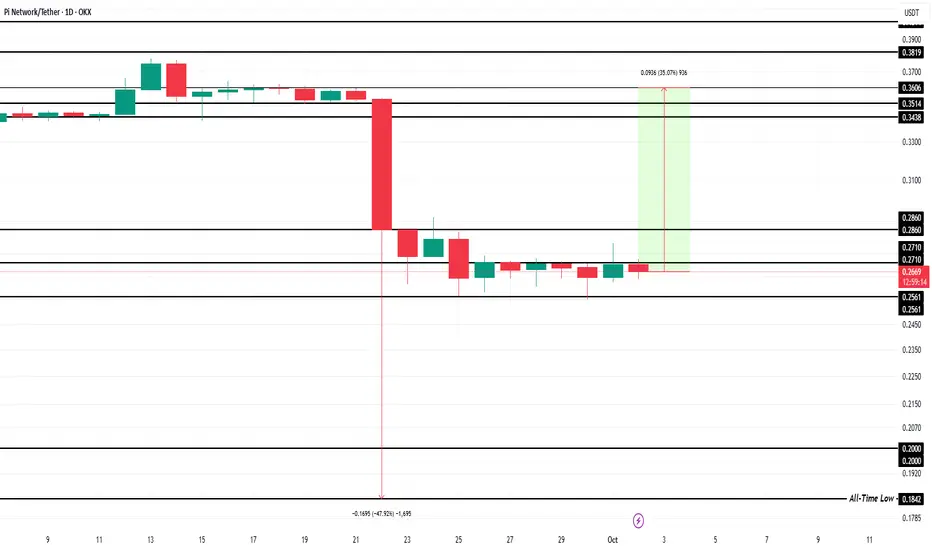
What To Expect From Pi Coin In October 2025?Pi Coin experienced a volatile August, followed by an even more turbulent September. The near 48% single-day drop dragged the token down to a new ATL of $0.184. This marked a severe setback for the project and testing investor patience.
In October, often referred to as “Uptober” for its bullish seasonal trend, Pi Coin could attempt recovery. A 35% rise would help the altcoin reclaim strength, with price targets set at $0.286 and $0.340. A rally past these levels could push Pi Coin to $0.360, effectively erasing the recent crash.
If declines continue, however, Pi Coin risks slipping below the $0.256 support. A deeper fall could send the price toward $0.200, invalidating the bullish outlook. This would signaling further weakness for the altcoin as investor hesitation lingers.
Can Pi Network(PI) Bounce +15% From PRZ?In recent days, Pi Network ( OKX:PIUSDT ) has dropped more than -40% , raising the big question: Is Pi still a project we can rely on, or is momentum fading away?
Main Reasons Behind the Drop:
1-Mass token unlocks in September → Huge increase in supply created heavy selling pressure.
2-Rising exchange reserves → More than 420M now sitting on CEX wallets, a sign of potential sell waves.
3-Fast-track KYC & protocol upgrades → Gave many users access to their tokens, fueling more selling activity.
4-Low liquidity + whale sell-offs → A few large orders accelerated the decline.
The Pi community remains strong, but current supply shocks are outweighing demand. Until the project reaches full exchange listings and sustainable utility, traders should stay cautious and manage risk carefully.
---------------------------------------------------------------
Now let’s take a look at the PI Token chart on the 15-minute time frame .
The PI Token has formed a descending channel over the past day.
From the perspective of Elliott Wave theory , it looks like PI Token is completing a Double Three Correction(WXY) in the descending channel .
I expect PI Token to start rising as it enters or touches the Potential Reversal Zone(PRZ) again and rise to $0.289(+15%) . In general, a break of the upper line of the descending channel is a good sign for the PI token to rise .
Please respect each other's ideas and express them politely if you agree or disagree.
Pi Network Analysis (PIUSDT), 15-minute time frame.
Be sure to follow the updated ideas.
Do not forget to put a Stop loss for your positions (For every position you want to open).
Please follow your strategy and updates; this is just my Idea, and I will gladly see your ideas in this post.
Please do not forget the ✅' like '✅ button 🙏😊 & Share it with your friends; thanks, and Trade safe.

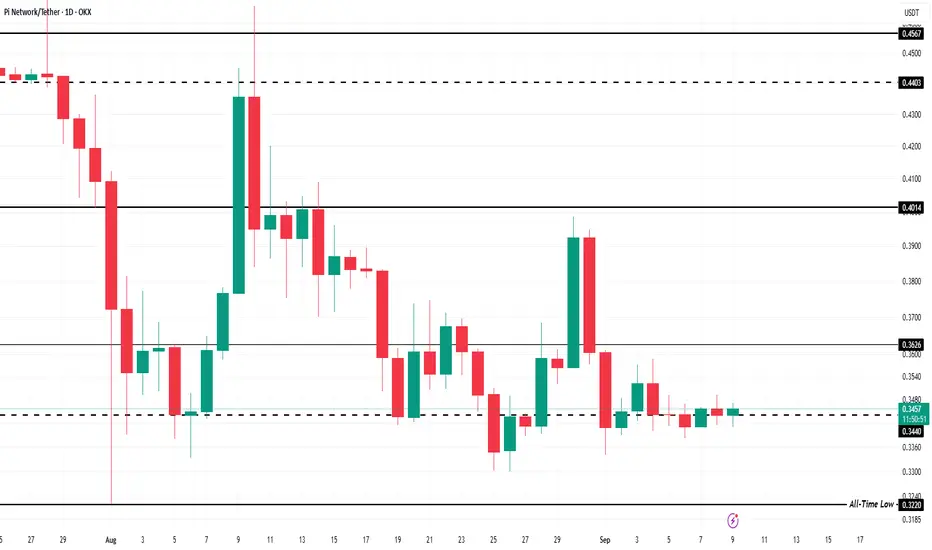
Pi Coin Price Eyes Breakout, Avoids All-Time Low ThreatPi Coin PAt the time of writing, Pi Coin is priced at $0.353, trading just below the critical resistance of $0.360. Flipping this level into a support floor would open the door for a rally toward $0.381, marking the first step in reversing its downtrend.
If achieved, this breakout would effectively end the ongoing decline. Considering both the RSI divergence and the MACD’s sustained bullish outlook. This scenario appears increasingly likely, provided broader market conditions remain neutral to positive.
However, risks remain. Should bullish momentum weaken, Pi Coin could slip through $0.351 and drop to $0.340. Falling below this would bring the threat of testing its all-time low, invalidating the bullish outlook and causing further concern for investors.
Pi Coin Price Downtrend Meets Resistance From Bitcoin’s RallyPi Coin is trading at $0.356 at the time of writing, sitting just below the $0.360 resistance level. The token has been caught in a month-long downtrend, making this resistance an important test for bullish sentiment.
If market support strengthens, Pi Coin could push past $0.360 and rise to $0.381. A successful breach would mark the end of the recent downtrend. This would open the possibility of further gains, supported by improving correlation with Bitcoin.
However, failure to clear $0.360 could leave Pi Coin vulnerable to renewed losses. The token risks slipping to $0.343 or lower, which would invalidate the bullish outlook. This would extend its period of weak performance, delaying any meaningful recovery.

Pi Coin Inflows Rise But Price Maintains Its Footing Under $0.35At the time of writing, Pi Coin is priced at $0.345, stuck just below the $0.351 resistance level. Attempts to break past this barrier over the last ten days have failed, underscoring the lack of sufficient buying power.
The cryptocurrency continues to hold steady near its $0.343 support level. Should investor inflows strengthen, Pi Coin could breach $0.351, flip it into support, and climb toward $0.360 in the short term.
However, weak market conditions pose a significant risk. If sentiment fails to improve, Pi Coin could slip toward $0.334 support. Such a drop would bring the token dangerously close to its all-time low of $0.322, invalidating the bullish outlook.
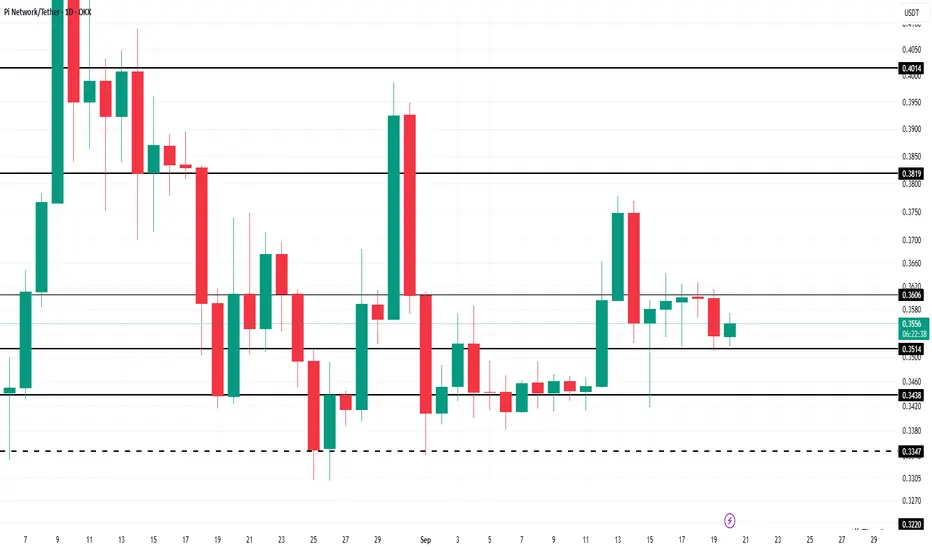
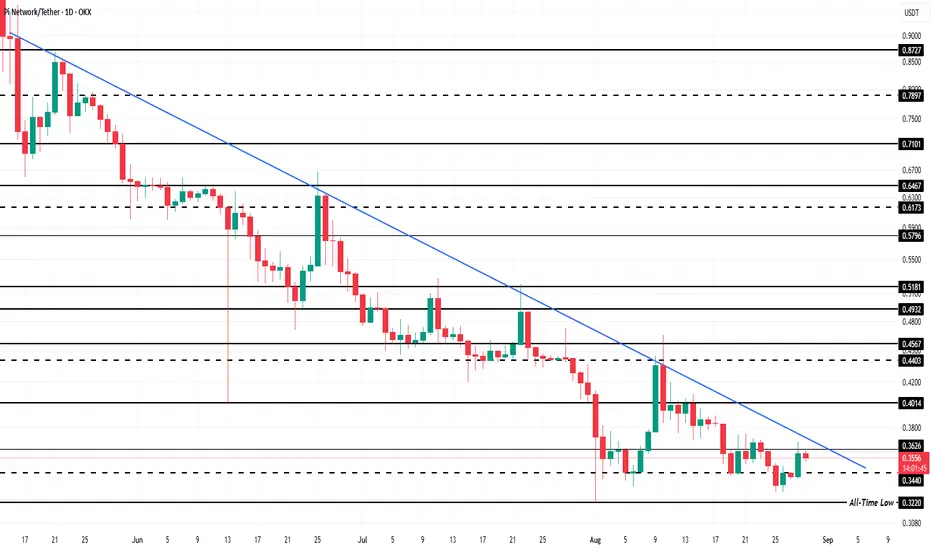
What To Expect From Pi Coin In September 2025?OKX:PIUSDT trades at $0.353, just below resistance at $0.362. The altcoin remains trapped in a downtrend lasting more than three months. Attempts to break out have failed four times, leaving the token vulnerable and positioned close to its all-time low as selling pressure intensifies.
If these conditions persist, OKX:PIUSDT could lose support at $0.344 . A decline to $0.322 would retest its all-time low, and continued selling may even push the price further down to $0.300. Such a move would confirm new weakness and mark fresh historic lows for the token.
If OKX:PIUSDT breaks the downtrend and reclaims $0.362 as support, it could rally toward $0.401 . This move would stabilize the market structure and counter bearish conditions. A recovery of this magnitude would challenge the ongoing selling narrative and provide short-term relief for investors holding the token.
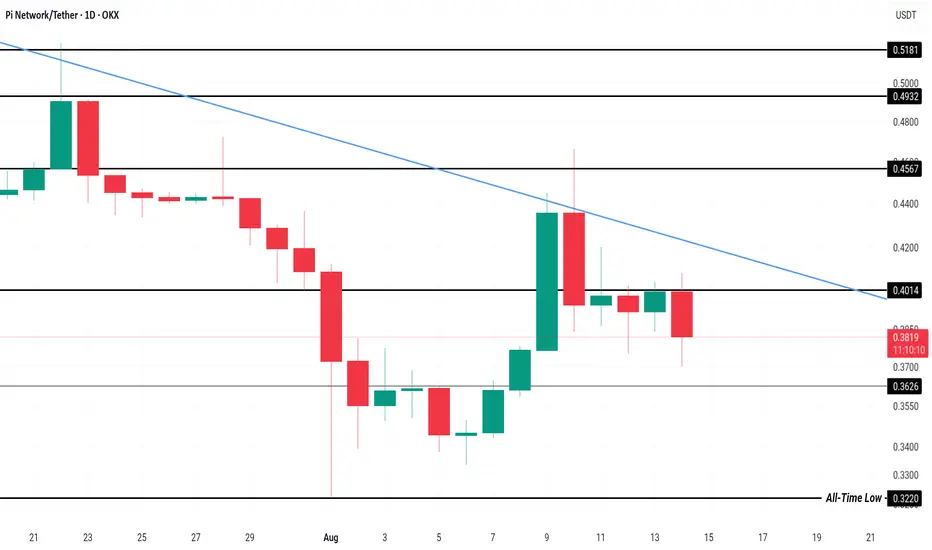
PI/USDT - Daily - BreakoutThe PI/USDT pair on the Daily timeframe presents a Potential Buying Opportunity.
Target Levels:
1st Resistance – 0.4430
2nd Resistance - 0.5850
Pi Coin Holders Exit Amid Altcoin's Shift from BitcoinAt present, Pi Coin is priced at $0.40, attempting to hold above this level as support. While the price is distancing itself from its ATL, it remains trapped in a persistent downtrend. Unless there is a significant shift in investor sentiment, Pi Coin may struggle to break free from this ongoing decline.
Pi Coin's correlation with Bitcoin has been declining, now standing at just 0.52. This reduction in correlation is especially troubling given Bitcoin’s recent surge, which saw the cryptocurrency form a new all-time high (ATH) within the last 24 hours.
Given the continued bearish behavior from investors, Pi Coin’s price may drop further towards the next support level at $0.36. If this support level fails to hold, Pi Coin could head back toward its ATL of $0.32, erasing recent gains and possibly setting the stage for further losses.
However, if Pi Coin can successfully bounce off the $0.40 support, there may be a chance for a rebound. A rise above this level could break the downtrend and push Pi Coin toward $0.44. This move would be crucial for Pi Coin’s recovery, but it would require significant investor confidence and buying pressure to materialize.
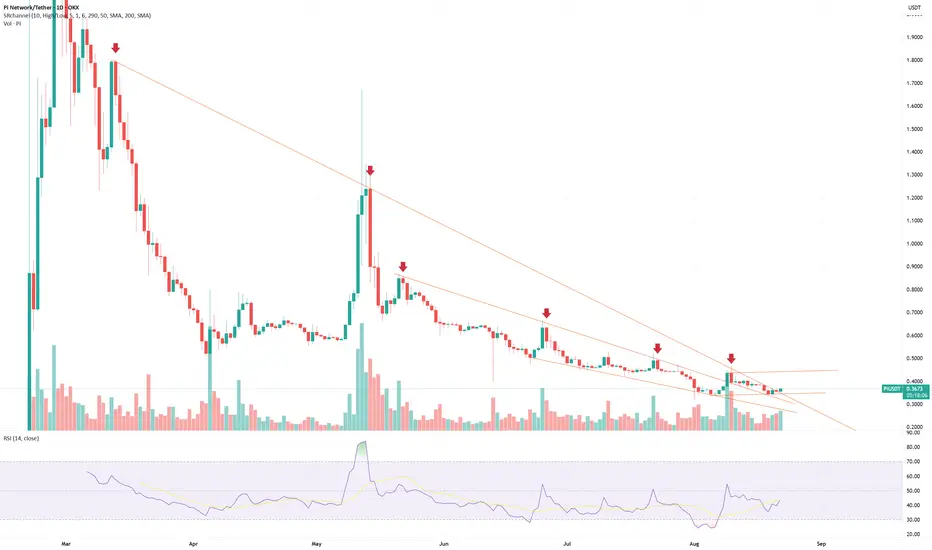
Pi Coin Price Fails 3-Month Downtrend Breakout; What’s Next?Currently, OKX:PIUSDT is trading at $0.385 , having failed to breach a crucial resistance at $0.440. This resulted in a 12% decline over the last three days , solidifying the ongoing three-month downtrend. The inability to break through key resistance levels has left Pi Coin vulnerable to further losses.
OKX:PIUSDT price is now just 16% away from its ATL of $0.322 , and mixed sentiment from technical indicators suggests that it may not hit this level in the immediate future. The altcoin is likely to attempt a bounce from its current support at $0.362.
However, if the broader market conditions worsen or investor sentiment turns more pessimistic, a drawdown could be imminent. This may lead OKX:PIUSDT to breach its support and fall to $0.322 , invalidating the current bullish-neutral outlook. In this case, Pi Coin could form a new ATL, pushing its price even lower and intensifying the downtrend.
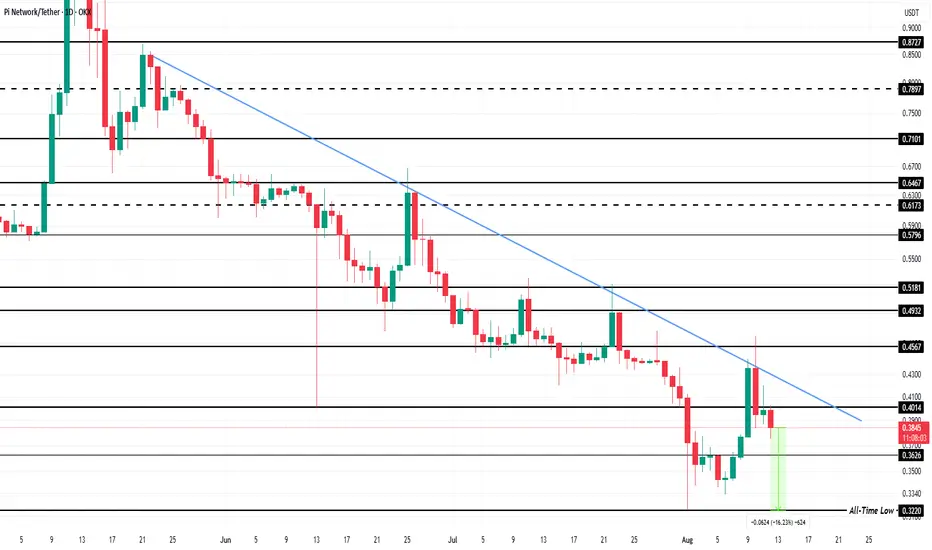
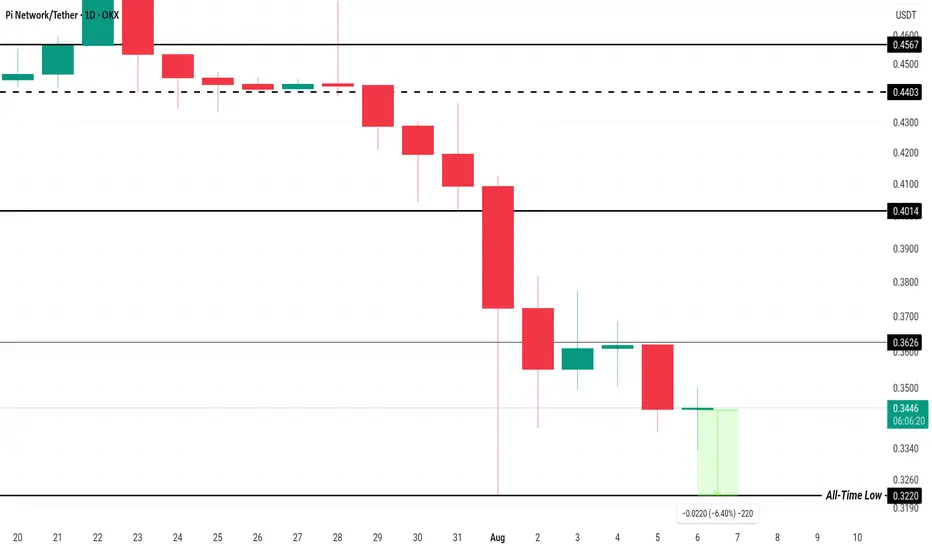
Pi Coin’s All-Time Low Price Journey: What’s Driving the DeclineOKX:PIUSDT price is currently at $0.343, just 6.4% away from revisiting its recent ATL of $0.322. Given the current market conditions, Pi Coin remains under significant pressure, making it likely that the price will continue to decline. A new ATL below the current $0.310 could be in the near future.
Given the ongoing outflows and the rising correlation with Bitcoin’s price movements, OKX:PIUSDT price trajectory appears bleak. It’s expected that the price will maintain its downtrend unless a shift in investor sentiment occurs. A decline through the support levels is highly probable , pushing the price toward further losses.
However, in the unlikely scenario that OKX:PIUSDT experiences a reversal, it would need to secure $0.362 as a support floor to initiate a rally. If the price manages to break this barrier, it could rise to $0.401 , invalidating the current bearish outlook and offering hope for a price recovery.
PI NETWORK : Will it finally be pumped?Hello friends🙌
👀According to the decline we had, you can see that the price has reached an important area and has formed a floor in this area. Considering the classic ego that is forming on support, you can enter the trade by breaking the resistance, of course, by managing risk and capital and moving with it to the specified goals.
🔥Follow us for more signals🔥
*Trade safely with us*
PI bullish Breakout!! BUY BUYHello traders i hope you are doing as we can see Market done breakout from falling wedge as well as we are having liquidity and FVG which is not metigated yet so i am expecting market back to FVG
buy buy!!

Bearish Pressure Builds on PIUSDT – Here’s the Trade Plan📌 Idea
PIUSDT is showing weakness after testing the recent resistance at 0.85944. Price is now trading below the VWMA, indicating fading bullish momentum and potential for further downside.
The setup favors a short entry as price fails to reclaim above the resistance zone, forming lower highs and showing signs of rejection.
🔽 Trade Setup
• Entry: 0.80799
• Stop Loss: 0.90983 (above resistance zone and wick high)
• Take Profit 1 (TP1): 0.66507 (first support zone)
• Take Profit 2 (TP2): 0.58008 (previous demand area)
⚙️ R:R Breakdown
• TP1 R:R ≈ 1.92
• TP2 R:R ≈ 3.31
This gives a good reward potential relative to the defined risk.
🔍 Technical Highlights
• Recent Resistance Level at 0.85944 rejected multiple times
• VWMA is trending above price – bearish bias confirmed
• Support Zone near 0.66507 acting as TP1
• TP2 marks a significant previous low near 0.58008
🧠 Idea Summary
I'm watching for further rejection under 0.85944 and signs of weakness to ride this short toward the support zones. This trade remains valid as long as 0.90983 holds as resistance. A break above this level invalidates the setup.

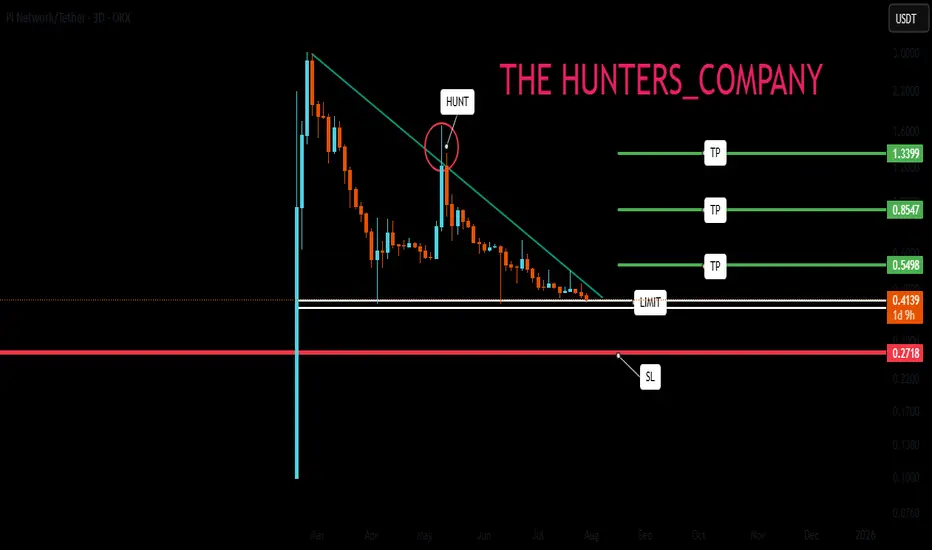
If you're stuck, watch (full analysis)Hello friends
Given the high growth of this token, now that it has made a good correction, it makes sense to buy in stages and with capital management and move with it to the specified goals.
*Trade safely with us*

PI UPDATEHello friends
According to the triangle pattern that the price has formed, you can see that we had a decline and after that the price has managed to create a small ascending channel that indicates the inflow of money and we can expect the price to grow to the ceiling of the channel within the channel itself and in case of failure in the lower ranges, other buying steps have been identified.
*Trade safely with us*

PI/USDT:SIGNALHello friends
Given the price growth, you can see that we had a stop and a triangle pattern was formed, which is a continuation pattern of the trend.
Now, given the complex market conditions, our suggestion to you is to buy in stages and be sure to observe risk and capital management.
I have also specified goals for you.
*Trade safely with us*

Just In: $PI Dips 6% Losing The $1 Pivot- Is There Still Hope?The price of the crypto currency NASDAQ:PI saw s noteworthy dip today, down by 6% approaching All time Low (ATL). With massive selling pressure, NASDAQ:PI has lose the $1 pivot to the bears.
However, with the appearance of a falling wedge, it clearly hints at an impending bullish reversal on the horizon with a speculated 350% surge albeit the crypto is having its own fair share of the marker's volatility.
With the RSI at 31 further hinting at a trend reversal, a breakout might be lurking around the corners.
Pi Price Live Data
The live Pi price today is $0.678989 USD with a 24-hour trading volume of $213,832,968 USD. Pi is down 5.03% in the last 24 hours. The current CoinMarketCap ranking is #26, with a live market cap of $4,612,460,558 USD. It has a circulating supply of 6,793,134,138 PI coins and a max. supply of 100,000,000,000 PI coins.
