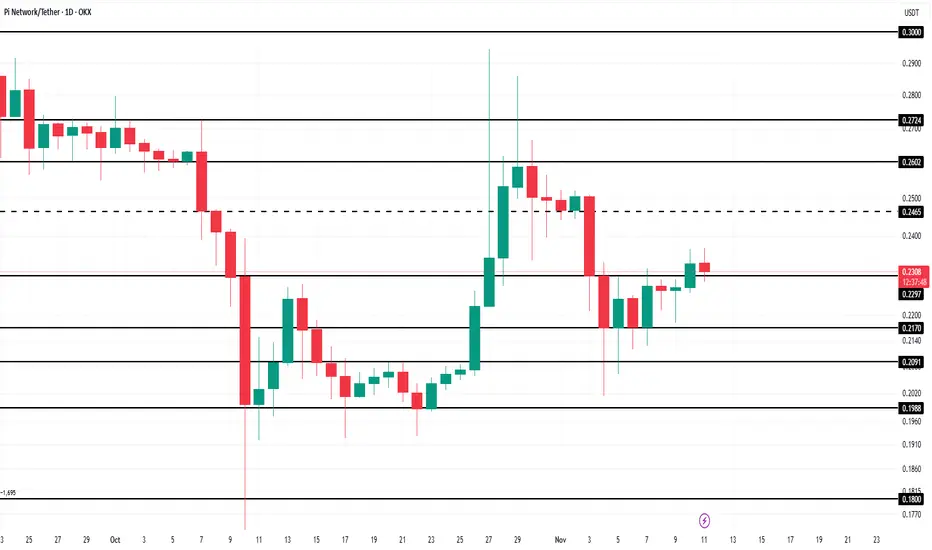
Pi Coin Investors’ Remain Weak as Price Eyes 15% Drop RecoveryPi Coin’s price stands at $0.235 at the time of writing, after successfully breaching the $0.229 resistance level within the last 24 hours. The altcoin now appears to be regaining some lost ground from its late October decline.
For Pi Coin to fully recover from its 15% drop, the price must break through the $0.246 resistance and rally toward $0.260. Achieving this would reinforce the bullish outlook and restore market confidence among cautious investors.
However, if the bullish momentum weakens, Pi Coin could slip below $0.229 again and test the $0.217 support level. A breakdown beneath this support would invalidate the bullish thesis and expose the cryptocurrency to further downside risks.
Piusdtcoin
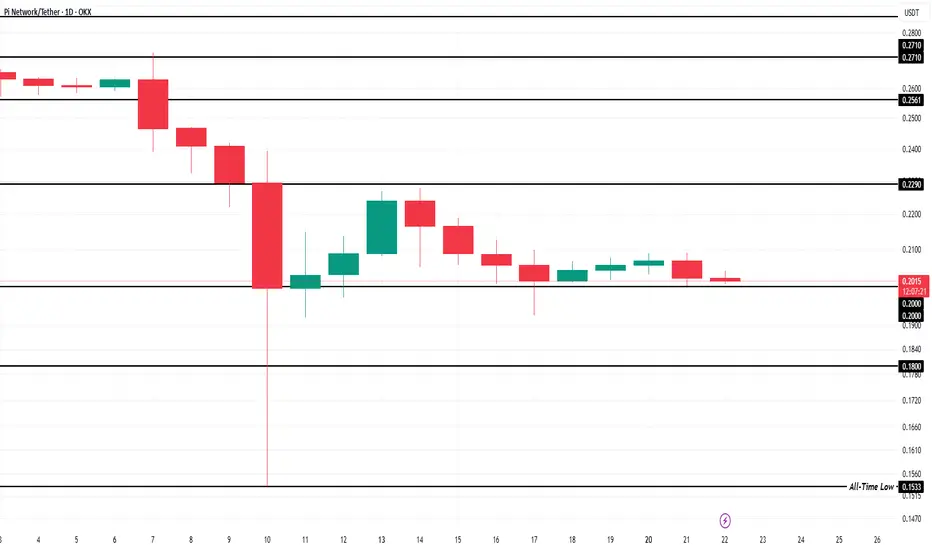
Pi Coin Price Consolidates — Next Stop: All-Time Low?At the time of writing, Pi Coin is priced at $0.203. It has maintained its position above the crucial $0.200 support for the past two weeks. Despite the mounting bearish pressure, the altcoin has managed to stay afloat, indicating some degree of resilience. If this consolidation holds, the price may continue hovering around current levels.
However, if bearish sentiment deepens and selling accelerates, Pi Coin may lose its grip on the $0.200 level. A breakdown below this floor could drag the price down to the $0.180 support level. This would place the cryptocurrency dangerously close to its all-time low of $0.153, a scenario that could spook long-term holders.
On a more optimistic note, if Pi Coin rebounds from its $0.200 base, it could target a move toward $0.229. A successful breach of this resistance would invalidate the current bearish setup and possibly set the stage for a short-term recovery.
Pi Coin Price Eyes Breakout, Avoids All-Time Low ThreatPi Coin PAt the time of writing, Pi Coin is priced at $0.353, trading just below the critical resistance of $0.360. Flipping this level into a support floor would open the door for a rally toward $0.381, marking the first step in reversing its downtrend.
If achieved, this breakout would effectively end the ongoing decline. Considering both the RSI divergence and the MACD’s sustained bullish outlook. This scenario appears increasingly likely, provided broader market conditions remain neutral to positive.
However, risks remain. Should bullish momentum weaken, Pi Coin could slip through $0.351 and drop to $0.340. Falling below this would bring the threat of testing its all-time low, invalidating the bullish outlook and causing further concern for investors.
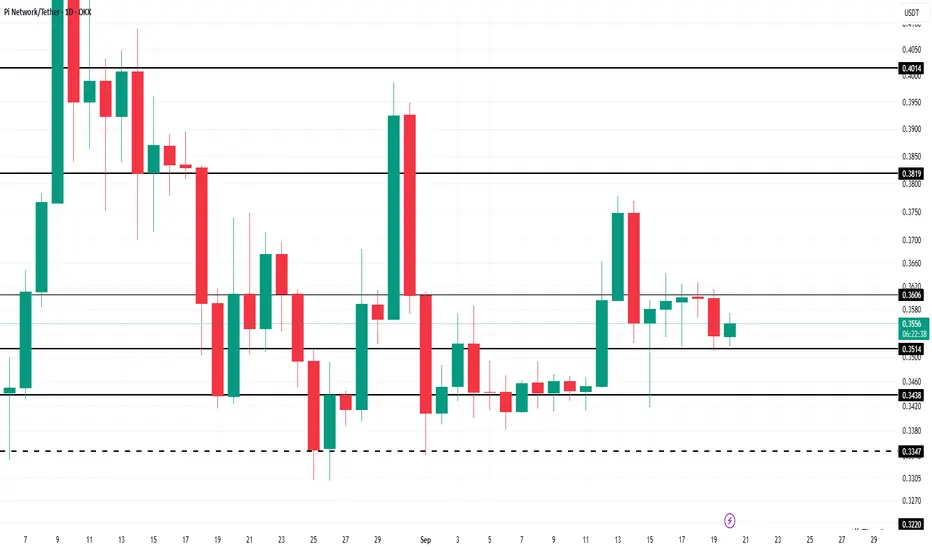
Pi Coin Price Downtrend Meets Resistance From Bitcoin’s RallyPi Coin is trading at $0.356 at the time of writing, sitting just below the $0.360 resistance level. The token has been caught in a month-long downtrend, making this resistance an important test for bullish sentiment.
If market support strengthens, Pi Coin could push past $0.360 and rise to $0.381. A successful breach would mark the end of the recent downtrend. This would open the possibility of further gains, supported by improving correlation with Bitcoin.
However, failure to clear $0.360 could leave Pi Coin vulnerable to renewed losses. The token risks slipping to $0.343 or lower, which would invalidate the bullish outlook. This would extend its period of weak performance, delaying any meaningful recovery.

What To Expect From Pi Coin In September 2025?OKX:PIUSDT trades at $0.353, just below resistance at $0.362. The altcoin remains trapped in a downtrend lasting more than three months. Attempts to break out have failed four times, leaving the token vulnerable and positioned close to its all-time low as selling pressure intensifies.
If these conditions persist, OKX:PIUSDT could lose support at $0.344 . A decline to $0.322 would retest its all-time low, and continued selling may even push the price further down to $0.300. Such a move would confirm new weakness and mark fresh historic lows for the token.
If OKX:PIUSDT breaks the downtrend and reclaims $0.362 as support, it could rally toward $0.401 . This move would stabilize the market structure and counter bearish conditions. A recovery of this magnitude would challenge the ongoing selling narrative and provide short-term relief for investors holding the token.
PI/USDT - Daily - BreakoutThe PI/USDT pair on the Daily timeframe presents a Potential Buying Opportunity.
Target Levels:
1st Resistance – 0.4430
2nd Resistance - 0.5850
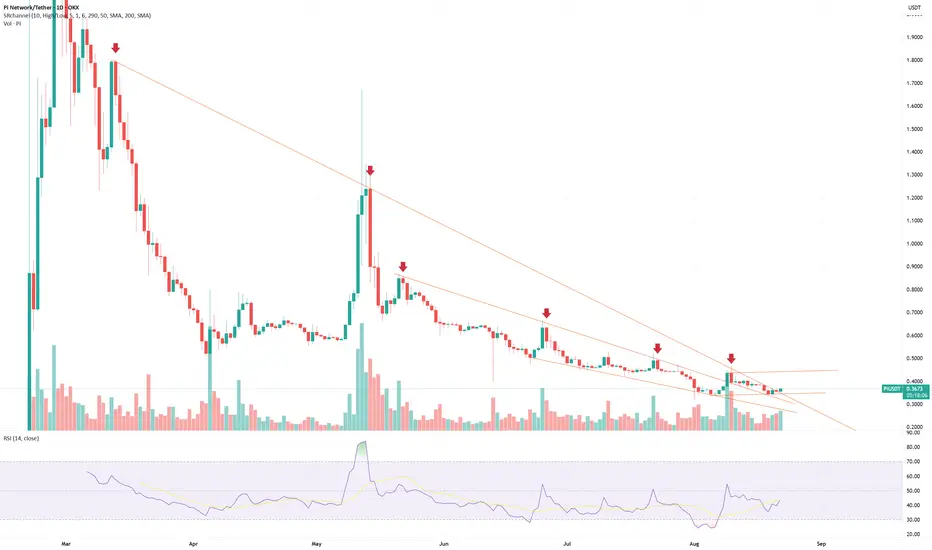
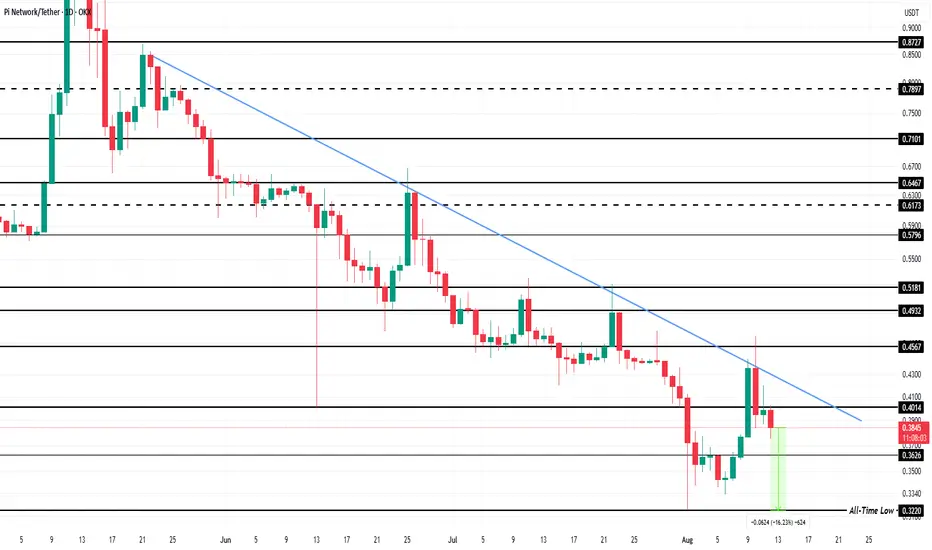
Pi Coin Price Fails 3-Month Downtrend Breakout; What’s Next?Currently, OKX:PIUSDT is trading at $0.385 , having failed to breach a crucial resistance at $0.440. This resulted in a 12% decline over the last three days , solidifying the ongoing three-month downtrend. The inability to break through key resistance levels has left Pi Coin vulnerable to further losses.
OKX:PIUSDT price is now just 16% away from its ATL of $0.322 , and mixed sentiment from technical indicators suggests that it may not hit this level in the immediate future. The altcoin is likely to attempt a bounce from its current support at $0.362.
However, if the broader market conditions worsen or investor sentiment turns more pessimistic, a drawdown could be imminent. This may lead OKX:PIUSDT to breach its support and fall to $0.322 , invalidating the current bullish-neutral outlook. In this case, Pi Coin could form a new ATL, pushing its price even lower and intensifying the downtrend.
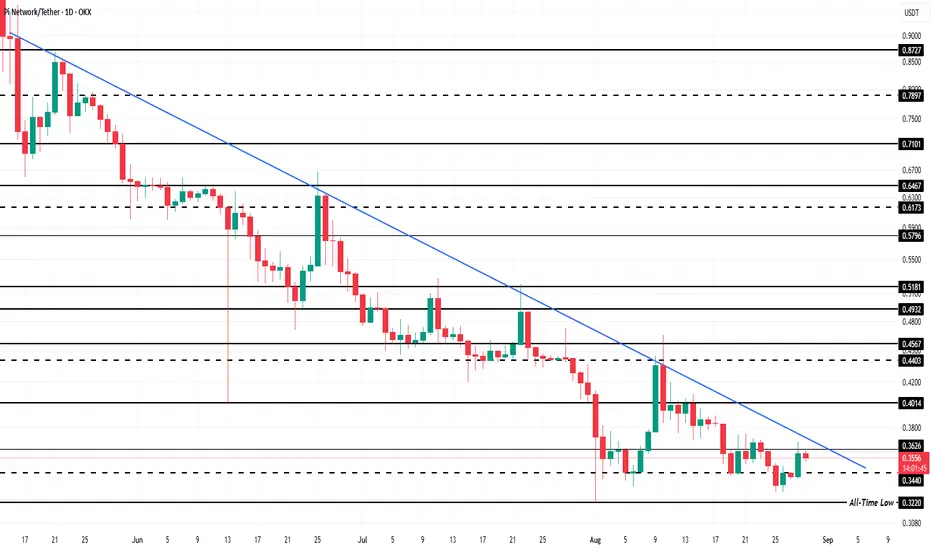
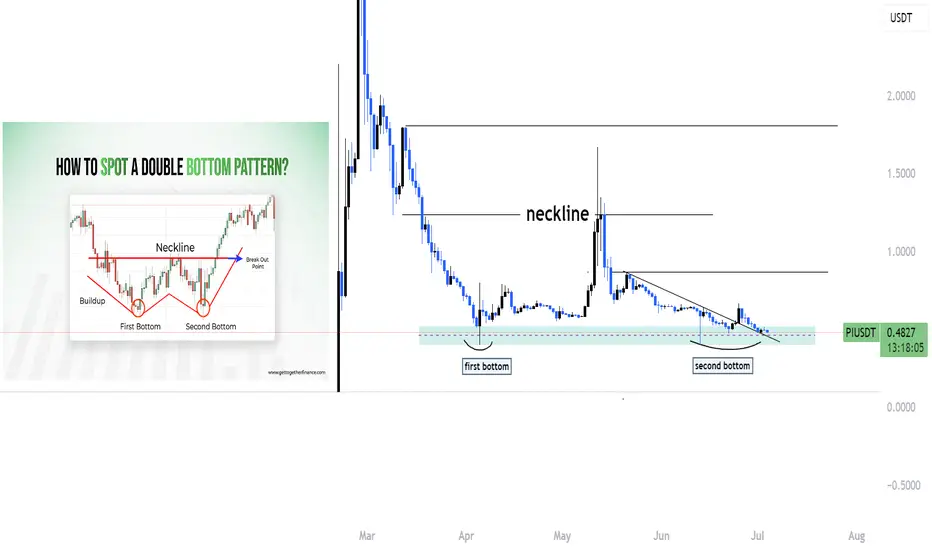
Piusdt making double bottom ??Hello traders, I hope you're all doing well!
Currently, we're seeing an interesting setup on PI that could lead to a potential bullish move. Let's break it down:
🔹 Double Bottom Formation
PI appears to be forming a double bottom on the higher time frame — a classic bullish reversal pattern. This indicates that the market has tested a key support level twice and failed to break lower, which often suggests that selling pressure is weakening.
🔹 Trendline Breakout
In addition to the double bottom, we’ve also broken out of a descending trendline that has been acting as dynamic resistance for some time. A clean breakout with volume often signals a shift in market structure from bearish to bullish.
🔹 Strong Support Zone & Liquidity
We are still holding above a strong support zone, where previous demand has stepped in. This area has likely accumulated a lot of liquidity, with stop-losses from retail traders sitting just below. If price holds this level, it may trap sellers and trigger a short squeeze, pushing the price higher.
🔹 Possible Upside Move
As long as we remain above this support and confirmation continues, there is a high probability of an upward continuation. This could be the start of a bullish leg, especially if we see a break of recent highs with strength.
📈 Conclusion
This confluence of technical signals — double bottom, trendline breakout, and liquidity resting below support — gives us a strong reason to watch this setup closely.
👉 Like and follow if you’re seeing the same structure or planning to trade this move. Let’s ride it together!
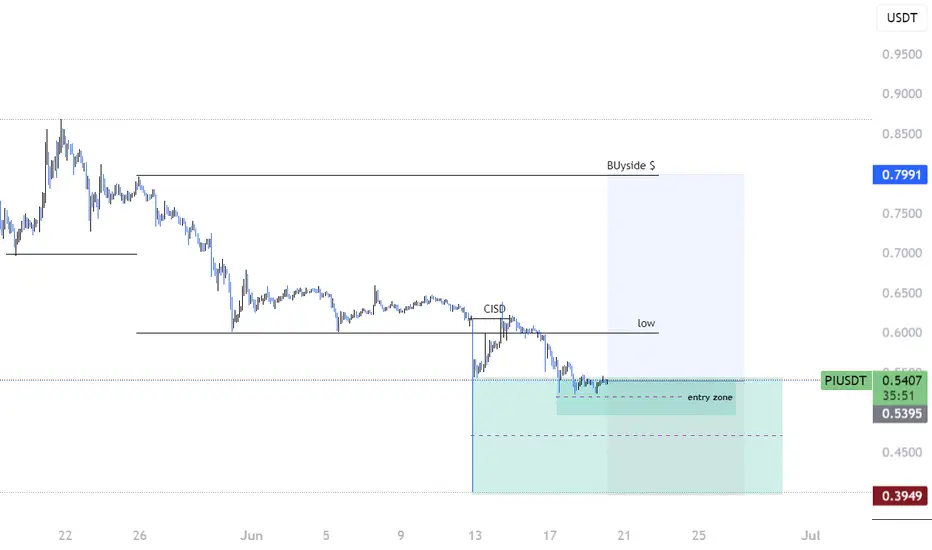
Pi long !! proper risk management Hello traders, keeping a close eye on NASDAQ:PI — forming a solid pattern.
Strong wick indicates a potential buy zone in this area.
We do have some untapped downside liquidity below.
However, with CRT in play, a bullish move is likely.
We’ve already completed CISD confirmation on the 3H timeframe.
Looks like a good opportunity to position for the upside.
PI breakout !!Trendline Break:
Price has broken above a descending trendline — often a bullish signal.
A small retest is visible, indicating confirmation of the breakout.
Equal Highs (Liquidity Pool):
Labelled “$$ same highs” — this suggests buy-side liquidity is resting above that level.
Price often targets these highs to grab liquidity before a reversal or continuation.
BSL (Buy-Side Liquidity):
Two BSL levels marked; price may aim for these as upside targets.
FVG (Fair Value Gap):
The green shaded zone above represents an imbalance (FVG), usually a magnet for price.
Price may fill this area, targeting between 0.95 – 1.10 USDT.
📈 Expected Move (Bullish Bias):
Short-term: Move above the “$$ same highs” to run liquidity.
Mid-term: Push towards first BSL (~0.75 USDT).
Long-term: Potential fill of the FVG zone around 1.00 USDT.
⚠️ Watch for:
“same highs” area (could be a stop hunt).

If you're stuck, watch (full analysis)Hello friends
Given the high growth of this token, now that it has made a good correction, it makes sense to buy in stages and with capital management and move with it to the specified goals.
*Trade safely with us*

PI UPDATEHello friends
According to the triangle pattern that the price has formed, you can see that we had a decline and after that the price has managed to create a small ascending channel that indicates the inflow of money and we can expect the price to grow to the ceiling of the channel within the channel itself and in case of failure in the lower ranges, other buying steps have been identified.
*Trade safely with us*

PI/USDT:SIGNALHello friends
Given the price growth, you can see that we had a stop and a triangle pattern was formed, which is a continuation pattern of the trend.
Now, given the complex market conditions, our suggestion to you is to buy in stages and be sure to observe risk and capital management.
I have also specified goals for you.
*Trade safely with us*

Just In: $PI Dips 6% Losing The $1 Pivot- Is There Still Hope?The price of the crypto currency NASDAQ:PI saw s noteworthy dip today, down by 6% approaching All time Low (ATL). With massive selling pressure, NASDAQ:PI has lose the $1 pivot to the bears.
However, with the appearance of a falling wedge, it clearly hints at an impending bullish reversal on the horizon with a speculated 350% surge albeit the crypto is having its own fair share of the marker's volatility.
With the RSI at 31 further hinting at a trend reversal, a breakout might be lurking around the corners.
Pi Price Live Data
The live Pi price today is $0.678989 USD with a 24-hour trading volume of $213,832,968 USD. Pi is down 5.03% in the last 24 hours. The current CoinMarketCap ranking is #26, with a live market cap of $4,612,460,558 USD. It has a circulating supply of 6,793,134,138 PI coins and a max. supply of 100,000,000,000 PI coins.
