Pivx


Broke above descending trendline$PIVX Broke above the descending trendline with great volume, touched ~2440sats resistance and did some pullback.
Now it looks like its holding. MACD rising, RSI over 80 so strength looks healthy.
Try to enter below 2200 if you didn't get the alert from the UCTS buy signal #PIVX

PIVX : 50% SHORT TERM profits Opportunity. - A Falling wedge pattern creation is almost done and waiting for a confirmation breakout above the upper resistance line.
- RSI seems to be comfortably in a good movement currently at around 55.
- Both 50EMA and 89EMA are trying to make their path on favor of the bulls and can be taken as confirmation for a breakout if they come below the price in the following 4H candle charts.
- Volume is trying to increase and needs some strength to help a confirmation of opening a long position.
Accumulation Area : 2021 sats - 2150 sats
Distribution Targets :
Target 1 : 2239 sats
Target 2 : 2374 sats
Target 3 : 2483 sats
Target 5 : 2592 sats
Target 6 : 2747 sats
Target 7 : 2945 sats
Stop Loss : A close below 1813 sats
**All targets are expected to be achieved upto in 30 - 35 days.
Remember to drop your LIKES and press the FOLLOW button if you are interested by our forecast and be free to DISLIKE the post or right your COMMENT if you not convinced by the forecast. Thank you for your time to read our posts anyways. With Regards.
Good Luck.
Legal disclaimer:
Information on this channel is our team's analyst's "opinion" based on data available at this point in time. These opinions are not recommendations to buy or sell securities/commodities and cryptocurrencies. Trading and investing is a risk and you should not rely on this data to make any financial decisions. You must consult a financial advisory licensed by regulatory agencies in your legal jurisdiction. All information stated here and in our reports don't guarantee any possible profits or losses. Please do consider to do your own due diligence and research when making any kind of a transaction with financial implications.
With Regards. TeamTWA.
You can give us your feed backs and suggestions on our effort in addition to this your questions here in trading view or in our telegram channel by the same name togetherweaccumulate.

Daily Bullish Signal $PIVX #PIVX (23 Jan 2019)BLUE ARROW indicates the EXPECTED Time and Targets
Level Stoploss point up to maximize profit and reduce risk
I'm working all the time, even in Bearish Market

PIVX$PIVX
-Ichi cloud looks amazing
-Retesting the break above the descending triangle
-Bollinger Bands are squeezing
We will see a big move very soon. I am getting a bag.


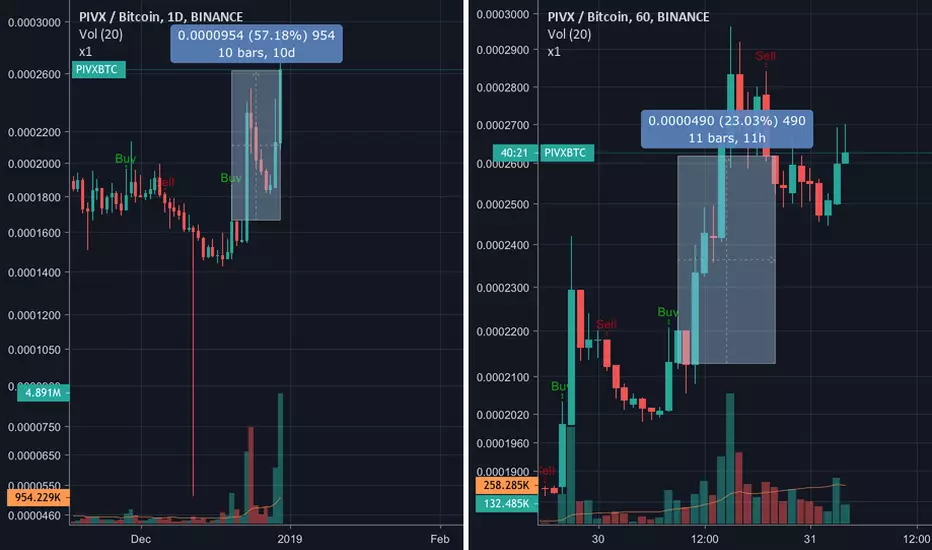
top coin today PIVX - buy signalled by X1 indicatorTop coin today at Binance is PIVX with 30% gain. Buy signal generated by new indicator X1 today using 1hr timeframe, possible gain of 23%. On longer timeframe of 1day, buy signal was generated 10days ago, possible gain of 57% today.
Pivx pivxbtc pump .618 fib level test with fractalcatcing a fractal in those pumps matters for buyback lower eyes on red box

PIVXPIVXBTC look at the next couple of days, if we stay at the level and start turning up - a good sign.
Is it Elliott Waves 12345 ? May it be, now we are at the good support level, and this formation is powerful by 1H these days. 38.20%Fibonacci.


Pivx ready to breakoutnice entry on this bullish pennant for pivx right now, time to pull the trigger!

PIVX Trading AdviceBuy Price: Yellow Line
TP: Green Lines
Moon: White Line
Support: Blue Line
SL: Red Line (I don't recommend you to sell in loss.)
Invest Suggestion: 5-10 Percent
Profit Expectations: 5, 10 or >20 Percent
Just hold and watch. Sell when you get some profit. Good Luck!
Looks Good? Leave a like, share and tell me in comments if my trading advices are working for you.
Thanks for visiting.

PIVX approaching support... will the uptrend be compromised?
Following the previous idea, which you can find below, the reaction to the zPIV announcement indeed was positive and yesterday price has made another surge by 30% over the Bitcoin, reaching btc 0.0002488 high. PIVIX has been trending up as expected, although now the correctional phase has started.
Currently it is trading near 20k satoshis psychological support. It is also a strong technical support where two Fibonacci retracement levels are located. First is 23.2% retracement from the all-time low, and second is 78.6% Fibs from the 17 October low.
While it could be the starting point of the uptrend continuation, PIVX yet to confirm it, by rejecting current support area, that is located between 0.0002020 and 0.0001960. But, price might break below, that will suggest more downside pressure being put on the PIVX.
Next support is seen at 61.8% Fibs, that is 0.0001730. The key support is located at 78.6% Fibs that is btc 0.0001520. If price breaks below key support, the upside potential will be compromised while the long-term downtrend domination is likely to continue.
In short, current support (around 20k satoshis) will be the decision-making area. It is important to watch current price action as rejection of the support should have a very positive outcome on the price. On the other hand, daily break and close below the 0.0001964 level will imply the downside pressure on the PIVX/BTC.
Support:
1. 0.0002020
2. 0.0001965
3. 0.0001730
4. 0.0001530
Resistance:
1. 0.0002490

There is a trading opportunity to buy in PIVXBNBTechnical analysis:
. PIVX/BINANCECOIN is in a range bound and the beginning of uptrend is expected.
. The price is below the 21-Day WEMA which acts as a dynamic resistance.
. The RSI is at 46.
Trading suggestion:
. There is a possibility of temporary retracement to suggested support zone (0.10200 to 0.08800). if so, traders can set orders based on Price Action and expect to reach short-term targets.
Beginning of entry zone (0.10200)
Ending of entry zone (0.08800)
Entry signal:
Signal to enter the market occurs when the price comes to " Buy zone " then forms one of the reversal patterns, whether " Bullish Engulfing ", " Hammer " or " Valley " in other words,
NO entry signal when the price comes to the zone BUT after any of the reversal patterns is formed in the zone.
To learn more about " Entry signal " and the special version of our " Price Action " strategy FOLLOW our lessons:
Take Profits:
TP1= @ 0.13370
TP2= @ 0.15440
TP3= @ 0.17700
TP4= @ 0.20800
TP5= @ 0.29700
TP6= @ 0.36900
TP7= @ 0.44200
TP8= @ 0.54500
TP9= @ 0.67500
TP10= Free


PIVX comingvolume seems pretty good and price is touching bottom line at the moment so it means buy opportunity. I am expecting a breakout

PIVXBTC BINANCE MRMEGPIVXBTC in binance exchange - look good!! -in 1 day chart - you can see support and opposition line in the chart - please follow and like us and give us some comments about ideas - thanks for your following and liking us

PIVX time to collapse some more? Buy Green
Sell Red
//
it's mainly for swing trading, i use the 3 day / 15 day / monthly charts with it and it works perfectly,
//
it works good for stocks and cryptocurrency.
//
you will use heiken ashi chart style and turn on the EMA DOTS indicator.
once the indicator is on you will hide the heiken ashi so you only see the dots.
//
when a green dot 2.18% 3.00% 3.00% -0.78% -0.78% -6.68% -7.44% -7.44% appears you buy, if a green dot 2.18% 3.00% 3.00% -0.78% -0.78% -6.68% -7.44% -7.44% appears after that green dot 2.18% 3.00% 3.00% -0.78% -0.78% -6.68% -7.44% -7.44% you hold your investment.
if a red dot appears you sell your position. easy as that.
//
the standard dots setting will be set to 10 - use this for any chart above 3 days
change the dots setting to 6 for 3day charts and below
//
shorter time frames will be choppy.
//
larger time frames will be smooth.
//
*Daytrading smaller timeframes is possible but not recommended.

PIVX seems good to buy hereAs you can see pivx is holding trend line support.
As of now it is on support where we wanted buy.
Get some here.
Buy between 2000-2100
Current price 2064
Targets:- 2195,2300,2385,2490
Hold for 0-4 weeks.
Its price can go down even more if market gets crash.
Don't buy 100% of your portfolio for this coin. Buy 40-50% here and rest keep for if market gets crash.
Invest at your own risk. profit is yours and loss is also yours.

Accumulate PIVXThis is a no brainer. Accumulate in the zone and hodl. PIVX has hit rock bottom recently and has established a slight up trend with intermittent spikes in price. RSI is strong. Stoch allows for growth. Price is above the kumo for the first time in 6 months. All positive signs. Just need to be patient.

PIVX Bull Trend Has Started According to Tom Demark CountPivx gave a green 2 on the daily chart which is a clear buy signal according to Tom Demark count. It also broke daily MA20 which is a also a very bullish signal. Stoch RSI is oversold and has a lot of room to go up.
I expect the price continue to increase.
Here is my trading idea:
Buy: 2150 - 2185
Sell targets: 2234 - 2290 - 2328 - 2480
Stop loss: 1975

